Regression Analysis for Market Price of Houses
Added on 2023-05-28
11 Pages2643 Words328 Views
STATISTICS
STUDENT ID:
[Pick the date]
STUDENT ID:
[Pick the date]

1) Introduction
The objective of this report is to present a suitable regression model based on the given
variables. There are five quantitative variables that have been provided in the form of market
price, Sydney Price Index, Annual % change, total size in square meter and also age of the
house. The sample size for the data provided is 15 as data has been provided for 15 years.
Considering the given variables, the first task is to identify a suitable model which has one
dependent variable and four independent variables. Since the measurement scale for each of
the variables is a ratio scale with a defined zero coupled with numerical values, it is easier to
include all the given variables in the form of a multiple regression model. With regards to
such model, the suitable dependent variable would be the price of the house while the other
four variables would serve as the independent variables. This seems quite appropriate
considering that price of house must be function of the area and age. Also, it should also be
dependent on the change in the price index and annual change in property prices that is
witnessed in the underlying area. Thus, a multiple regression model would be framed using
these variables and subsequently refined to remove those independent variables which are not
found to be significant.
2) Scatter Plot
The objective here is to obtain the scatter plot with regards to each of the independent
variables and the dependent variable identified for the multiple regression model.
The scatter plot between Sydney price index (as independent variable) and market price (as
dependent variable) is indicated below.
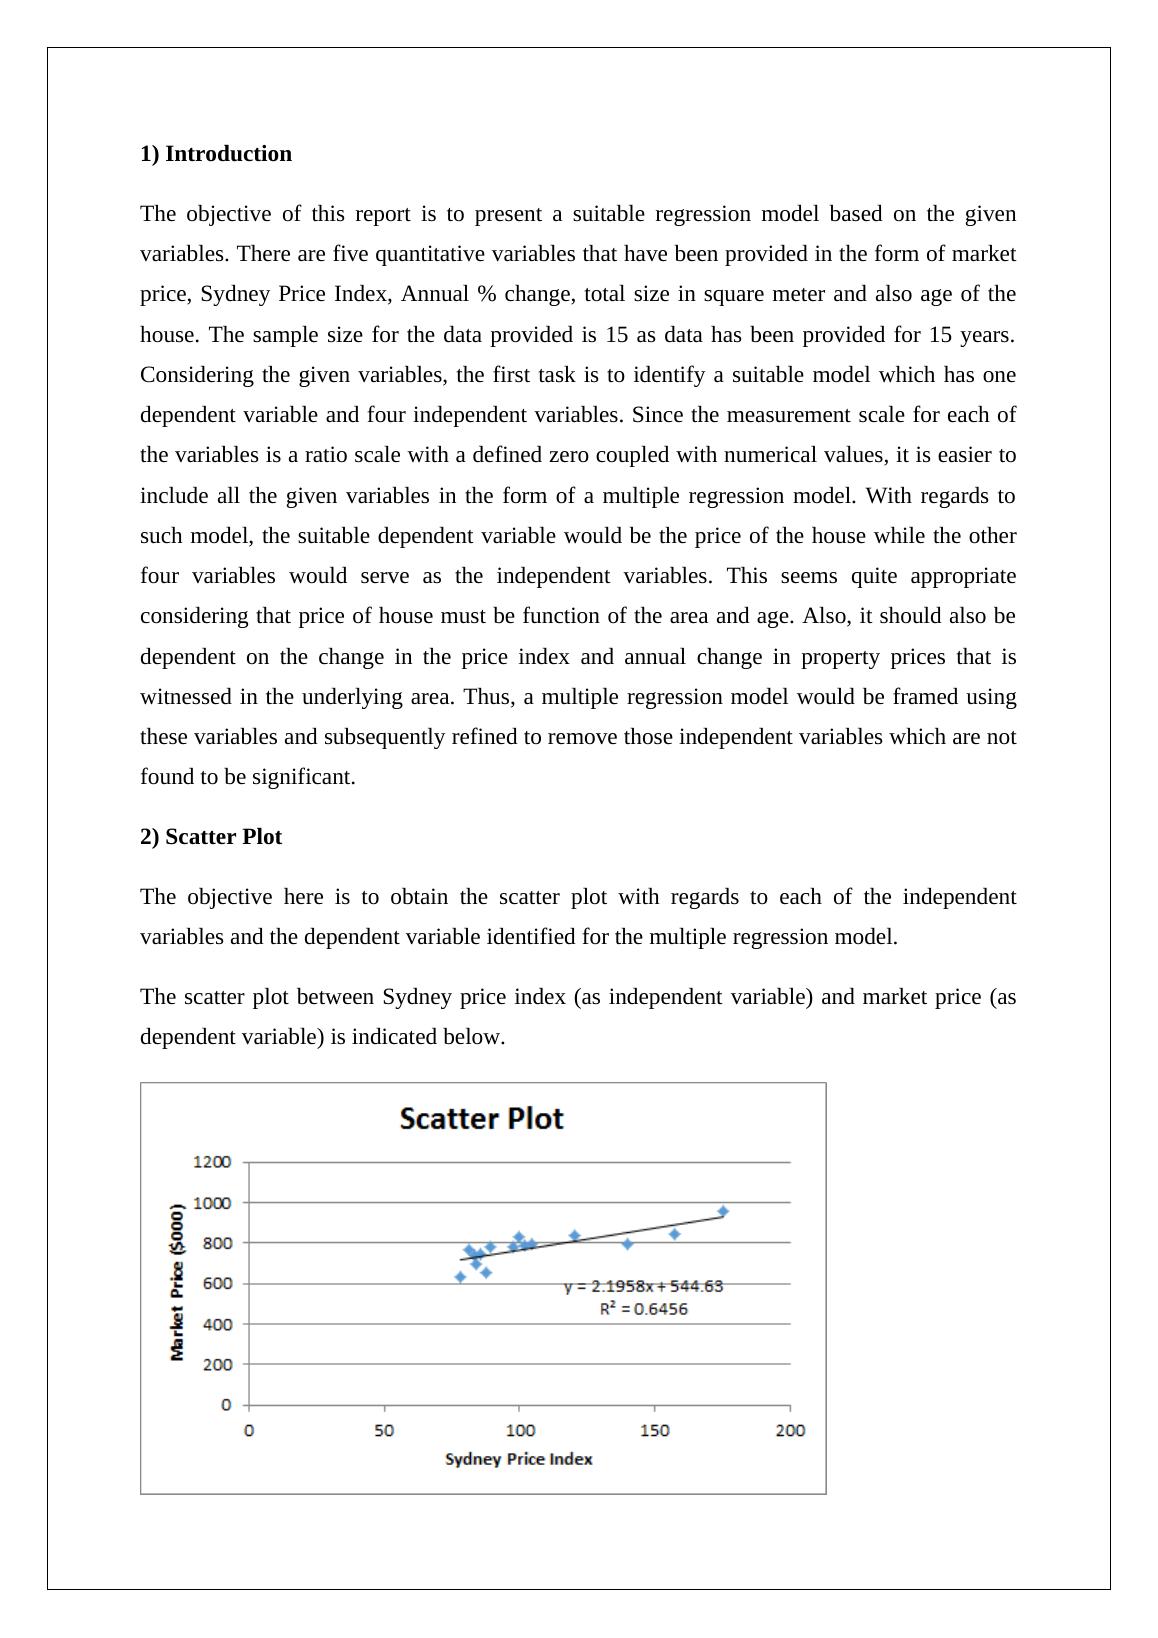
It is apparent that the best fit line for the above plot is upward slopping which implies that
positive linear relationship tends to exist between the given independent and dependent
variable. Also, considering the low extent of deviation of scatter points from the line of best
fit, it can be concluded that the magnitude of correlation is high with the corresponding
correlation coefficient exceeding 0.8. Thus, the association between the Sydney Price Index
and the market price seems to be significant and positive in nature (Flick, 2015).
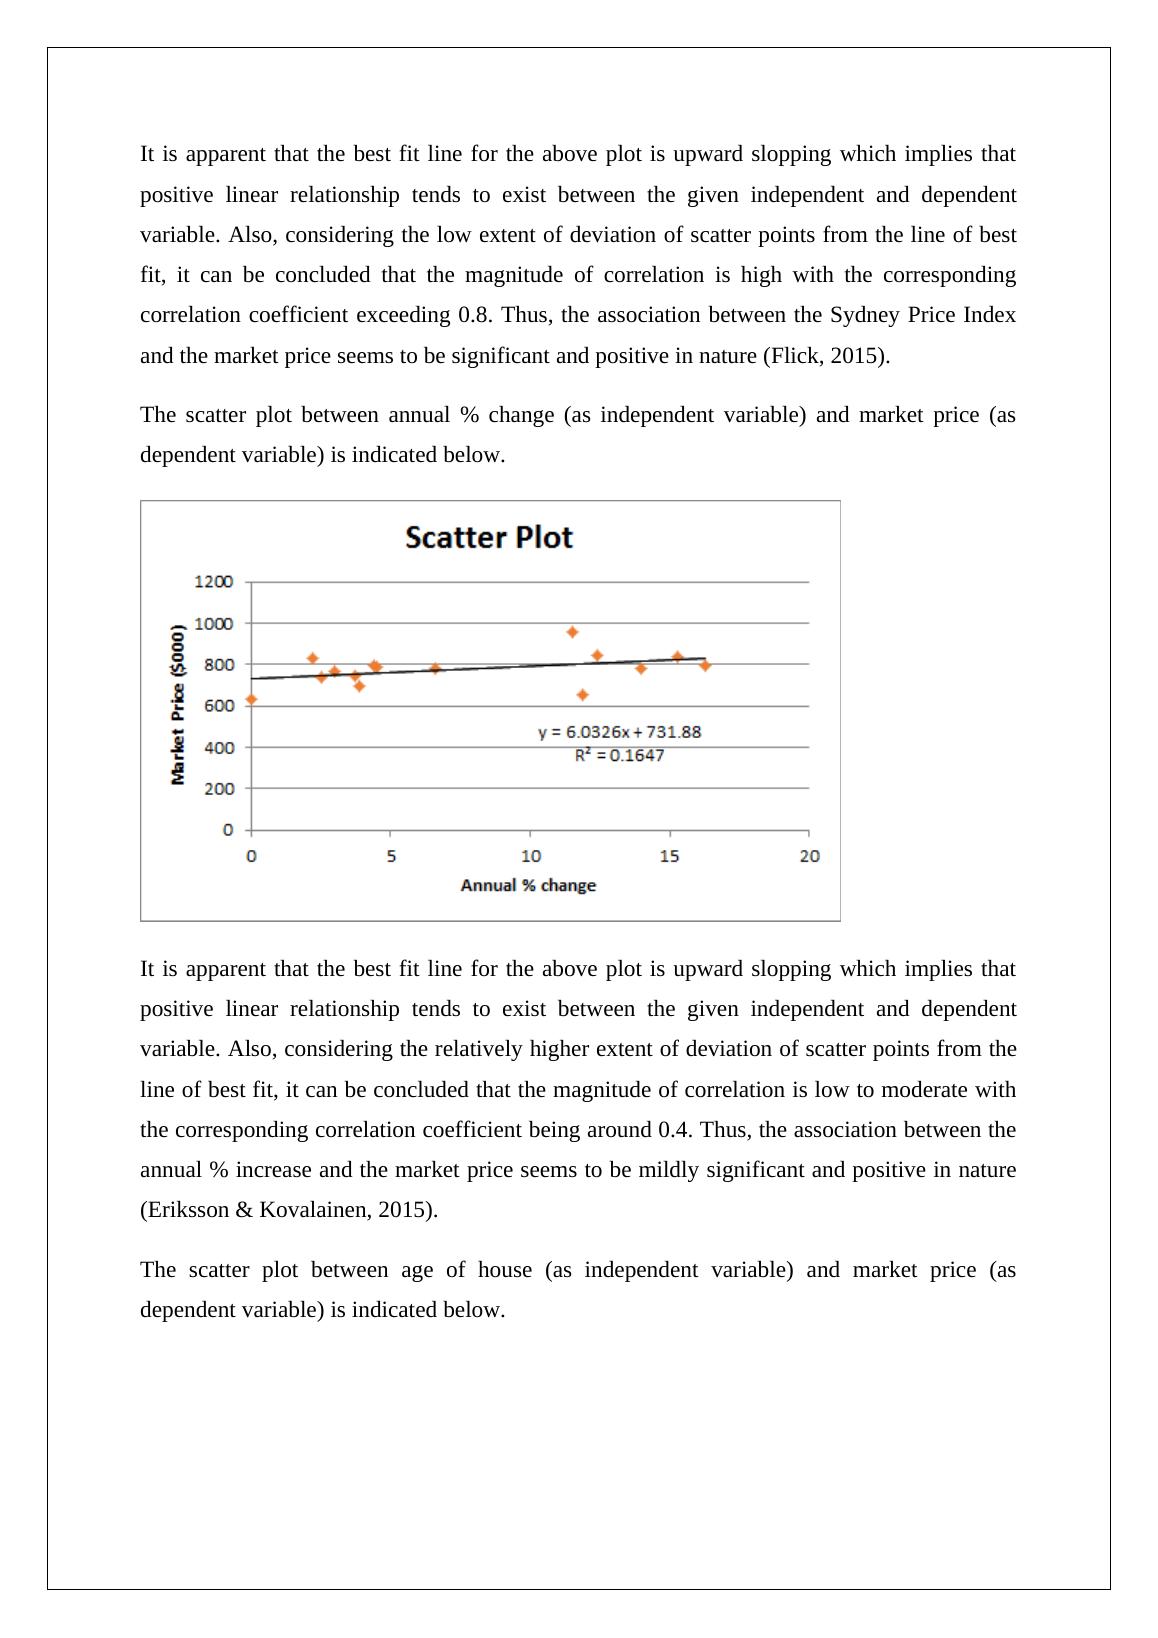
The scatter plot between annual % change (as independent variable) and market price (as
dependent variable) is indicated below.
It is apparent that the best fit line for the above plot is upward slopping which implies that
positive linear relationship tends to exist between the given independent and dependent
variable. Also, considering the relatively higher extent of deviation of scatter points from the
line of best fit, it can be concluded that the magnitude of correlation is low to moderate with
the corresponding correlation coefficient being around 0.4. Thus, the association between the
annual % increase and the market price seems to be mildly significant and positive in nature
(Eriksson & Kovalainen, 2015).
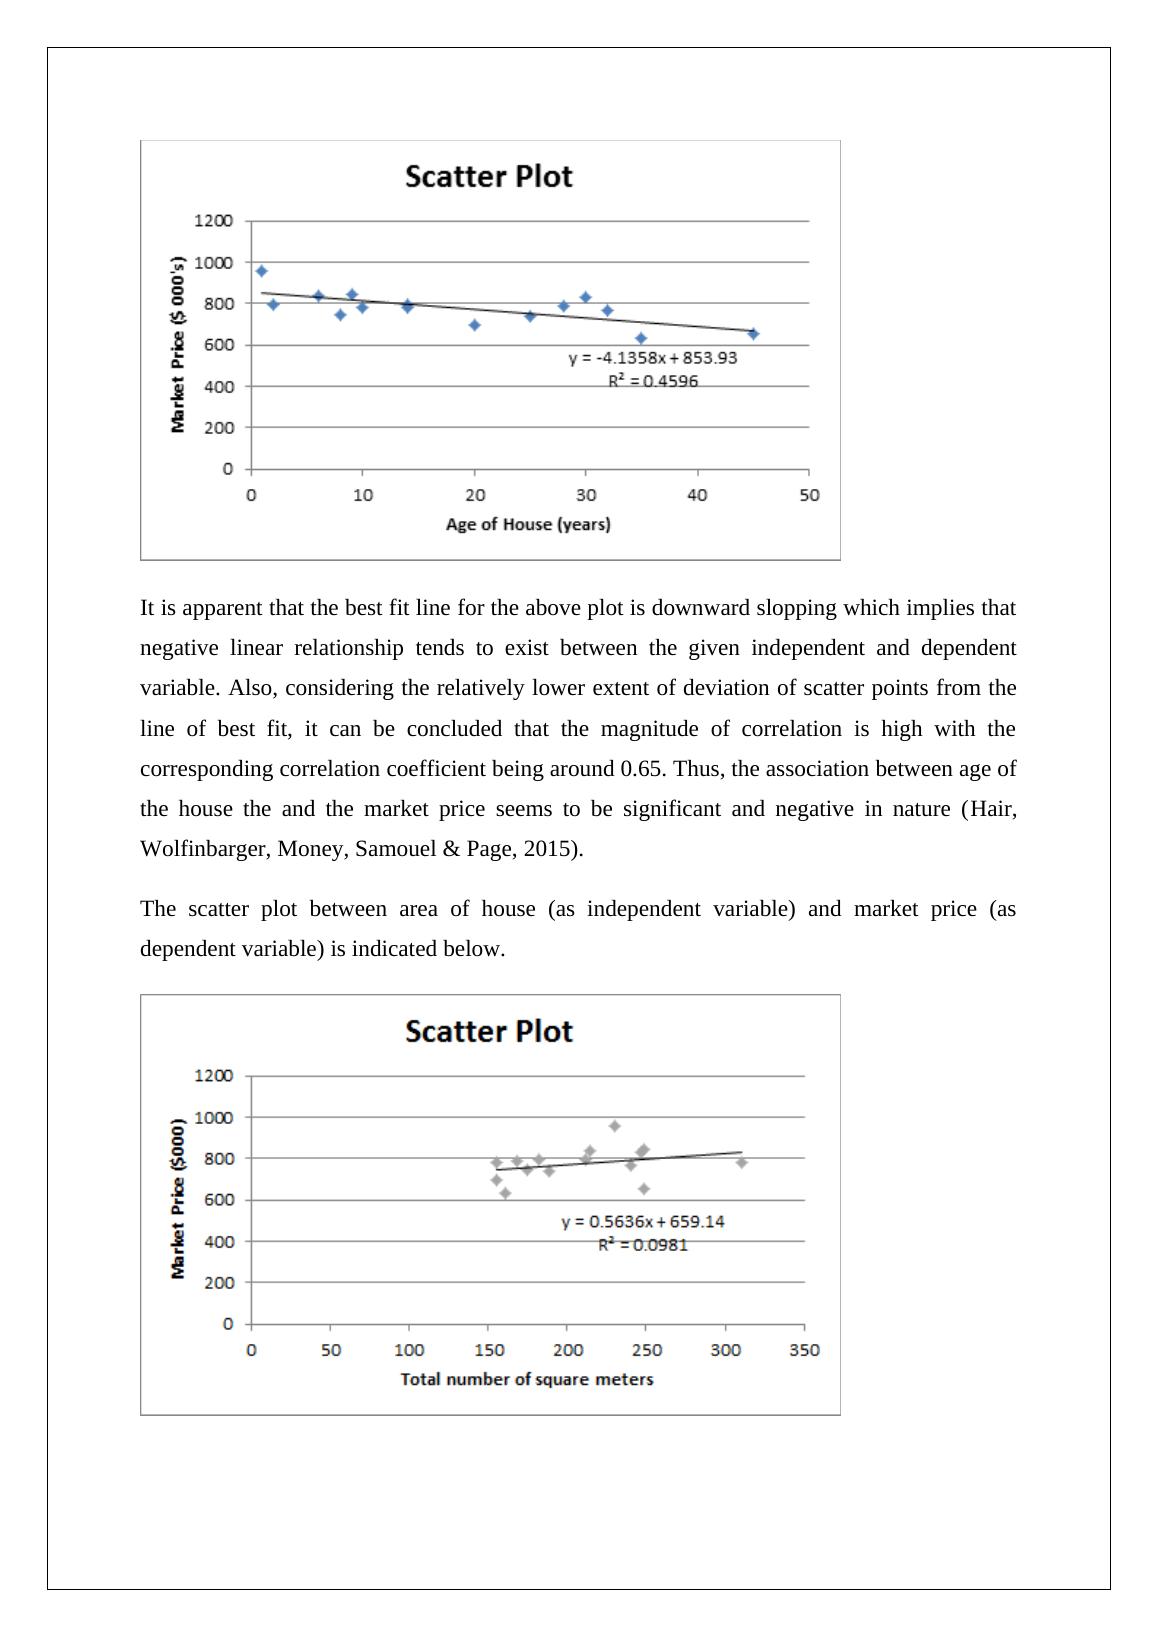
The scatter plot between age of house (as independent variable) and market price (as
dependent variable) is indicated below.
positive linear relationship tends to exist between the given independent and dependent
variable. Also, considering the low extent of deviation of scatter points from the line of best
fit, it can be concluded that the magnitude of correlation is high with the corresponding
correlation coefficient exceeding 0.8. Thus, the association between the Sydney Price Index
and the market price seems to be significant and positive in nature (Flick, 2015).
The scatter plot between annual % change (as independent variable) and market price (as
dependent variable) is indicated below.
It is apparent that the best fit line for the above plot is upward slopping which implies that
positive linear relationship tends to exist between the given independent and dependent
variable. Also, considering the relatively higher extent of deviation of scatter points from the
line of best fit, it can be concluded that the magnitude of correlation is low to moderate with
the corresponding correlation coefficient being around 0.4. Thus, the association between the
annual % increase and the market price seems to be mildly significant and positive in nature
(Eriksson & Kovalainen, 2015).
The scatter plot between age of house (as independent variable) and market price (as
dependent variable) is indicated below.
It is apparent that the best fit line for the above plot is downward slopping which implies that
negative linear relationship tends to exist between the given independent and dependent
variable. Also, considering the relatively lower extent of deviation of scatter points from the
line of best fit, it can be concluded that the magnitude of correlation is high with the
corresponding correlation coefficient being around 0.65. Thus, the association between age of
the house the and the market price seems to be significant and negative in nature (Hair,
Wolfinbarger, Money, Samouel & Page, 2015).
The scatter plot between area of house (as independent variable) and market price (as
dependent variable) is indicated below.
End of preview
Want to access all the pages? Upload your documents or become a member.
Related Documents
Regression Analysis for House Market Value Estimationlg...
|11
|2540
|427
STAT 6003- Statistics for Financial Decisionslg...
|11
|2536
|25
Financial Statisticslg...
|11
|1785
|97
Statics For Financial Decisions Report 2022lg...
|16
|2640
|21
Statistics for Financial Decisionlg...
|16
|3031
|91
Foundation Skills in Data Analysislg...
|11
|2324
|352