Predicting Water Usage: A Regression Analysis Report (2018/19)
VerifiedAdded on 2022/05/31
|13
|3377
|67
Report
AI Summary
This report presents a regression analysis of water usage data, aiming to create prediction models. The study utilizes a dataset with variables including water usage, supervisor in charge, payroll, operating days, production amount, and temperature. The methods involve multiple regression modeling and a stepwise approach to identify significant independent variables. The results section includes explanatory analysis with scatterplots and a correlation matrix, revealing relationships between variables. Multiple regression analysis is performed, and model evaluation is conducted using the R-squared value. The report also addresses model assumptions, including independence, normality, and homoskedasticity of residuals, with tests such as Shapiro-Wilk, D'Agostino, and Breusch-Pagan. Outliers are identified and addressed, and a new regression model is presented. The conclusion summarizes the findings and the model's performance.

Regression analysis
Assignment 2018/19 (Part 2)
Student Number: 17068115
Assignment 2018/19 (Part 2)
Student Number: 17068115
Paraphrase This Document
Need a fresh take? Get an instant paraphrase of this document with our AI Paraphraser
Contents
1. Introduction.......................................................................................................................................................... 3
2. Methods.................................................................................................................................................................. 3
3. Results..................................................................................................................................................................... 3
4. Model evaluation................................................................................................................................................. 6
5. Assumptions......................................................................................................................................................... 6
1. Independence of residuals...................................................................................................................... 6
2. Residuals should be normally distributed....................................................................................... 6
3. Homoskedasticity of the residuals...................................................................................................... 7
6. Conclusions......................................................................................................................................................... 10
Appendix.................................................................................................................................................................. 11
R commands....................................................................................................................................................... 11
1. Introduction
The objectives are to create prediction models for water usage using data discussed in a previous
report.
2. Methods
This research study is dedicated to the prediction of water utilization in a plant with regards to
gallons. The data employment in this report is comprised of 100 random data sample for each of
the following variables: monthly water usage, supervior in charge, person on monthly payroll,
operating days, Amount of production, and average monthly temperatures. The table illustrated
below showcases the first three random data samples for all six variables.
Table 1: Water Usage study data
Average
monthly
temperate (F)
Amount of
production (Million
pounds)
Number of plant
operating days in
the month
Number of persons
on the monthly
plant payroll
Which of three supervisors
(A, B, C) were in charge
that month
Monthly water
usage (gallons)
80.4 14948 23 187 C 3815
67.5 14643 20 190 B 2917
71.3 6579 21 153 C 2891
This report data has five independent variables (supervior in charge, person on monthly payroll,
operating days, amount of production, and average monthly temperatures) and one dependent
variables (monthly water usage). All variables are continuous in nature except for supervisor in
charge which is categorical assuming one of three values A, B or C. Multiple regression
modeling technique is employed as a feasible mean of predicting the amount of water usages
based on known values of supervior in charge, person on monthly payroll, operating days,
amount of production, and average monthly temperatures. A stepwise approach was adopt in the
determination of the most appropriate indiependent variables to employ in the regression
analysis.
3. Results
Explanatory Analysis
We start by examining the data by drawing a scatter plots of “Water usage” against the four
explanatory variables.
⊘ This is a preview!⊘
Do you want full access?
Subscribe today to unlock all pages.
Trusted by 1+ million students worldwide
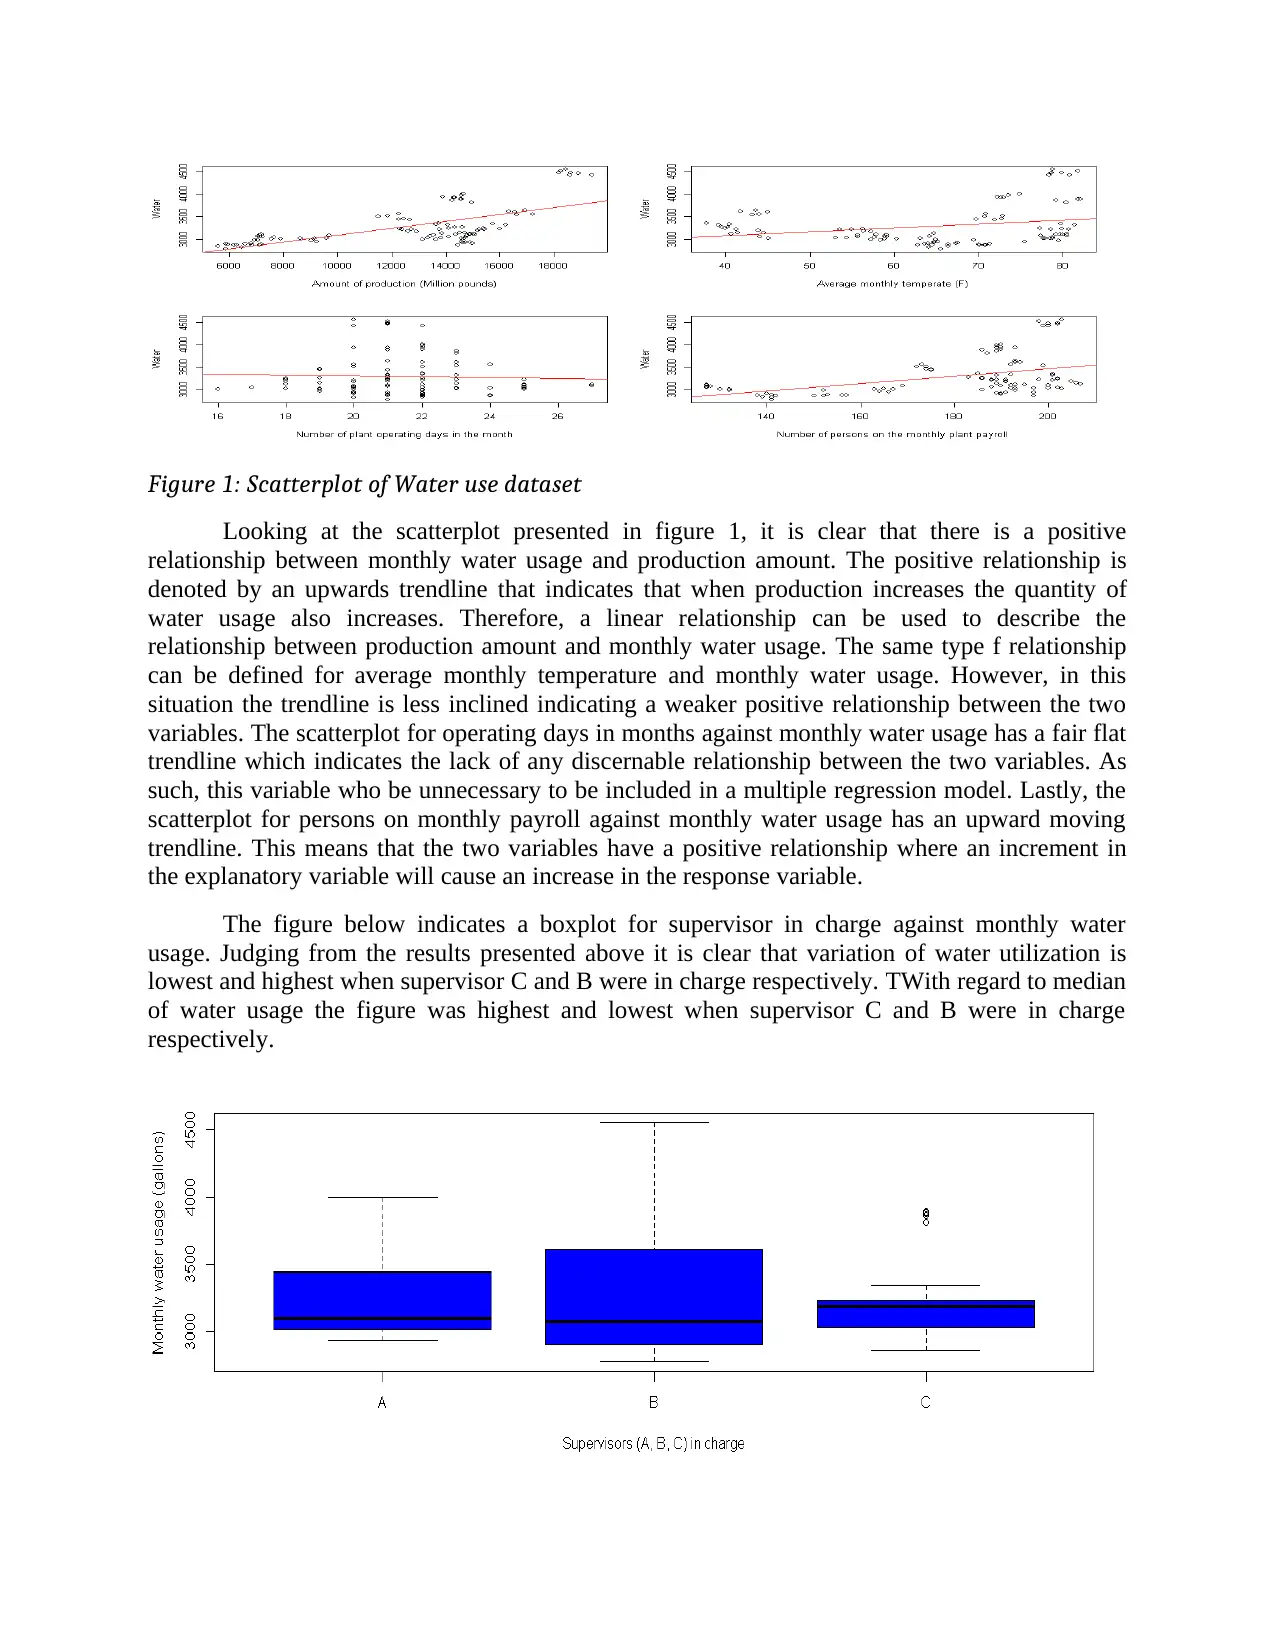
Figure 1: Scatterplot of Water use dataset
Looking at the scatterplot presented in figure 1, it is clear that there is a positive
relationship between monthly water usage and production amount. The positive relationship is
denoted by an upwards trendline that indicates that when production increases the quantity of
water usage also increases. Therefore, a linear relationship can be used to describe the
relationship between production amount and monthly water usage. The same type f relationship
can be defined for average monthly temperature and monthly water usage. However, in this
situation the trendline is less inclined indicating a weaker positive relationship between the two
variables. The scatterplot for operating days in months against monthly water usage has a fair flat
trendline which indicates the lack of any discernable relationship between the two variables. As
such, this variable who be unnecessary to be included in a multiple regression model. Lastly, the
scatterplot for persons on monthly payroll against monthly water usage has an upward moving
trendline. This means that the two variables have a positive relationship where an increment in
the explanatory variable will cause an increase in the response variable.
The figure below indicates a boxplot for supervisor in charge against monthly water
usage. Judging from the results presented above it is clear that variation of water utilization is
lowest and highest when supervisor C and B were in charge respectively. TWith regard to median
of water usage the figure was highest and lowest when supervisor C and B were in charge
respectively.
Paraphrase This Document
Need a fresh take? Get an instant paraphrase of this document with our AI Paraphraser
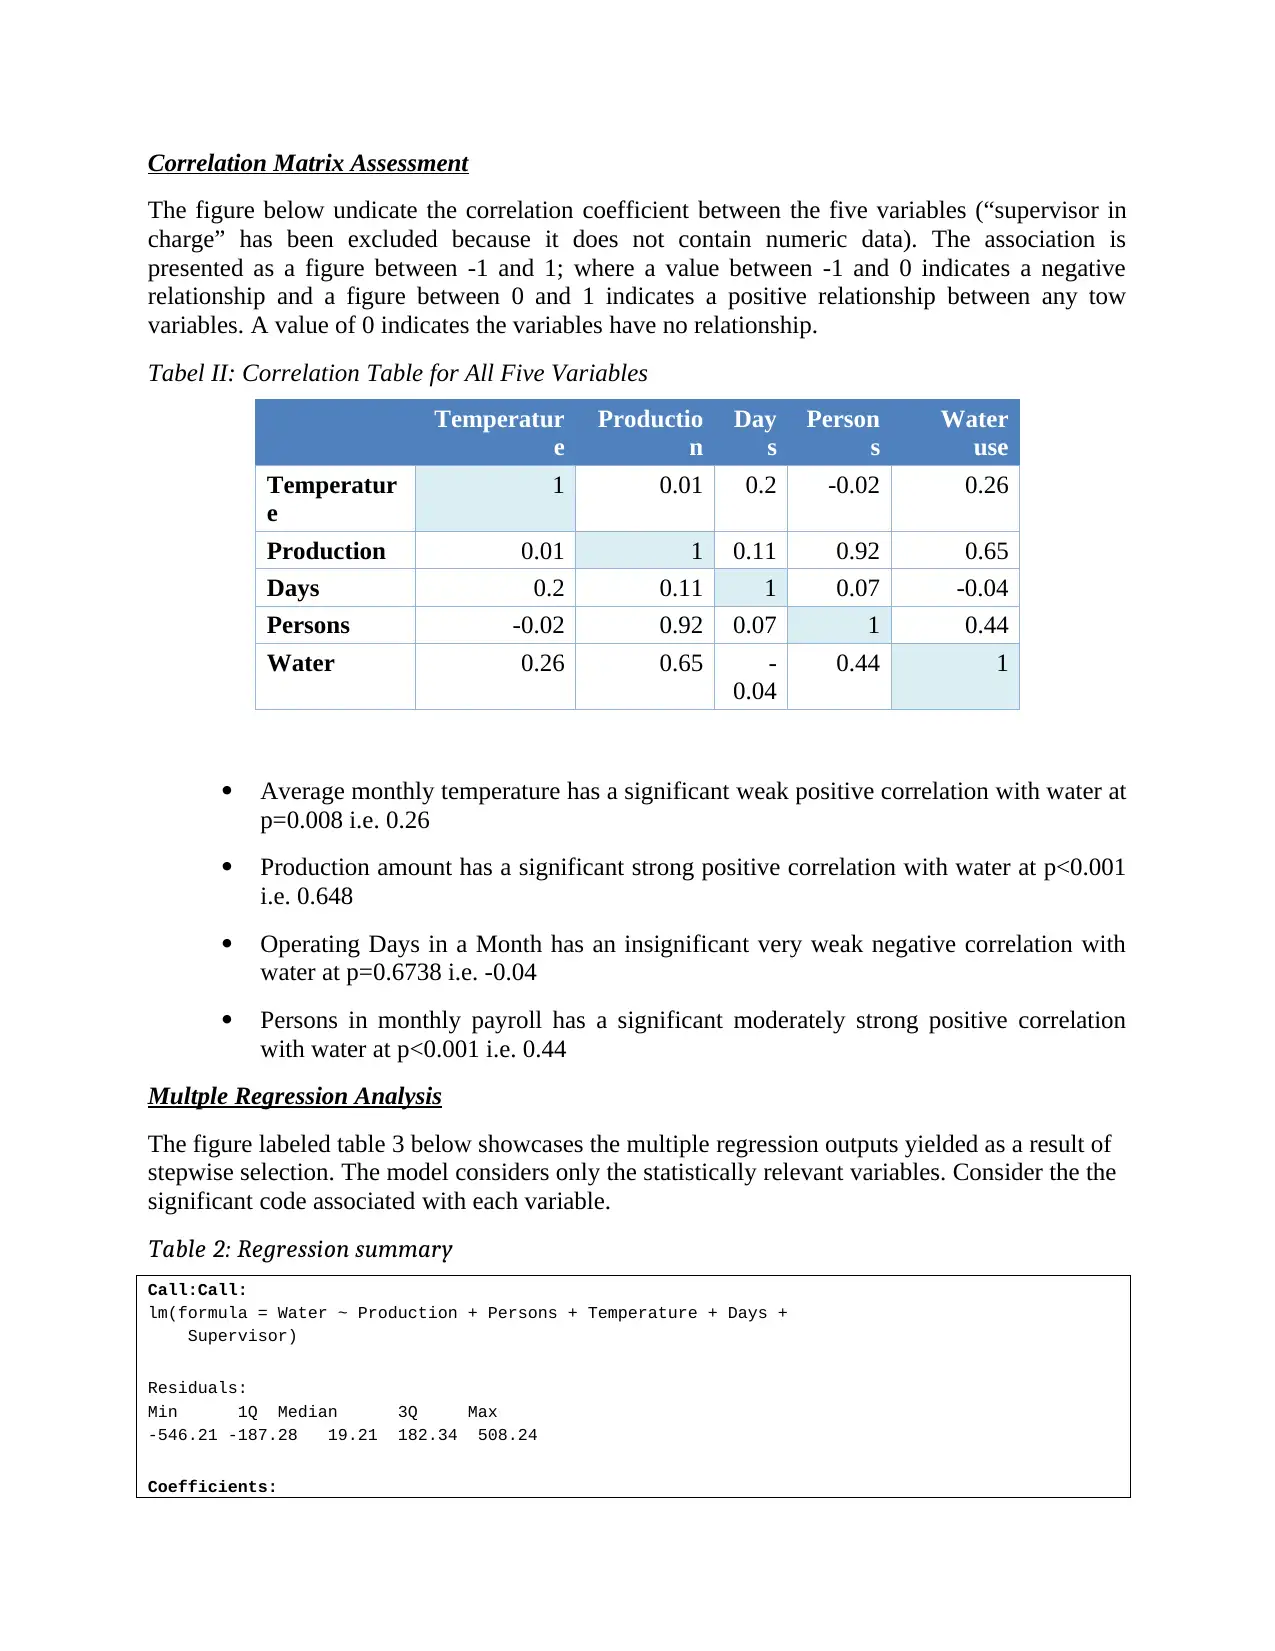
Correlation Matrix Assessment
The figure below undicate the correlation coefficient between the five variables (“supervisor in
charge” has been excluded because it does not contain numeric data). The association is
presented as a figure between -1 and 1; where a value between -1 and 0 indicates a negative
relationship and a figure between 0 and 1 indicates a positive relationship between any tow
variables. A value of 0 indicates the variables have no relationship.
Tabel II: Correlation Table for All Five Variables
Temperatur
e
Productio
n
Day
s
Person
s
Water
use
Temperatur
e
1 0.01 0.2 -0.02 0.26
Production 0.01 1 0.11 0.92 0.65
Days 0.2 0.11 1 0.07 -0.04
Persons -0.02 0.92 0.07 1 0.44
Water 0.26 0.65 -
0.04
0.44 1
Average monthly temperature has a significant weak positive correlation with water at
p=0.008 i.e. 0.26
Production amount has a significant strong positive correlation with water at p<0.001
i.e. 0.648
Operating Days in a Month has an insignificant very weak negative correlation with
water at p=0.6738 i.e. -0.04
Persons in monthly payroll has a significant moderately strong positive correlation
with water at p<0.001 i.e. 0.44
Multple Regression Analysis
The figure labeled table 3 below showcases the multiple regression outputs yielded as a result of
stepwise selection. The model considers only the statistically relevant variables. Consider the the
significant code associated with each variable.
Table 2: Regression summary
Call:Call:
lm(formula = Water ~ Production + Persons + Temperature + Days +
Supervisor)
Residuals:
Min 1Q Median 3Q Max
-546.21 -187.28 19.21 182.34 508.24
Coefficients:
Estimate Std. Error t value Pr(>|t|)
(Intercept) 4459.9769 452.9348 9.847 0.000000000000000431 ***
Production 0.1974 0.0197 10.018 < 0.0000000000000002 ***
Persons -19.2486 3.1099 -6.189 0.000000016119238048 ***
Temperature 9.0060 1.9966 4.511 0.000018844608761750 ***
Days -34.6017 13.8166 -2.504 0.0140 *
SupervisorB -157.4748 67.6991 -2.326 0.0222 *
SupervisorC -5.3211 73.2256 -0.073 0.9422
---
Signif. codes: 0 ‘***’ 0.001 ‘**’ 0.01 ‘*’ 0.05 ‘.’ 0.1 ‘ ’ 1
Residual standard error: 258.6 on 93 degrees of freedom
Multiple R-squared: 0.6791, Adjusted R-squared: 0.6584
F-statistic: 32.8 on 6 and 93 DF, p-value: < 0.00000000000000022
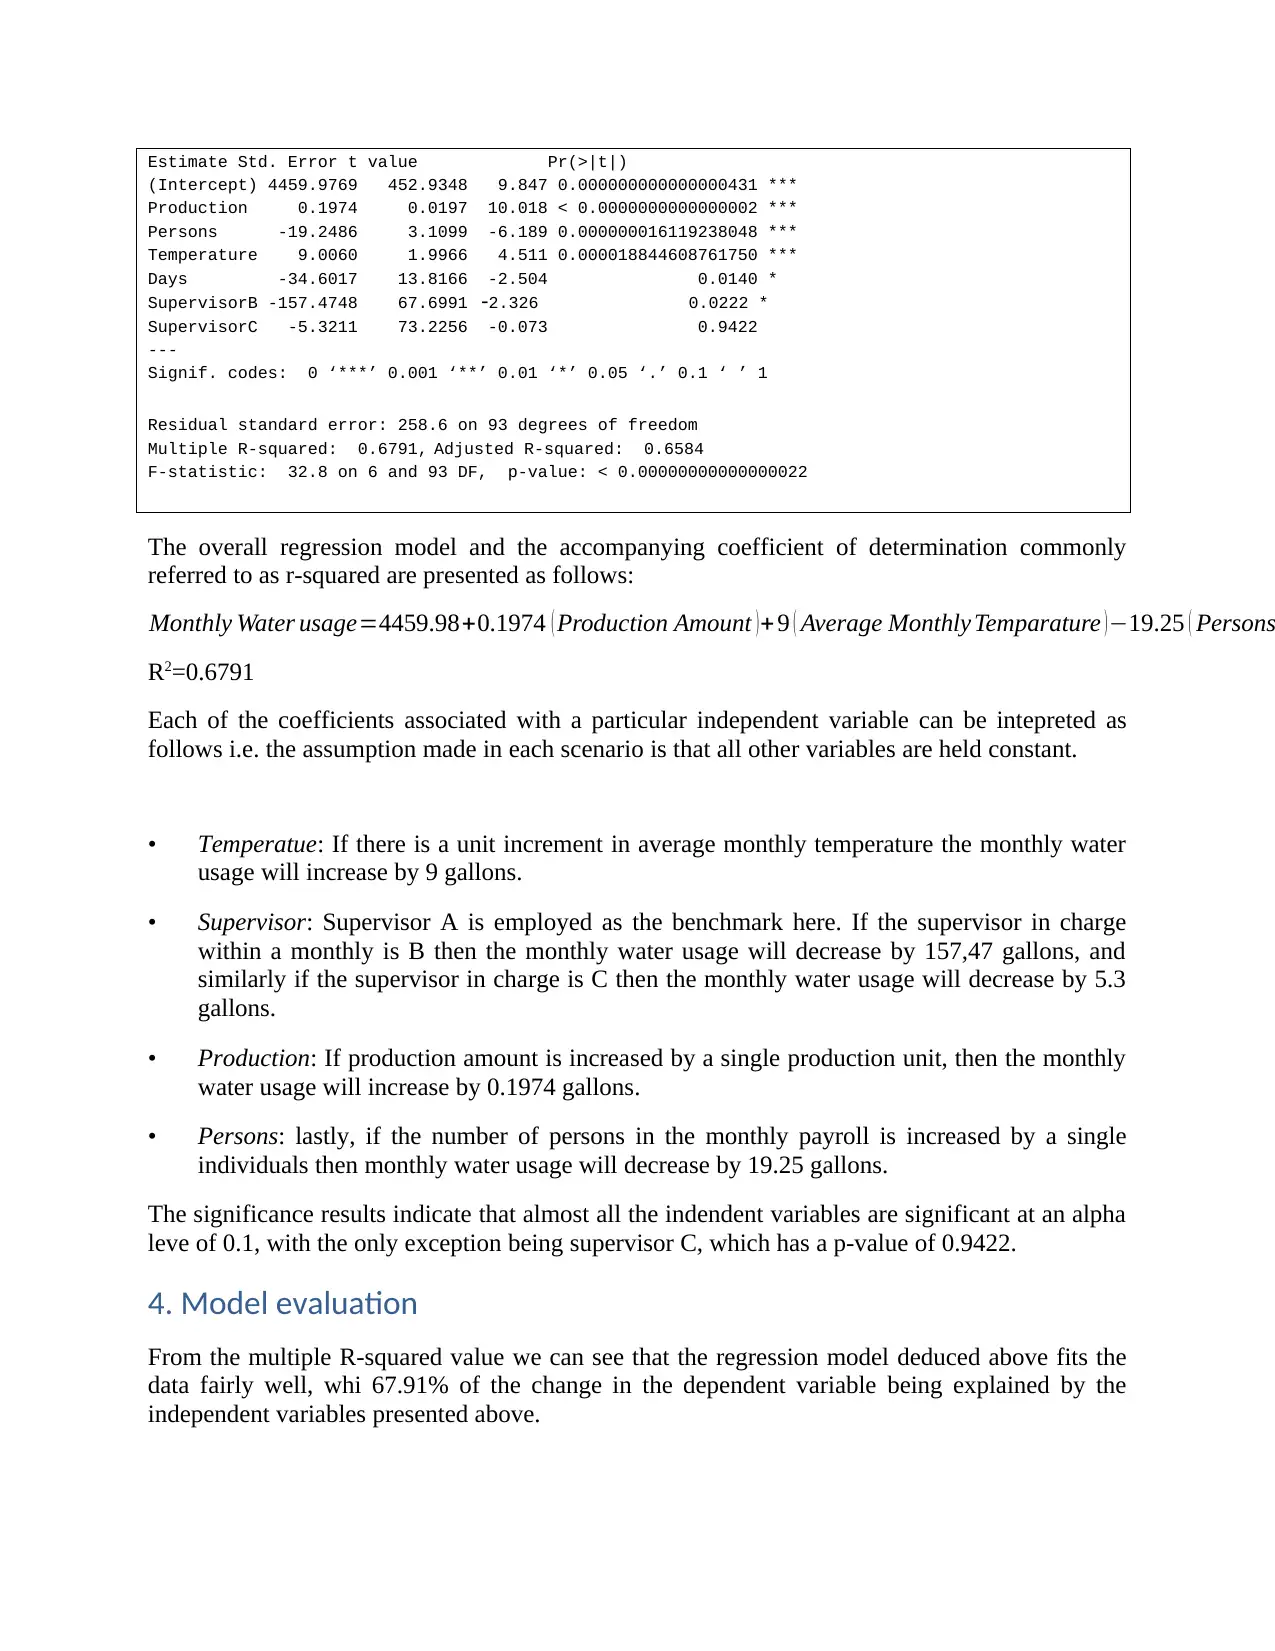
The overall regression model and the accompanying coefficient of determination commonly
referred to as r-squared are presented as follows:
Monthly Water usage=4459.98+0.1974 ( Production Amount ) +9 ( Average Monthly Temparature ) −19.25 ( Persons
R2=0.6791
Each of the coefficients associated with a particular independent variable can be intepreted as
follows i.e. the assumption made in each scenario is that all other variables are held constant.
• Temperatue: If there is a unit increment in average monthly temperature the monthly water
usage will increase by 9 gallons.
• Supervisor: Supervisor A is employed as the benchmark here. If the supervisor in charge
within a monthly is B then the monthly water usage will decrease by 157,47 gallons, and
similarly if the supervisor in charge is C then the monthly water usage will decrease by 5.3
gallons.
• Production: If production amount is increased by a single production unit, then the monthly
water usage will increase by 0.1974 gallons.
• Persons: lastly, if the number of persons in the monthly payroll is increased by a single
individuals then monthly water usage will decrease by 19.25 gallons.
The significance results indicate that almost all the indendent variables are significant at an alpha
leve of 0.1, with the only exception being supervisor C, which has a p-value of 0.9422.
4. Model evaluation
From the multiple R-squared value we can see that the regression model deduced above fits the
data fairly well, whi 67.91% of the change in the dependent variable being explained by the
independent variables presented above.
(Intercept) 4459.9769 452.9348 9.847 0.000000000000000431 ***
Production 0.1974 0.0197 10.018 < 0.0000000000000002 ***
Persons -19.2486 3.1099 -6.189 0.000000016119238048 ***
Temperature 9.0060 1.9966 4.511 0.000018844608761750 ***
Days -34.6017 13.8166 -2.504 0.0140 *
SupervisorB -157.4748 67.6991 -2.326 0.0222 *
SupervisorC -5.3211 73.2256 -0.073 0.9422
---
Signif. codes: 0 ‘***’ 0.001 ‘**’ 0.01 ‘*’ 0.05 ‘.’ 0.1 ‘ ’ 1
Residual standard error: 258.6 on 93 degrees of freedom
Multiple R-squared: 0.6791, Adjusted R-squared: 0.6584
F-statistic: 32.8 on 6 and 93 DF, p-value: < 0.00000000000000022
The overall regression model and the accompanying coefficient of determination commonly
referred to as r-squared are presented as follows:
Monthly Water usage=4459.98+0.1974 ( Production Amount ) +9 ( Average Monthly Temparature ) −19.25 ( Persons
R2=0.6791
Each of the coefficients associated with a particular independent variable can be intepreted as
follows i.e. the assumption made in each scenario is that all other variables are held constant.
• Temperatue: If there is a unit increment in average monthly temperature the monthly water
usage will increase by 9 gallons.
• Supervisor: Supervisor A is employed as the benchmark here. If the supervisor in charge
within a monthly is B then the monthly water usage will decrease by 157,47 gallons, and
similarly if the supervisor in charge is C then the monthly water usage will decrease by 5.3
gallons.
• Production: If production amount is increased by a single production unit, then the monthly
water usage will increase by 0.1974 gallons.
• Persons: lastly, if the number of persons in the monthly payroll is increased by a single
individuals then monthly water usage will decrease by 19.25 gallons.
The significance results indicate that almost all the indendent variables are significant at an alpha
leve of 0.1, with the only exception being supervisor C, which has a p-value of 0.9422.
4. Model evaluation
From the multiple R-squared value we can see that the regression model deduced above fits the
data fairly well, whi 67.91% of the change in the dependent variable being explained by the
independent variables presented above.
⊘ This is a preview!⊘
Do you want full access?
Subscribe today to unlock all pages.
Trusted by 1+ million students worldwide
5. Assumptions
In order to build a stable model, the assumptions of multiple regression are verified. We recall
that for the hypothesis tests from the ANOVA or t-tests of coefficients in regression, we are
assuming that the errors/residuals are Normally distributed with constant variance and that they
are independent of each other. We are also assuming that a linear relationship potentially exists.
1. Independence of residuals
Given that our data sample is retrieve and compiled using a randomized technique; it is therefore
correct to assume that the residuals and observation are independents.
2. Residuals should be normally distributed
The assumption of normality in the residuals is crucial in the regression analysis, since the
estimated individual coefficients rely on parametric statistics (t-statistics and F-statistics). To
check for normality, Shapiro-Wilk normality test, D’Agostino skewness test and Jarque Bera
omnibus testand normal Q-Q plot of the residuals are used. After performing these three
tests (Table 1, 2 and 3, respectively), the test results have a larger p-value than 0.05, which means
that there is no evidence to reject the null hypothesis that the errors are likely to be distributed
normally. Hence, the assumption of normality of the errors holds.
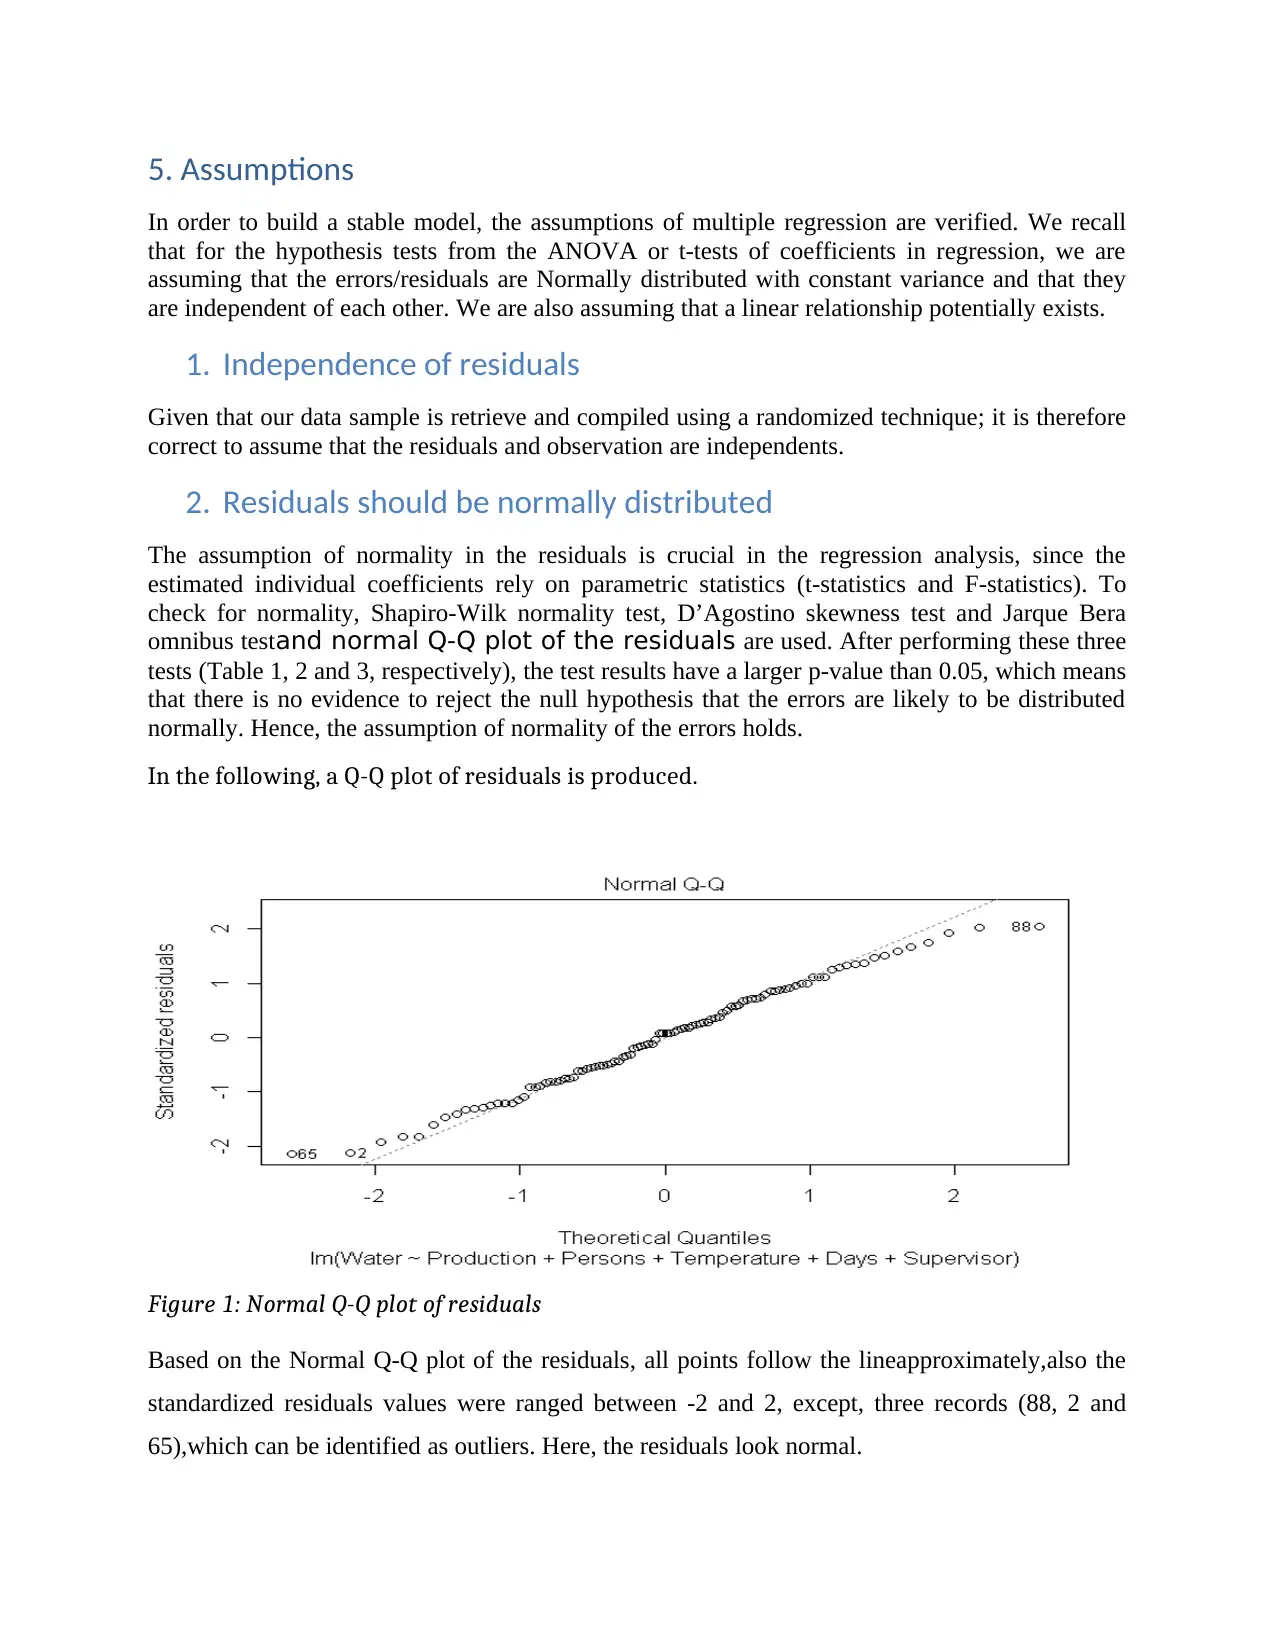
In the following, a Q-Q plot of residuals is produced.
Figure 1: Normal Q-Q plot of residuals
Based on the Normal Q-Q plot of the residuals, all points follow the lineapproximately,also the
standardized residuals values were ranged between -2 and 2, except, three records (88, 2 and
65),which can be identified as outliers. Here, the residuals look normal.
In order to build a stable model, the assumptions of multiple regression are verified. We recall
that for the hypothesis tests from the ANOVA or t-tests of coefficients in regression, we are
assuming that the errors/residuals are Normally distributed with constant variance and that they
are independent of each other. We are also assuming that a linear relationship potentially exists.
1. Independence of residuals
Given that our data sample is retrieve and compiled using a randomized technique; it is therefore
correct to assume that the residuals and observation are independents.
2. Residuals should be normally distributed
The assumption of normality in the residuals is crucial in the regression analysis, since the
estimated individual coefficients rely on parametric statistics (t-statistics and F-statistics). To
check for normality, Shapiro-Wilk normality test, D’Agostino skewness test and Jarque Bera
omnibus testand normal Q-Q plot of the residuals are used. After performing these three
tests (Table 1, 2 and 3, respectively), the test results have a larger p-value than 0.05, which means
that there is no evidence to reject the null hypothesis that the errors are likely to be distributed
normally. Hence, the assumption of normality of the errors holds.
In the following, a Q-Q plot of residuals is produced.
Figure 1: Normal Q-Q plot of residuals
Based on the Normal Q-Q plot of the residuals, all points follow the lineapproximately,also the
standardized residuals values were ranged between -2 and 2, except, three records (88, 2 and
65),which can be identified as outliers. Here, the residuals look normal.
Paraphrase This Document
Need a fresh take? Get an instant paraphrase of this document with our AI Paraphraser
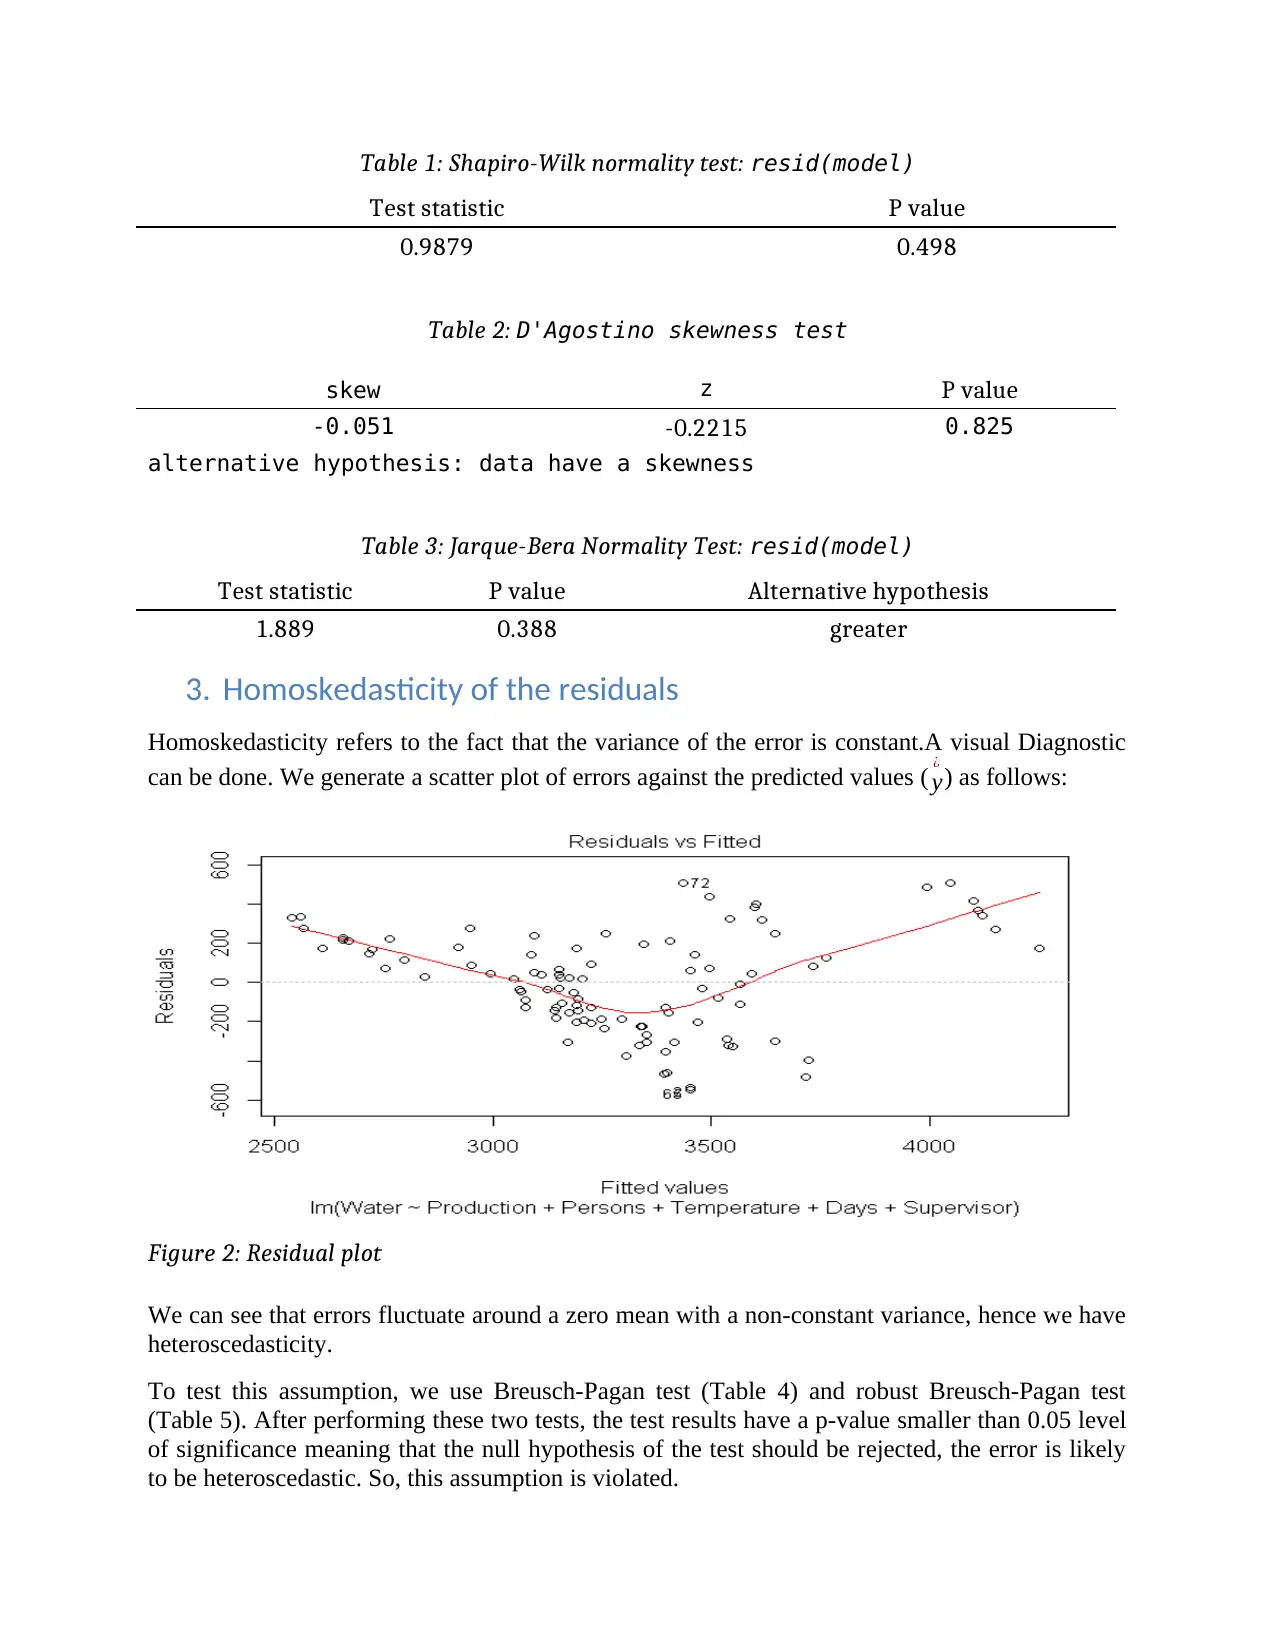
Table 1: Shapiro-Wilk normality test: resid(model)
Test statistic P value
0.9879 0.498
Table 2: D'Agostino skewness test
skew z P value
-0.051 -0.2215 0.825
alternative hypothesis: data have a skewness
Table 3: Jarque-Bera Normality Test: resid(model)
Test statistic P value Alternative hypothesis
1.889 0.388 greater
3. Homoskedasticity of the residuals
Homoskedasticity refers to the fact that the variance of the error is constant.A visual Diagnostic
can be done. We generate a scatter plot of errors against the predicted values ( y
¿
) as follows:
Figure 2: Residual plot
We can see that errors fluctuate around a zero mean with a non-constant variance, hence we have
heteroscedasticity.
To test this assumption, we use Breusch-Pagan test (Table 4) and robust Breusch-Pagan test
(Table 5). After performing these two tests, the test results have a p-value smaller than 0.05 level
of significance meaning that the null hypothesis of the test should be rejected, the error is likely
to be heteroscedastic. So, this assumption is violated.
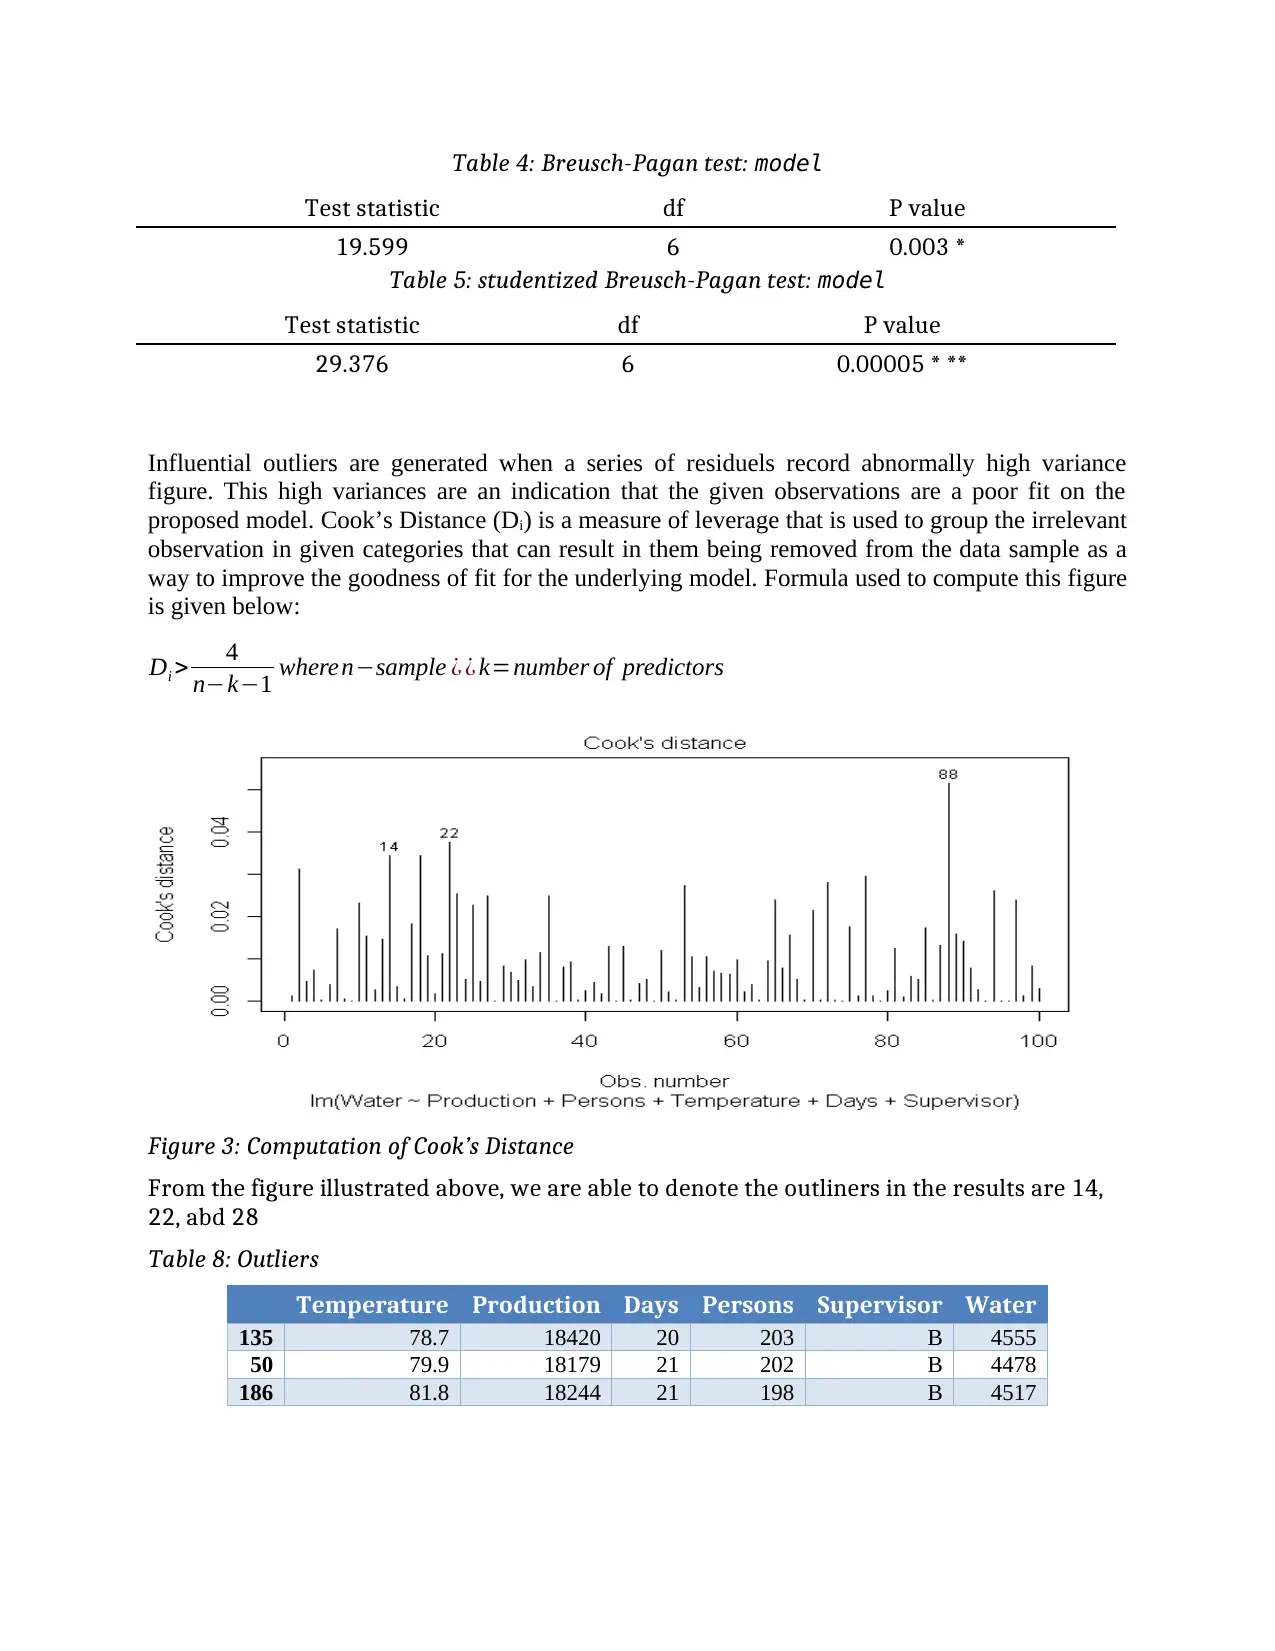
Table 4: Breusch-Pagan test: model
Test statistic df P value
19.599 6 0.003 *
Table 5: studentized Breusch-Pagan test: model
Test statistic df P value
29.376 6 0.00005 * **
Influential outliers are generated when a series of residuels record abnormally high variance
figure. This high variances are an indication that the given observations are a poor fit on the
proposed model. Cook’s Distance (Di) is a measure of leverage that is used to group the irrelevant
observation in given categories that can result in them being removed from the data sample as a
way to improve the goodness of fit for the underlying model. Formula used to compute this figure
is given below:
Di > 4
n−k−1 wheren−sample ¿ ¿ k=number of predictors
Figure 3: Computation of Cook’s Distance
From the figure illustrated above, we are able to denote the outliners in the results are 14,
22, abd 28
Table 8: Outliers
Temperature Production Days Persons Supervisor Water
135 78.7 18420 20 203 B 4555
50 79.9 18179 21 202 B 4478
186 81.8 18244 21 198 B 4517
Test statistic df P value
19.599 6 0.003 *
Table 5: studentized Breusch-Pagan test: model
Test statistic df P value
29.376 6 0.00005 * **
Influential outliers are generated when a series of residuels record abnormally high variance
figure. This high variances are an indication that the given observations are a poor fit on the
proposed model. Cook’s Distance (Di) is a measure of leverage that is used to group the irrelevant
observation in given categories that can result in them being removed from the data sample as a
way to improve the goodness of fit for the underlying model. Formula used to compute this figure
is given below:
Di > 4
n−k−1 wheren−sample ¿ ¿ k=number of predictors
Figure 3: Computation of Cook’s Distance
From the figure illustrated above, we are able to denote the outliners in the results are 14,
22, abd 28
Table 8: Outliers
Temperature Production Days Persons Supervisor Water
135 78.7 18420 20 203 B 4555
50 79.9 18179 21 202 B 4478
186 81.8 18244 21 198 B 4517
⊘ This is a preview!⊘
Do you want full access?
Subscribe today to unlock all pages.
Trusted by 1+ million students worldwide
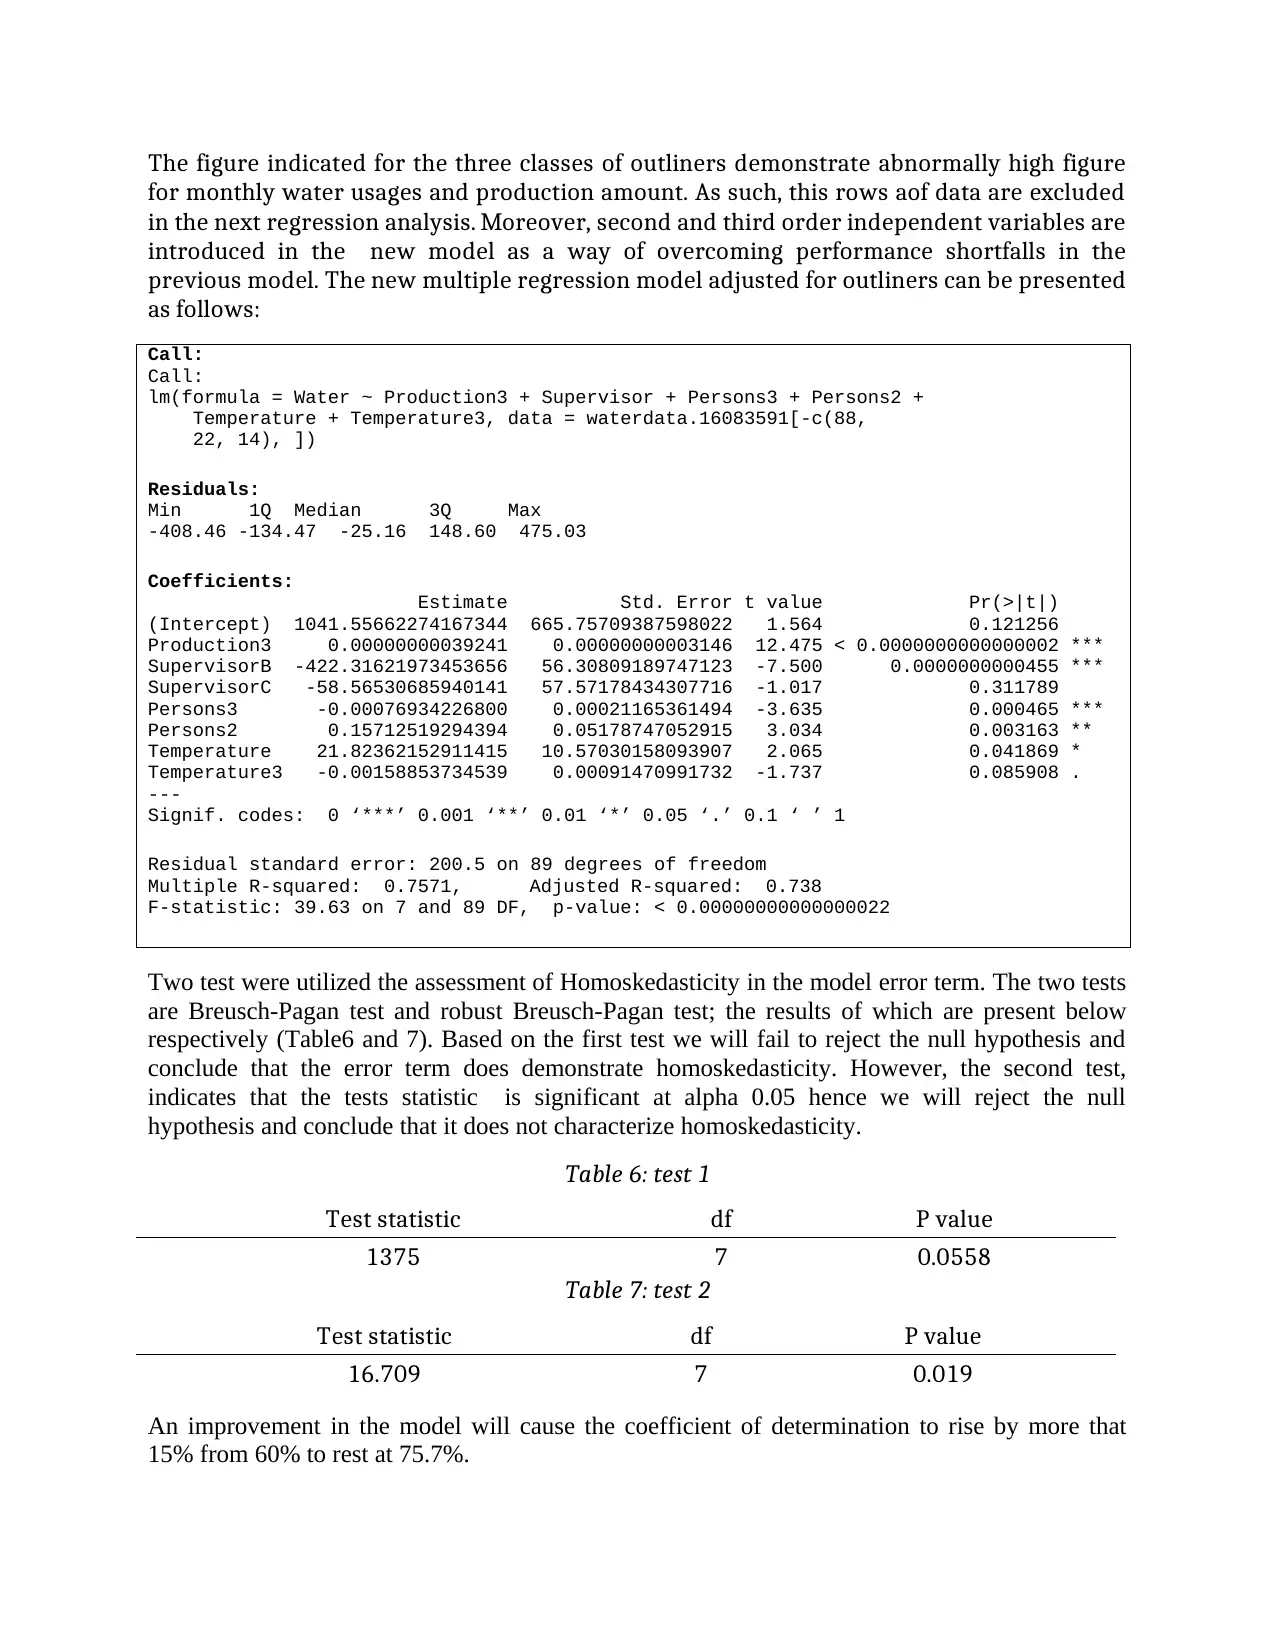
The figure indicated for the three classes of outliners demonstrate abnormally high figure
for monthly water usages and production amount. As such, this rows aof data are excluded
in the next regression analysis. Moreover, second and third order independent variables are
introduced in the new model as a way of overcoming performance shortfalls in the
previous model. The new multiple regression model adjusted for outliners can be presented
as follows:
Call:
Call:
lm(formula = Water ~ Production3 + Supervisor + Persons3 + Persons2 +
Temperature + Temperature3, data = waterdata.16083591[-c(88,
22, 14), ])
Residuals:
Min 1Q Median 3Q Max
-408.46 -134.47 -25.16 148.60 475.03
Coefficients:
Estimate Std. Error t value Pr(>|t|)
(Intercept) 1041.55662274167344 665.75709387598022 1.564 0.121256
Production3 0.00000000039241 0.00000000003146 12.475 < 0.0000000000000002 ***
SupervisorB -422.31621973453656 56.30809189747123 -7.500 0.0000000000455 ***
SupervisorC -58.56530685940141 57.57178434307716 -1.017 0.311789
Persons3 -0.00076934226800 0.00021165361494 -3.635 0.000465 ***
Persons2 0.15712519294394 0.05178747052915 3.034 0.003163 **
Temperature 21.82362152911415 10.57030158093907 2.065 0.041869 *
Temperature3 -0.00158853734539 0.00091470991732 -1.737 0.085908 .
---
Signif. codes: 0 ‘***’ 0.001 ‘**’ 0.01 ‘*’ 0.05 ‘.’ 0.1 ‘ ’ 1
Residual standard error: 200.5 on 89 degrees of freedom
Multiple R-squared: 0.7571, Adjusted R-squared: 0.738
F-statistic: 39.63 on 7 and 89 DF, p-value: < 0.00000000000000022
Two test were utilized the assessment of Homoskedasticity in the model error term. The two tests
are Breusch-Pagan test and robust Breusch-Pagan test; the results of which are present below
respectively (Table6 and 7). Based on the first test we will fail to reject the null hypothesis and
conclude that the error term does demonstrate homoskedasticity. However, the second test,
indicates that the tests statistic is significant at alpha 0.05 hence we will reject the null
hypothesis and conclude that it does not characterize homoskedasticity.
Table 6: test 1
Test statistic df P value
1375 7 0.0558
Table 7: test 2
Test statistic df P value
16.709 7 0.019
An improvement in the model will cause the coefficient of determination to rise by more that
15% from 60% to rest at 75.7%.
Paraphrase This Document
Need a fresh take? Get an instant paraphrase of this document with our AI Paraphraser
6. Conclusions
Multiple linear regression was employed as the technique of choice in the development of a
model that could be used to predict the monthly water usage (dependent variables) based on five
independent variables (supervior in charge, person on monthly payroll, operating days, amount of
production, and average monthly temperatures). The underlying assumption in the assessment is
that the dependent vaiable has a positive or negative linear relationship with each of the five
independent variables. From the results, it is clear that majority of the variables decrease monthly
water usage with every unit increment. The general assumptions made for the error terms are:
they are normally distributed, outliers can be identified and filtered from the data, and lastly, they
has constant variance or they observe homoskedasticity. With adjustment to the data for model
improvement purposes we observed that the adjusted R-squared increased to 75.7%; this means
that a large percentage of the change in monthly water usage can be readily explained by the
changes in supervior in charge, person on monthly payroll, amount of production, and average
monthly temperatures.
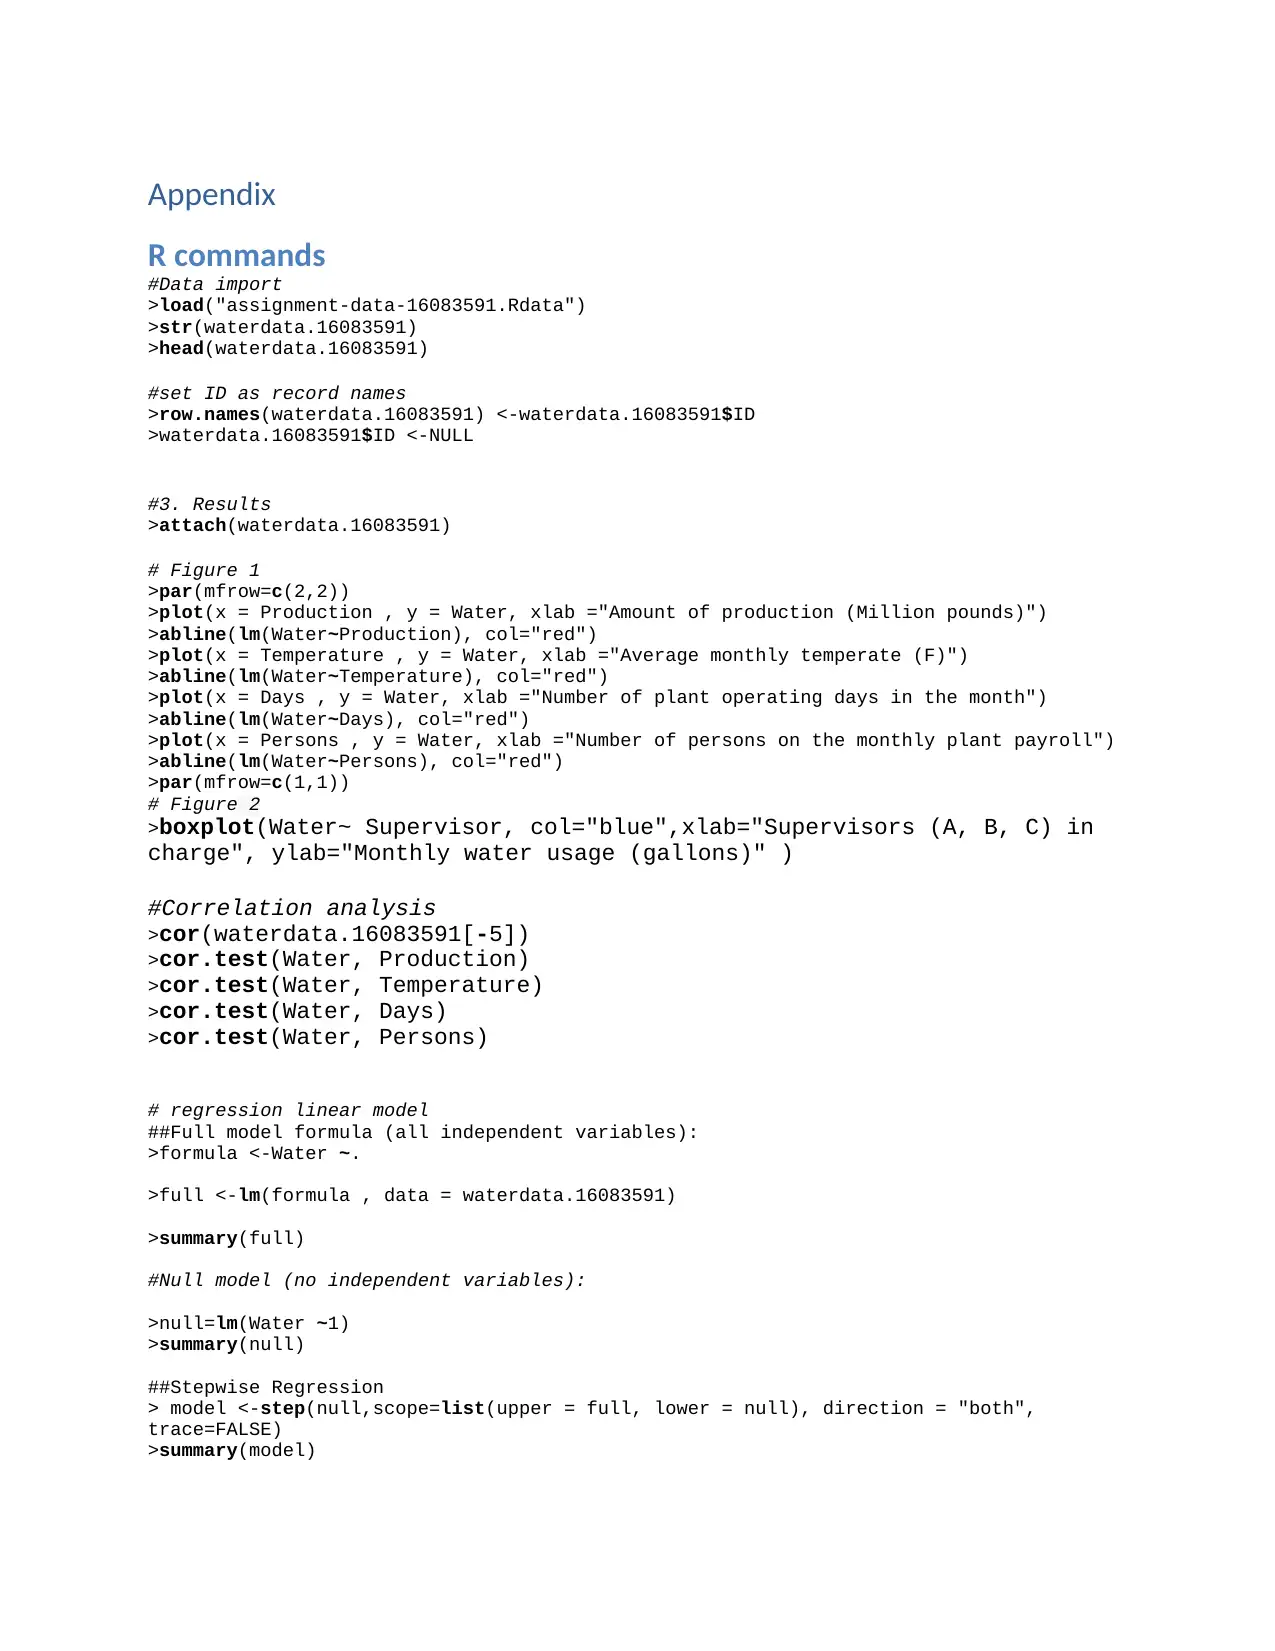
Appendix
R commands
#Data import
>load("assignment-data-16083591.Rdata")
>str(waterdata.16083591)
>head(waterdata.16083591)
#set ID as record names
>row.names(waterdata.16083591) <-waterdata.16083591$ID
>waterdata.16083591$ID <-NULL
#3. Results
>attach(waterdata.16083591)
# Figure 1
>par(mfrow=c(2,2))
>plot(x = Production , y = Water, xlab ="Amount of production (Million pounds)")
>abline(lm(Water~Production), col="red")
>plot(x = Temperature , y = Water, xlab ="Average monthly temperate (F)")
>abline(lm(Water~Temperature), col="red")
>plot(x = Days , y = Water, xlab ="Number of plant operating days in the month")
>abline(lm(Water~Days), col="red")
>plot(x = Persons , y = Water, xlab ="Number of persons on the monthly plant payroll")
>abline(lm(Water~Persons), col="red")
>par(mfrow=c(1,1))
# Figure 2
>boxplot(Water~ Supervisor, col="blue",xlab="Supervisors (A, B, C) in
charge", ylab="Monthly water usage (gallons)" )
#Correlation analysis
>cor(waterdata.16083591[-5])
>cor.test(Water, Production)
>cor.test(Water, Temperature)
>cor.test(Water, Days)
>cor.test(Water, Persons)
# regression linear model
##Full model formula (all independent variables):
>formula <-Water ~.
>full <-lm(formula , data = waterdata.16083591)
>summary(full)
#Null model (no independent variables):
>null=lm(Water ~1)
>summary(null)
##Stepwise Regression
> model <-step(null,scope=list(upper = full, lower = null), direction = "both",
trace=FALSE)
>summary(model)
⊘ This is a preview!⊘
Do you want full access?
Subscribe today to unlock all pages.
Trusted by 1+ million students worldwide
1 out of 13


Your All-in-One AI-Powered Toolkit for Academic Success.
+13062052269
info@desklib.com
Available 24*7 on WhatsApp / Email
![[object Object]](/_next/static/media/star-bottom.7253800d.svg)
Unlock your academic potential
Copyright © 2020–2025 A2Z Services. All Rights Reserved. Developed and managed by ZUCOL.