Regression Models: Analyzing Car Sale Prices Using Regression Analysis
VerifiedAdded on 2023/06/07
|11
|1789
|244
Report
AI Summary
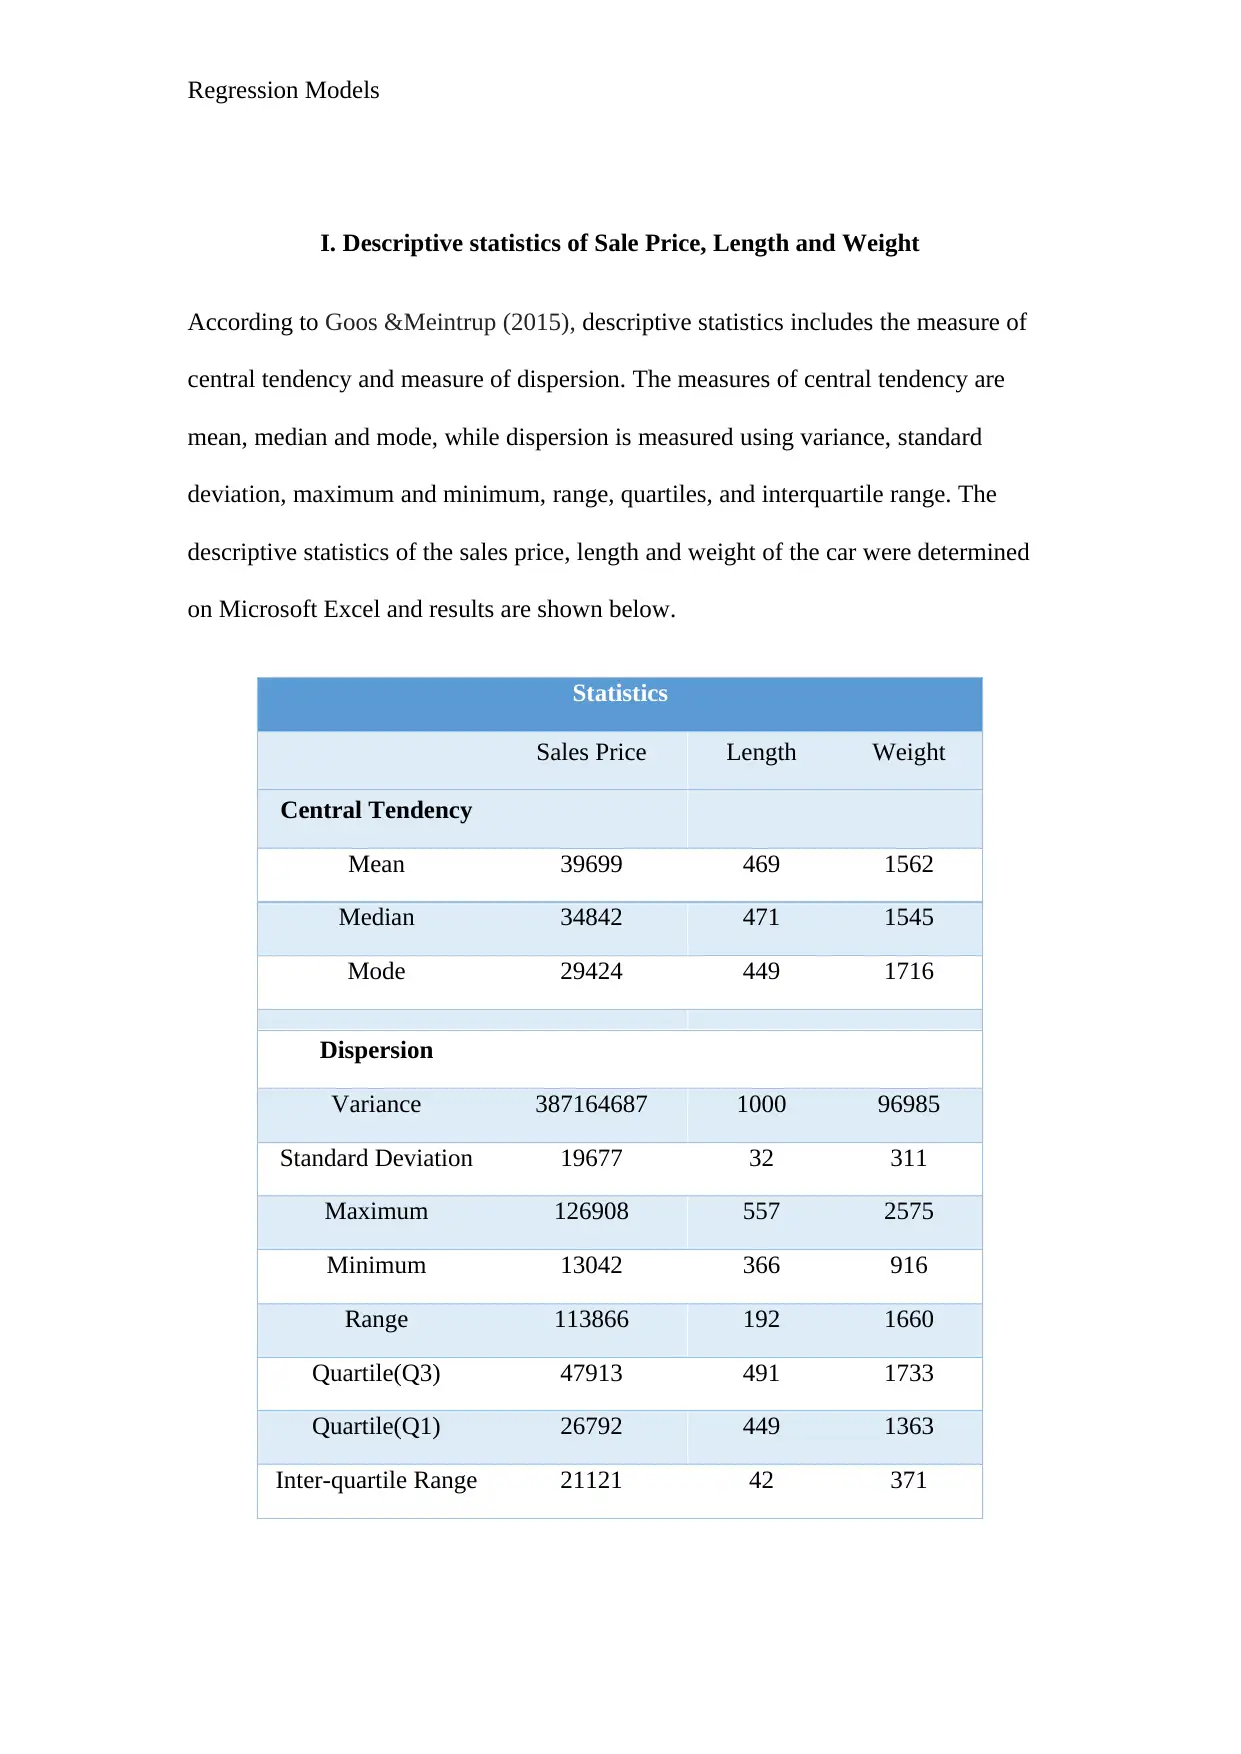
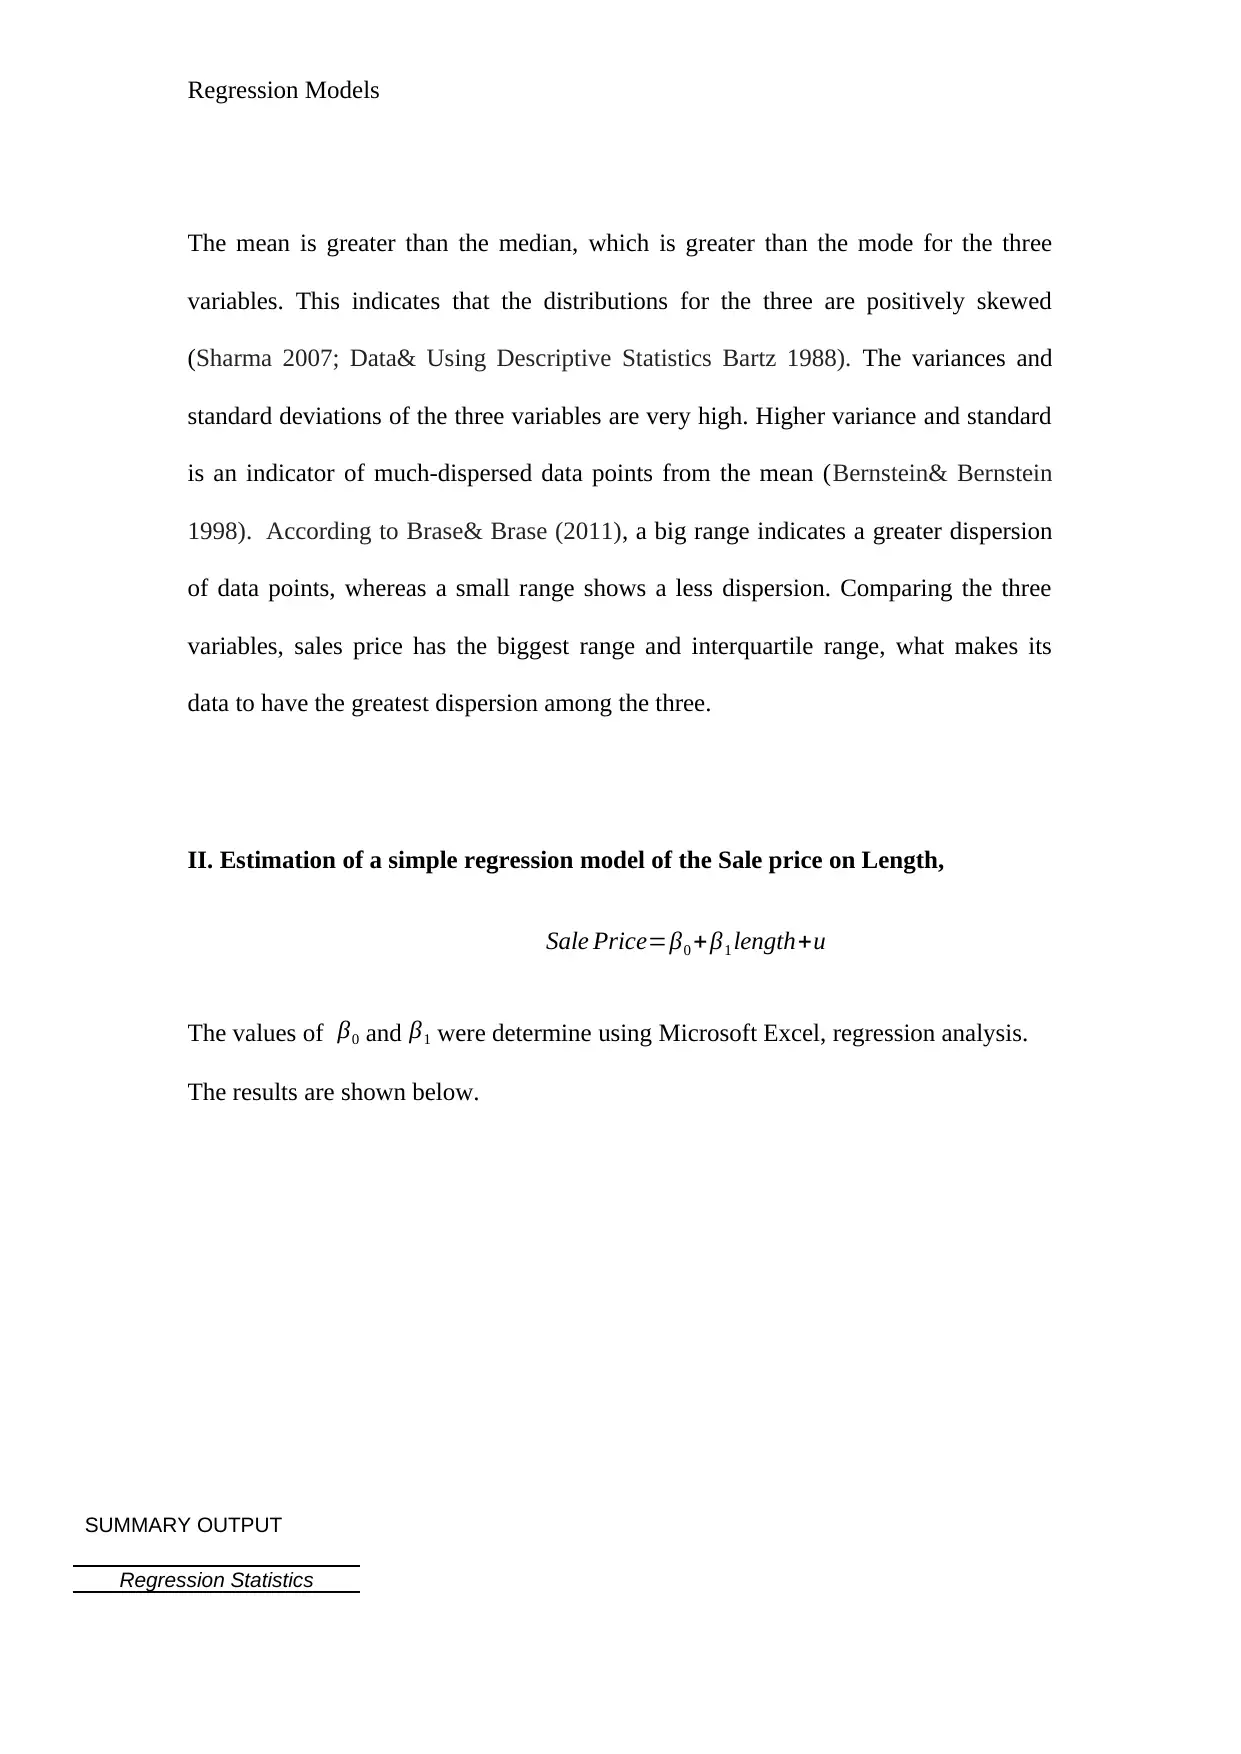
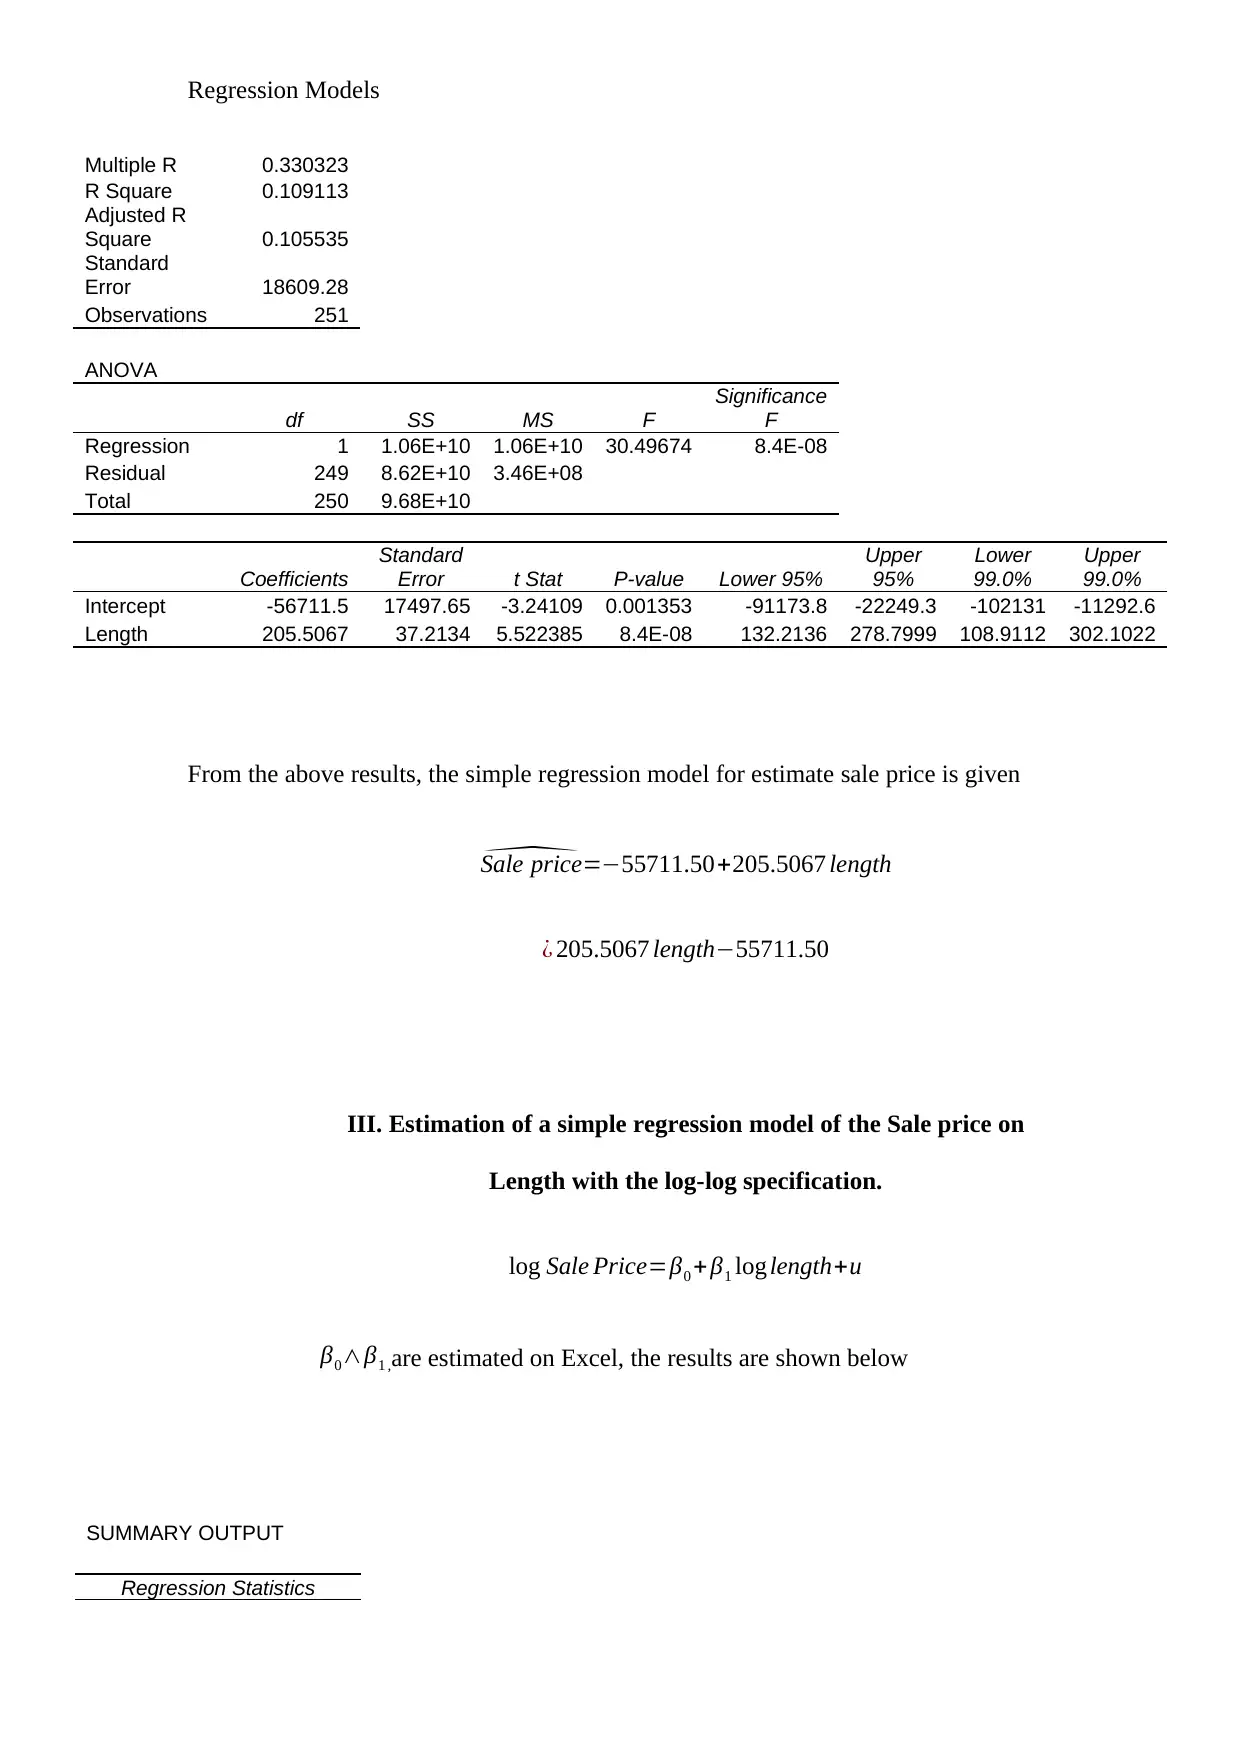
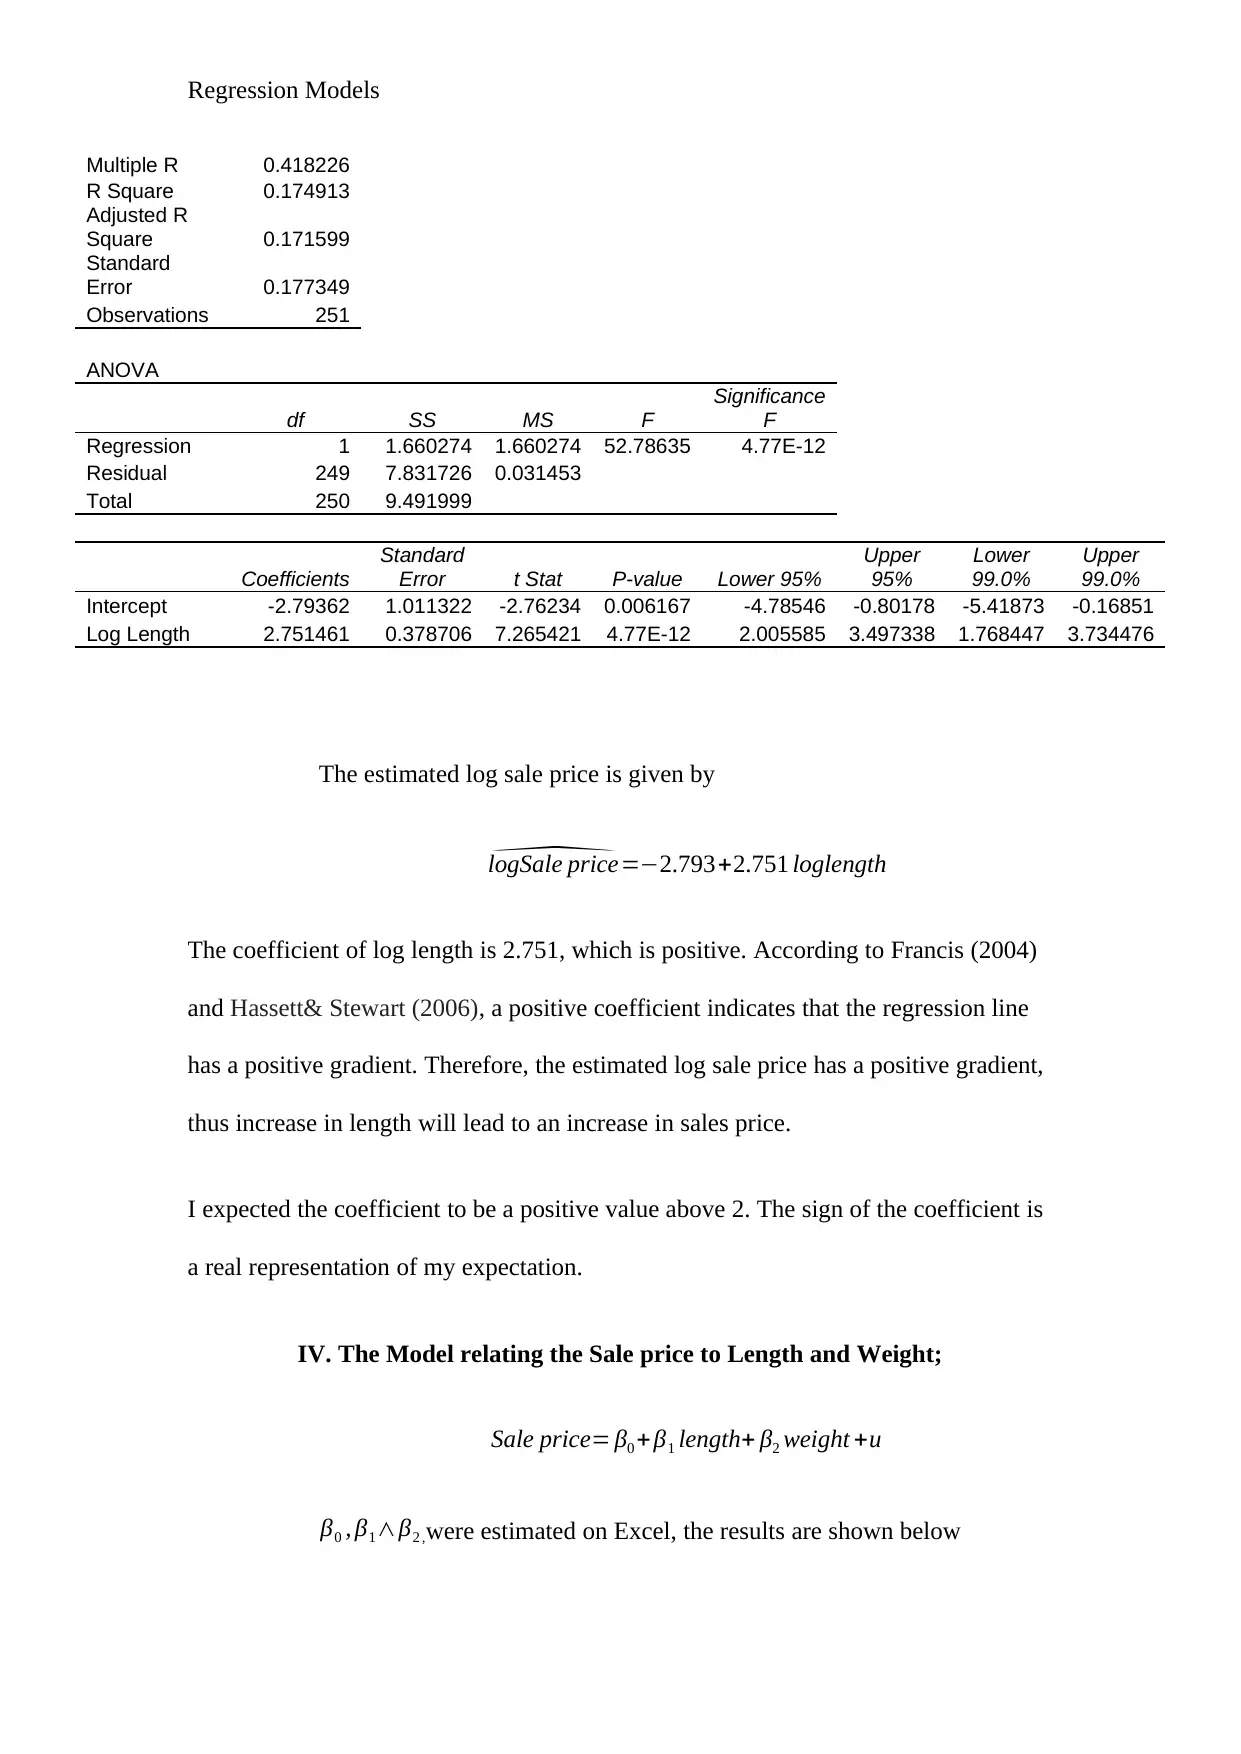
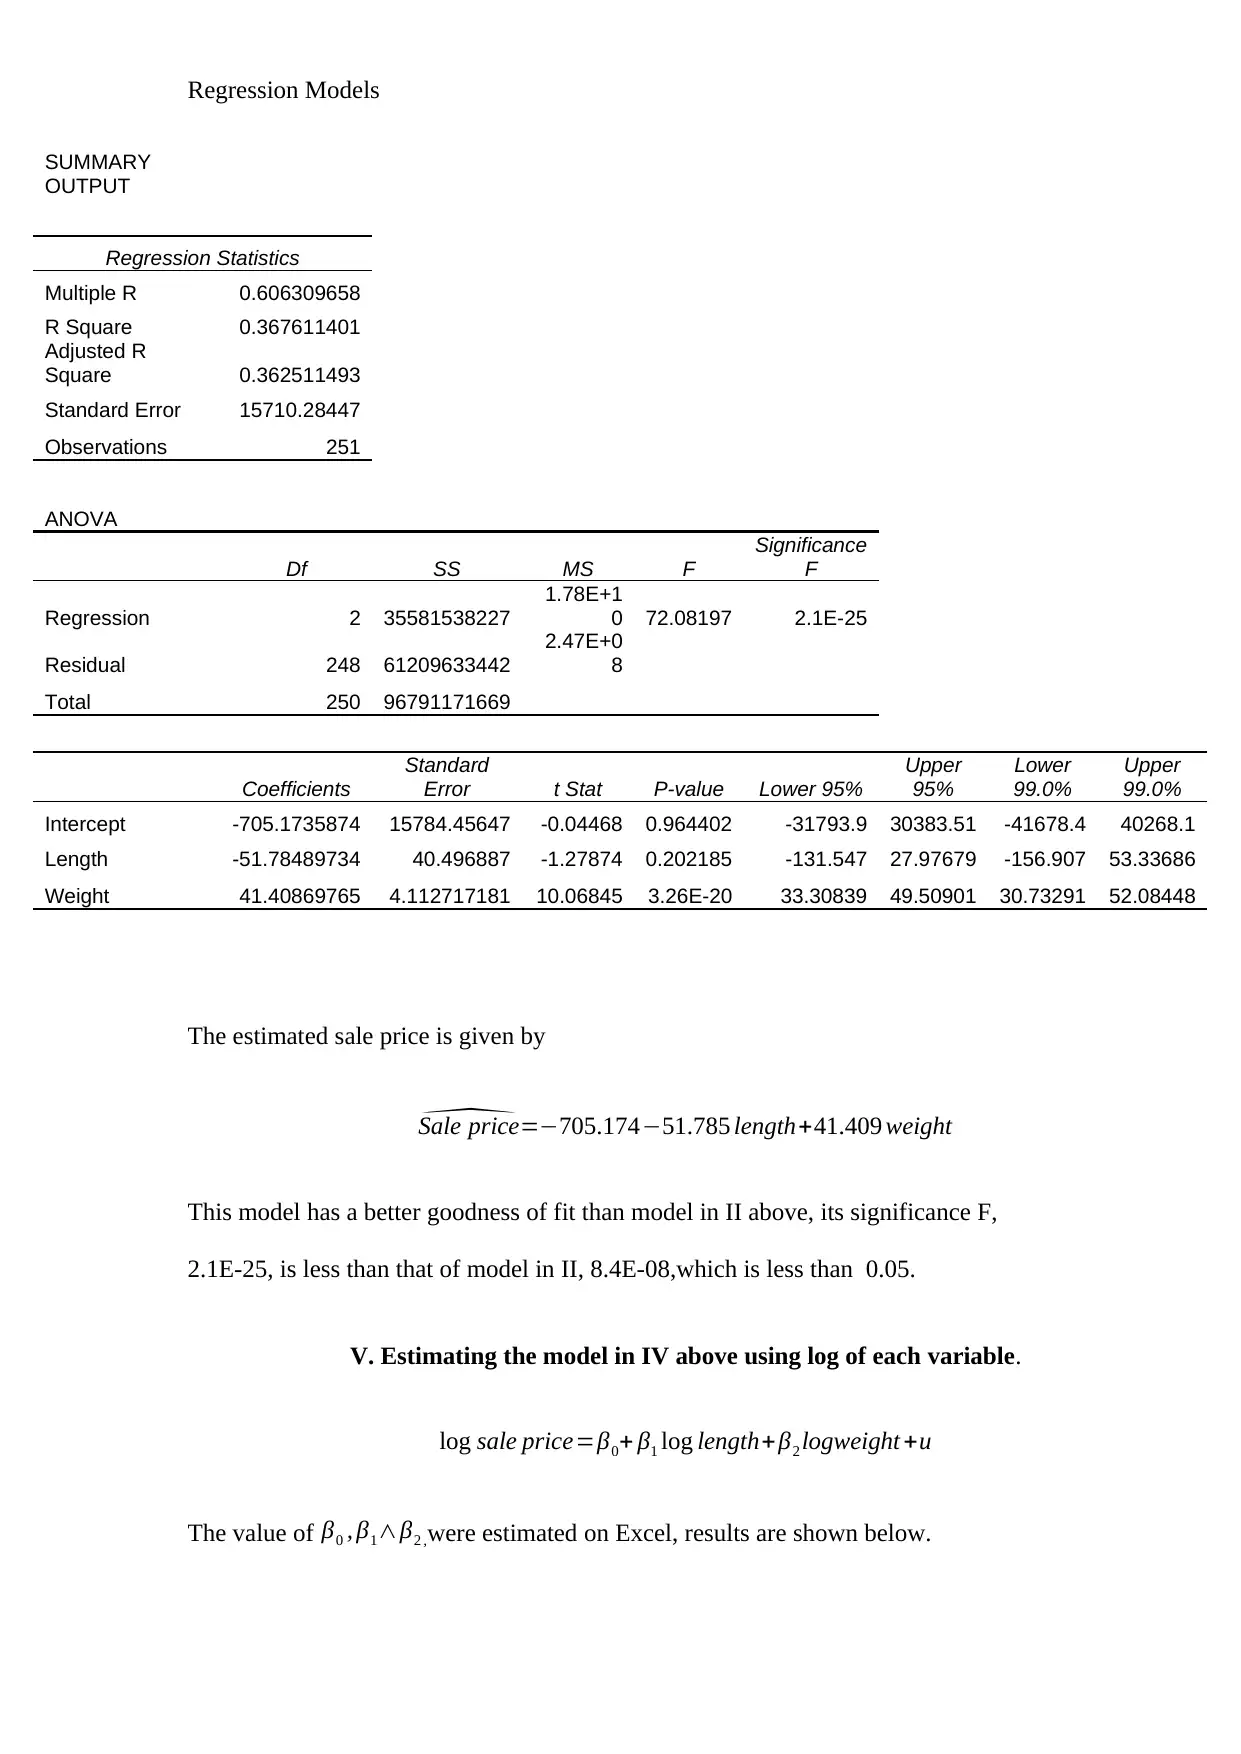
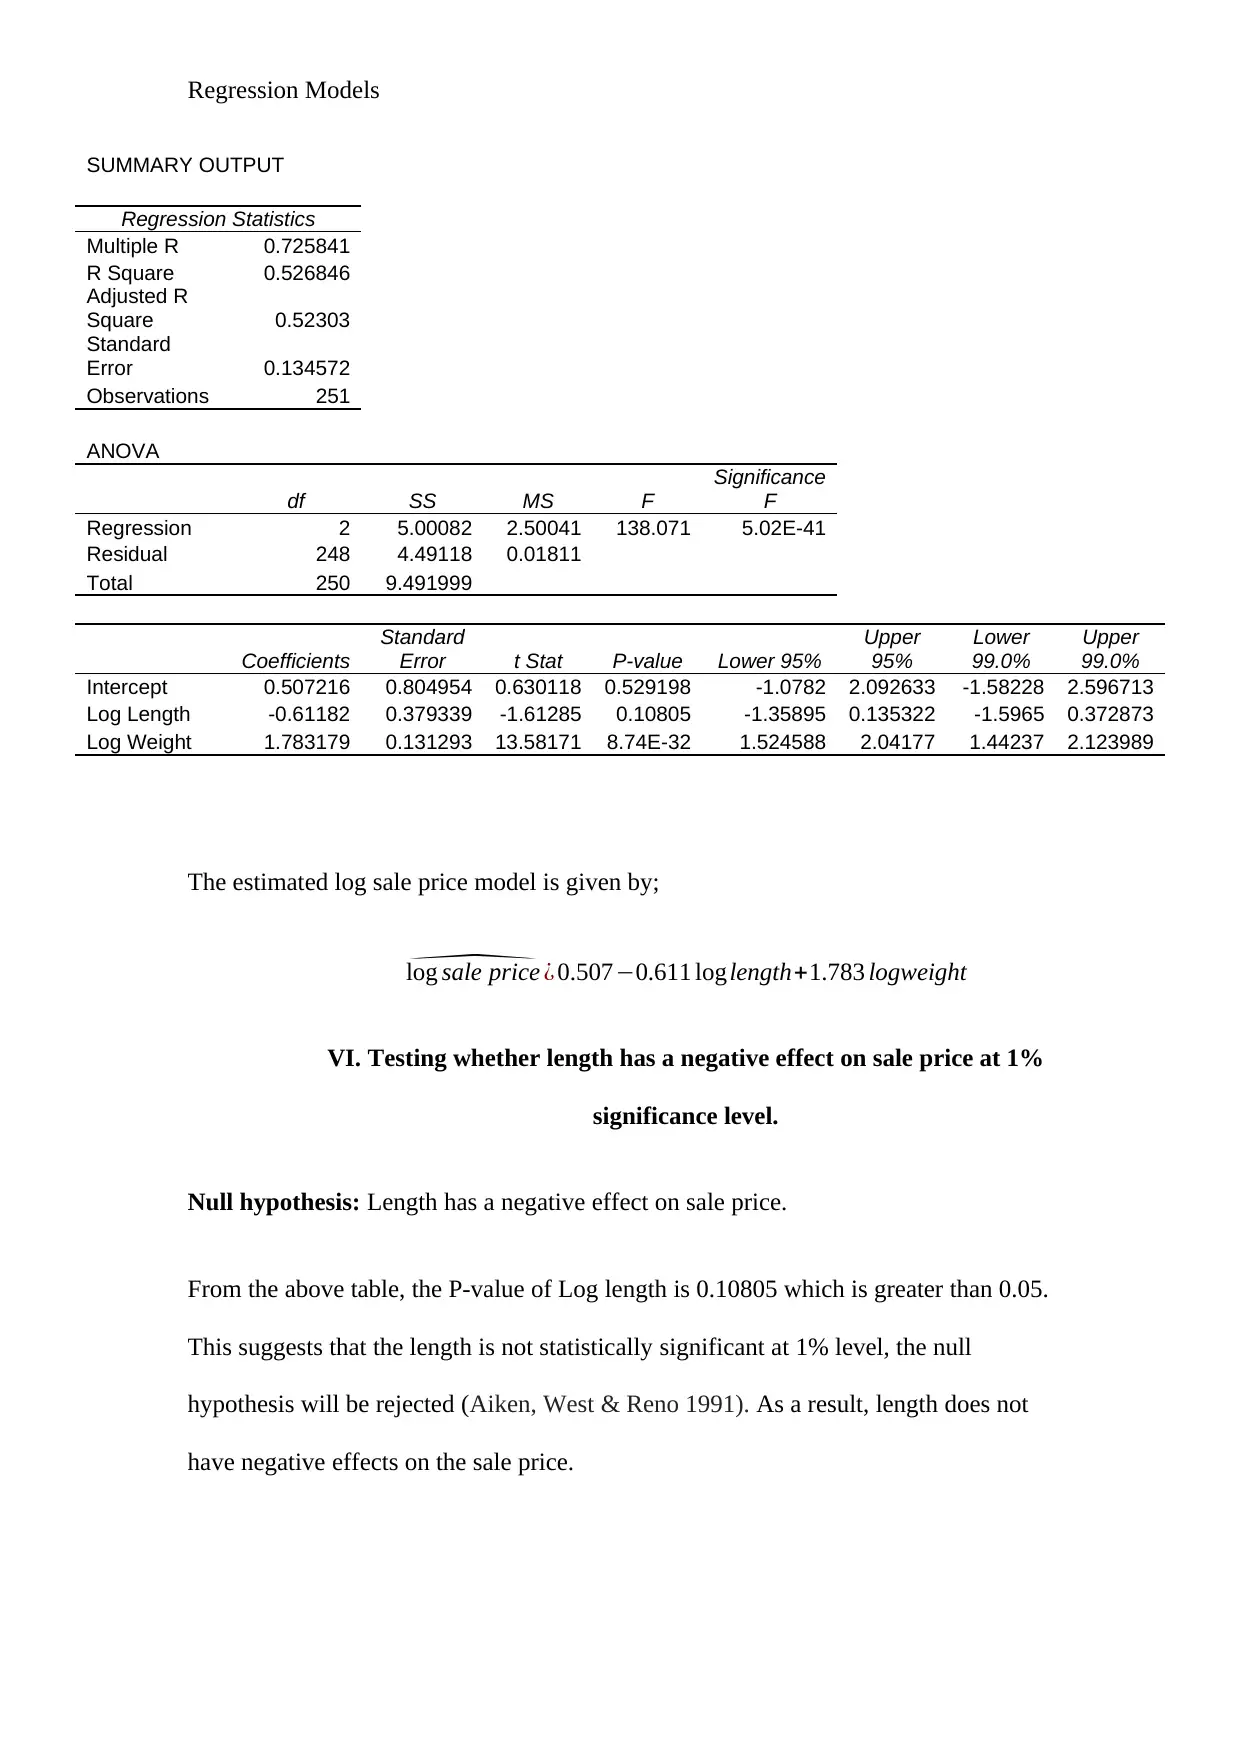
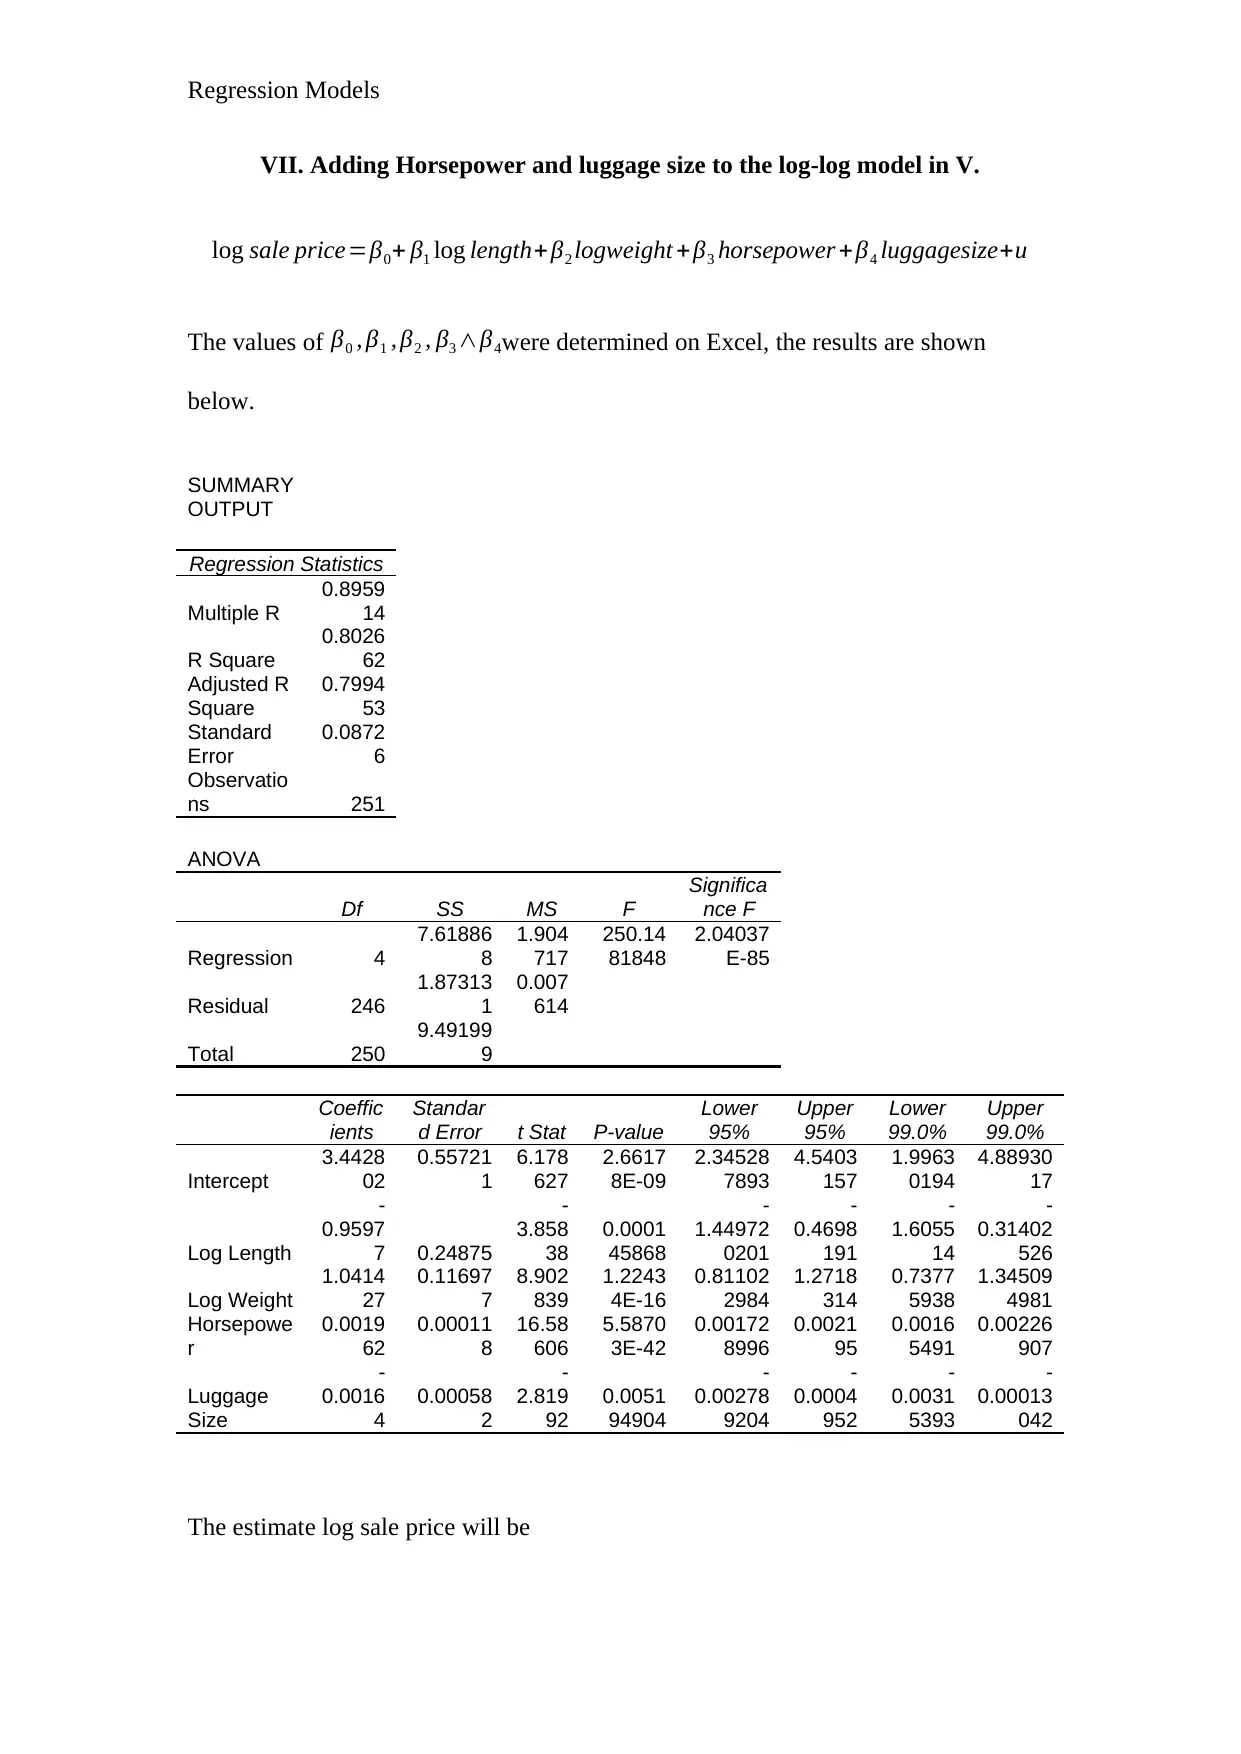
This report analyzes car sale prices using various regression models, incorporating factors like length and weight. Descriptive statistics are presented for sale price, length, and weight, followed by estimations of simple regression models, including a log-log specification. The report examines the impact of length and weight on sale price, tests the significance of these variables, and explores the effects of adding horsepower and luggage size to the model. Hypothesis testing is conducted to determine if luxury cars are more expensive. The overall significance of the models is assessed using significance F values and P-values to determine the statistical significance of the variables. The report concludes with a discussion of the findings and their implications for understanding the factors influencing car sale prices. Desklib provides access to similar solved assignments for students.
1 out of 11
Related Documents


Your All-in-One AI-Powered Toolkit for Academic Success.
+13062052269
info@desklib.com
Available 24*7 on WhatsApp / Email
![[object Object]](/_next/static/media/star-bottom.7253800d.svg)
Copyright © 2020–2026 A2Z Services. All Rights Reserved. Developed and managed by ZUCOL.