Comprehensive Financial Analysis of The Reject Shop Limited (TRS)

Verified

Added on  2023/06/11

|9
|1964
|468
Report
AI Summary
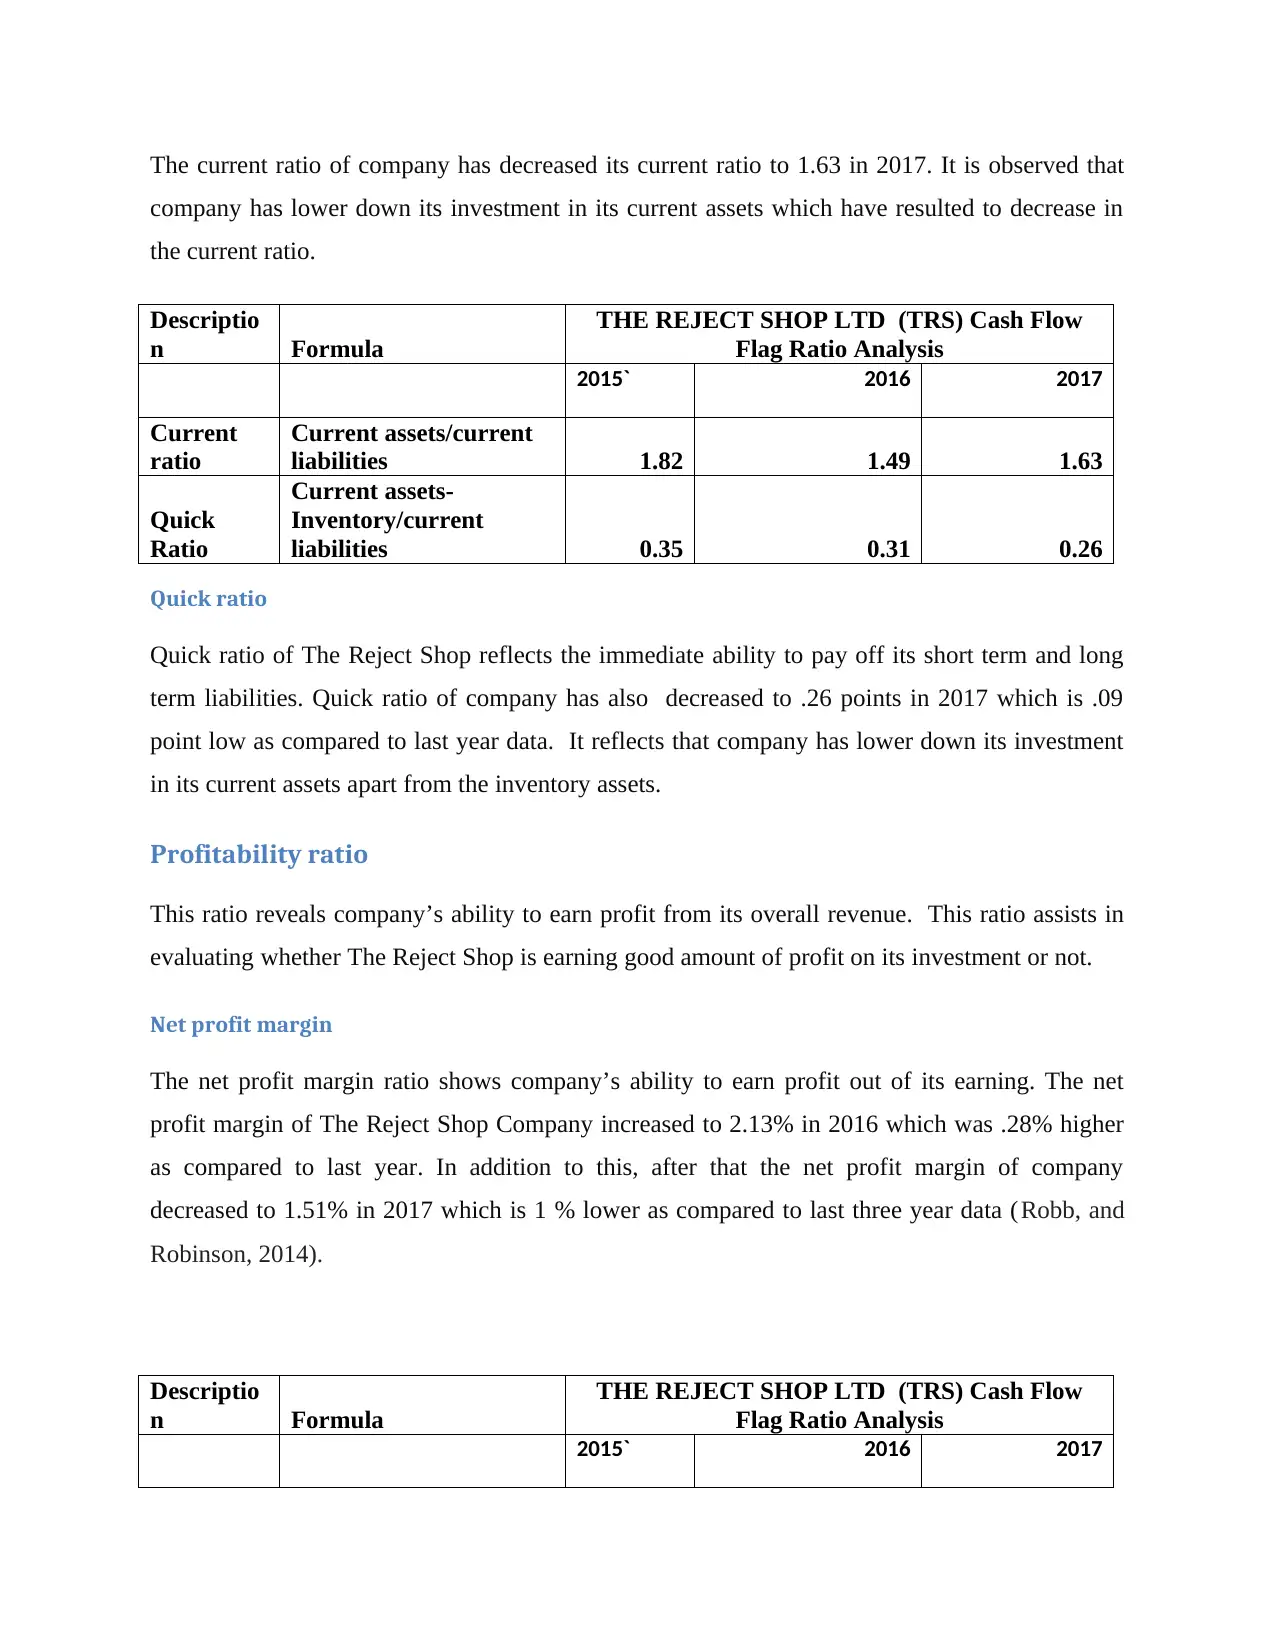
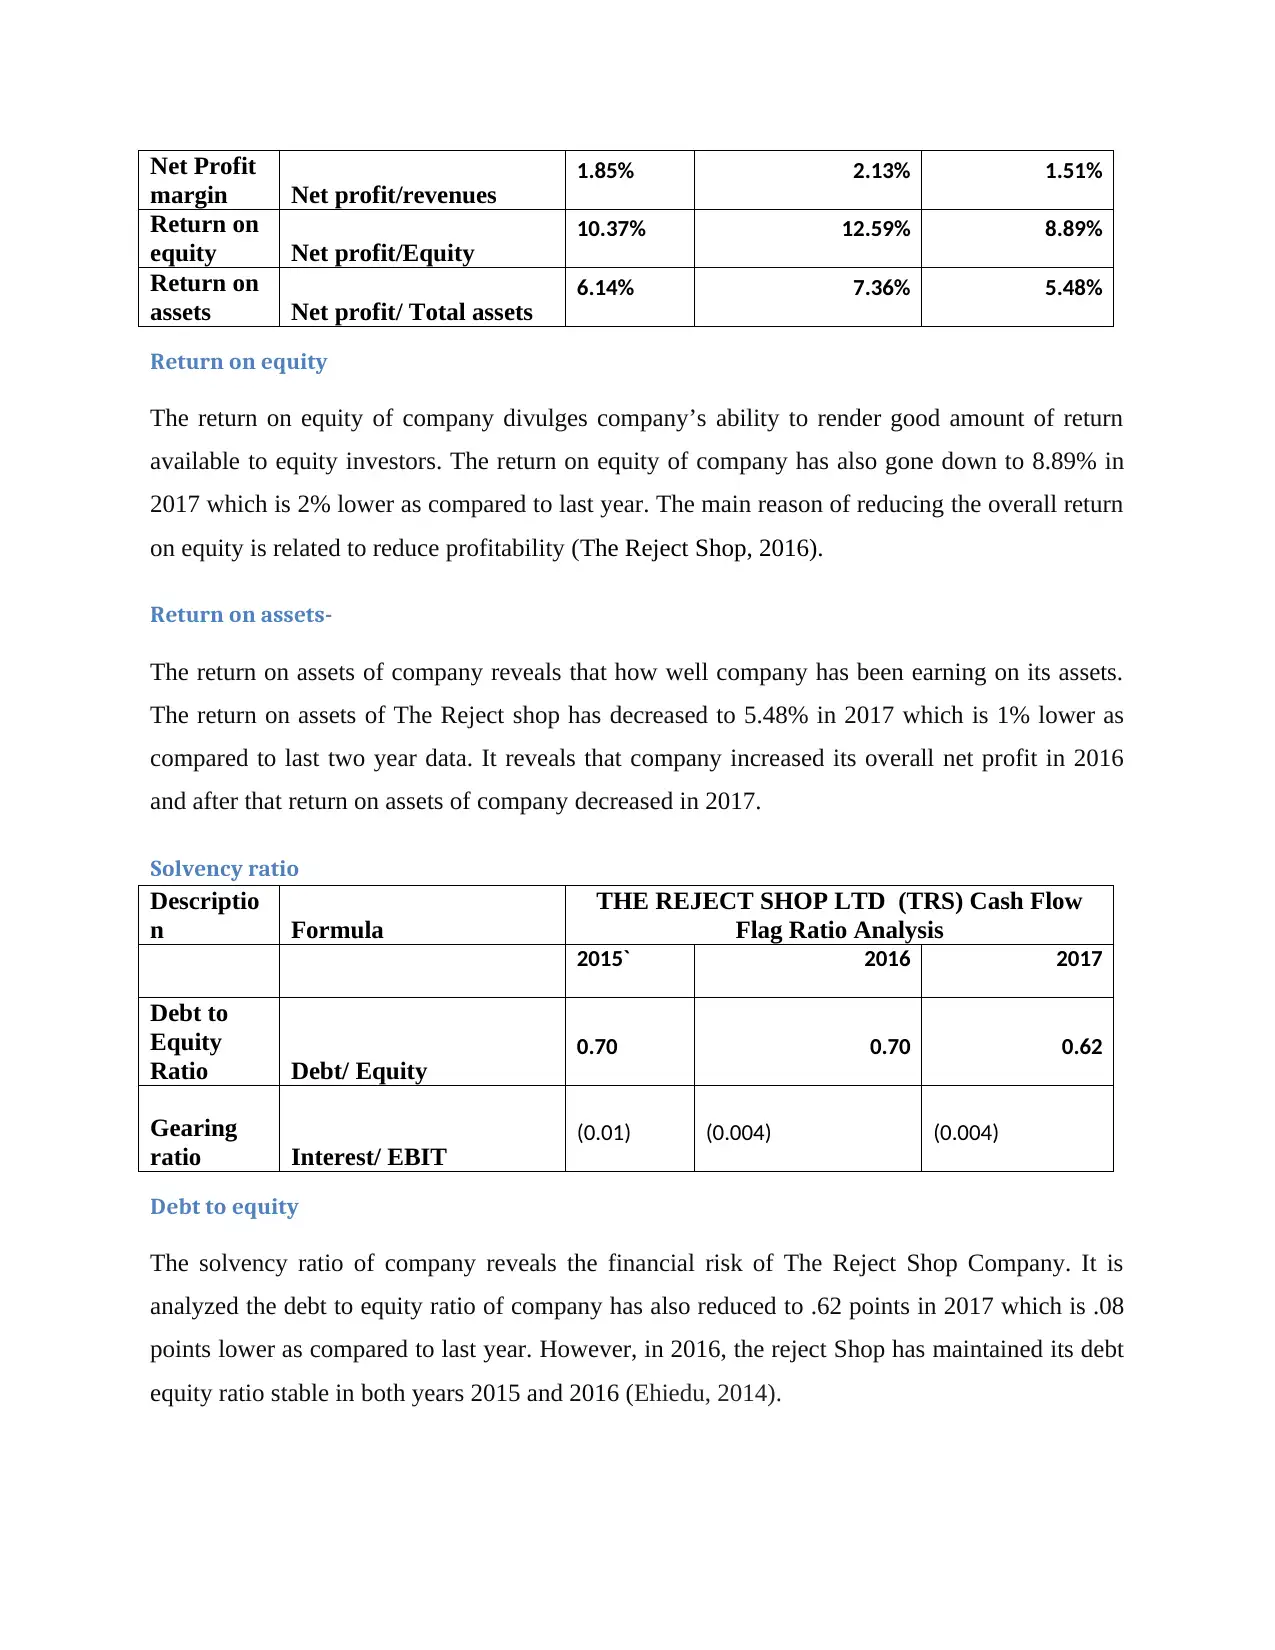
This report provides a financial analysis of The Reject Shop Limited, an Australian discount variety store chain, using ratio analysis to evaluate its financial performance. The analysis includes liquidity ratios (current and quick ratios), profitability ratios (net profit margin, return on equity, and return on assets), solvency ratios (debt to equity and gearing ratio), efficiency ratios (creditors payable period, inventory turnover ratio, and asset turnover ratio), and market ratios (PE ratio and dividend payout ratio). The report identifies key findings such as increased dividend payments, high financial leverage, fluctuating profitability, and positive general investment proposals. It recommends long-term investment in The Reject Shop and advises the company to reduce its financial leverage. The conclusion suggests that the company will perform well in the long run with adjustments to its financial structure.
Document Page
the Reject Shop
Financial analysis of The Reject Shop
Business Financial analysis
Name of the Author
University Name-
tabler-icon-diamond-filled.svg

Paraphrase This Document

Need a fresh take? Get an instant paraphrase of this document with our AI Paraphraser
Document Page
Introduction
With the ramified economic changes, and complex busienss structure, each and every
organization needs to put extraordinary efforts to achieve the set of goals and objectives. In this
report, financial analysis tool, (Ratio analysis) have been used to evaluate the financial
performance of company. The ratio analysis is accompanied with the liquidity ratio, profitability
ratio, solvency ratio, market ratio which will assist in evaluating how company has been
performing in the market. In this report, The Reject Shop Limited has been taken into
consideration.
The Reject Shop Limited
It is an Australian Discount variety stores chain founded in 1981 and running its busienss
on international level. This company is listed on the Australian Stock Exchange and the market
capitalization of the company has been increased to 149 billion which has increased by 23%
since last five years.
Financial analysis of company
The financial analysis of company is done by using the ratio analysis of company. Ratio
analysis helps in evaluating the financial performance of company by establishment of nexus
between two financial factors. In this report, liquidity ratio, profitability ratio, solvency ratio,
market ratio of The Reject Shop has been computed to identify the past and future performance
of company.
Liquidity ratio
This ratio analysis The Reject Shop Company analysis its ability to pay off its short term and
long term debts out of the available current assets.
Current ratio
The current ratio shows how well company could pay off its short term and long term debts out
of the current assets (Delen, Kuzey, and Uyar, 2013).
Document Page
The current ratio of company has decreased its current ratio to 1.63 in 2017. It is observed that
company has lower down its investment in its current assets which have resulted to decrease in
the current ratio.
Descriptio
n Formula
THE REJECT SHOP LTD (TRS) Cash Flow
Flag Ratio Analysis
2015` 2016 2017
Current
ratio
Current assets/current
liabilities 1.82 1.49 1.63
Quick
Ratio
Current assets-
Inventory/current
liabilities 0.35 0.31 0.26
Quick ratio
Quick ratio of The Reject Shop reflects the immediate ability to pay off its short term and long
term liabilities. Quick ratio of company has also decreased to .26 points in 2017 which is .09
point low as compared to last year data. It reflects that company has lower down its investment
in its current assets apart from the inventory assets.
Profitability ratio
This ratio reveals company’s ability to earn profit from its overall revenue. This ratio assists in
evaluating whether The Reject Shop is earning good amount of profit on its investment or not.
Net profit margin
The net profit margin ratio shows company’s ability to earn profit out of its earning. The net
profit margin of The Reject Shop Company increased to 2.13% in 2016 which was .28% higher
as compared to last year. In addition to this, after that the net profit margin of company
decreased to 1.51% in 2017 which is 1 % lower as compared to last three year data (Robb, and
Robinson, 2014).
Descriptio
n Formula
THE REJECT SHOP LTD (TRS) Cash Flow
Flag Ratio Analysis
2015` 2016 2017
Document Page
Net Profit
margin Net profit/revenues 1.85% 2.13% 1.51%
Return on
equity Net profit/Equity 10.37% 12.59% 8.89%
Return on
assets Net profit/ Total assets 6.14% 7.36% 5.48%
Return on equity
The return on equity of company divulges company’s ability to render good amount of return
available to equity investors. The return on equity of company has also gone down to 8.89% in
2017 which is 2% lower as compared to last year. The main reason of reducing the overall return
on equity is related to reduce profitability (The Reject Shop, 2016).
Return on assets-
The return on assets of company reveals that how well company has been earning on its assets.
The return on assets of The Reject shop has decreased to 5.48% in 2017 which is 1% lower as
compared to last two year data. It reveals that company increased its overall net profit in 2016
and after that return on assets of company decreased in 2017.
Solvency ratio
Descriptio
n Formula
THE REJECT SHOP LTD (TRS) Cash Flow
Flag Ratio Analysis
2015` 2016 2017
Debt to
Equity
Ratio Debt/ Equity 0.70 0.70 0.62
Gearing
ratio Interest/ EBIT (0.01) (0.004) (0.004)
Debt to equity
The solvency ratio of company reveals the financial risk of The Reject Shop Company. It is
analyzed the debt to equity ratio of company has also reduced to .62 points in 2017 which is .08
points lower as compared to last year. However, in 2016, the reject Shop has maintained its debt
equity ratio stable in both years 2015 and 2016 (Ehiedu, 2014).
tabler-icon-diamond-filled.svg

Paraphrase This Document

Need a fresh take? Get an instant paraphrase of this document with our AI Paraphraser
Document Page
Efficiency ratio
The efficiency ratio shows how well company deploys its assets in order to create value on its
investment (Flannery, 2016).
Descriptio
n Formula
THE REJECT SHOP LTD (TRS) Cash Flow
Flag Ratio Analysis
2015` 2016 2017
Creditors
payable
period
creditors / Total
sales*365 31.29 22.27 23.26
Inventory
Turnover
ratio COGS/ Sales*365 202.51 209.42 209.16
Asset
turnover
ratio Total sales/ Total assets 3.32 3.46 3.63
Creditor’s turnover ratio
The creditor’s turnover ratio has decreased to 23.26 times as company has lower down its
creditors. However, as compared to last two year data, creditor turnover ratio has decreased by
10 points. It might increase the overall cost of capital of business (Grant, 2016).
Inventory Turnover ratio
The inventory turnover ratio of company has increased to 209.16 times in 2016 which is 7 times
higher as compared to last year data. It reflects that company has increased the inventory
investment which has also increased the inventory turnover (Jordan, 2014).
Assets turnover ratio
The assets turnover ratio of company has been stable since last three years. It has shown that
company has effectively used its resources to manage its busienss which has also lower down its
cost of capital throughout the time.
Document Page
Market ratio (General investment proposal analysis)
This ratio reveals how well company has created value on its investment.
Descriptio
n Formula
THE REJECT SHOP LTD (TRS) Cash Flow Flag
Ratio Analysis
2015` 2016 2017
PE Ratio MPS/EPS 53.04 52.41 73.13
Dividend
Payout
dividend payment/
Earning *100 5% 6.4% 10%
The market price of company is AUD $ 6 which reflects that company has increased the value of
its shares in market. However, PE ratio of company has been increased to 74 points in 2017
which is 20 points higher as compared to last three year data.
Dividend payout ratio
The dividend payout ratio is the amount of dividend payment given to The Reject Shop
Company. It has been observed that company has increased its dividend payout to 10% in 2017
which is 5% higher as compared to last year data (Mwangi, and Murigu, 2015).
The Reject Shop Company has been planning to increase its investment in other busienss units
which might increase the overall outcomes in determined approach.
Evaluation of the key points found in this financial analysis
There are several key points which have been found in this report.
Company has increased its dividend payment which reflects that company wants to
attract more investors to invest capital in its business (Weygandt, Kimmel, and Kieso,
2015).
The financial leverage of company is too high which might be the negative indicators for
the sustainable future of organization.
Document Page
The profitability of company is low in 2015 and 2017. However, in 2016, Company had
maintained good profitability due to the effective market condition.
The invested capital in the busienss may increase the overall costing of busienss or may
result to negative business impact on the business sustainability of organization.
The general investment proposal of company is very positive. After evaluating the annual
report, it could be inferred company want to invest its capital in opening more chains
which might positively impact the business growth (White, Sondh, and Fried, 2015).
Recommendation
If investors want to invest their capital in The Reject shop then they should invest their capital in
long run as investing capital in the reject Shop for short term purpose may negatively impact the
return on capital employed.
Company will grow effectively within 5 years therefor; investing capital at this point of time in
The Reject Company will create value on the investment.
Conclusion
After analyzing all the detail and financial performance of The Reject Shop, it could be inferred
that company will perform well in long run. However, company needs to lower down its
financial leverage by lower down its interest gearing and debt portion in its busienss. Investors
are also advised to keep their money invested in The Reject Shop for long run if they want to
create value on their investment.
tabler-icon-diamond-filled.svg

Paraphrase This Document

Need a fresh take? Get an instant paraphrase of this document with our AI Paraphraser
Document Page
References
Delen, D., Kuzey, C. and Uyar, A., 2013. Measuring firm performance using financial ratios: A
decision tree approach. Expert Systems with Applications, 40(10), pp.3970-3983.
Ehiedu, V.C., 2014. The impact of liquidity on profitability of some selected companies: The
financial statement analysis (FSA) approach. Research Journal of Finance and Accounting, 5(5),
pp.81-90.
Flannery, M.J., 2016. Stabilizing large financial institutions with contingent capital
certificates. Quarterly Journal of Finance, 6(02), p.1650006.
Grant, R.M., 2016. Contemporary strategy analysis: Text and cases edition. John Wiley & Sons.
Jordan, B., 2014. Fundamentals of investments. McGraw-Hill Higher Education.
Mwangi, M. and Murigu, J.W., 2015. The determinants of financial performance in general
insurance companies in Kenya. European Scientific Journal, ESJ, 11(1).
Mwangi, M. and Murigu, J.W., 2015. The determinants of financial performance in general
insurance companies in Kenya. European Scientific Journal, ESJ, 11(1).
Robb, A.M. and Robinson, D.T., 2014. The capital structure decisions of new firms. The Review
of Financial Studies, 27(1), pp.153-179.
The Reject Shop, 2015, Annual report, Available at
https://www.rejectshop.com.au/aboutus/investorinformation/financialreport., Accessed on 2nd
June, 2018,
The Reject Shop, 2016, Annual report, Available at
https://www.rejectshop.com.au/aboutus/investorinformation/financialreport., Accessed on 2nd
June, 2018,
Weygandt, J.J., Kimmel, P.D. and Kieso, D.E., 2015. Financial & managerial accounting. John
Wiley & Sons.
White, G.L., Sondh, A.C. and Fried, D., 2015. Analysis of Financial Statement. Analysis.
Document Page
chevron_up_icon
1 out of 9
circle_padding
hide_on_mobile
zoom_out_icon
[object Object]