Analyzing Financial Health: A Report on The Reject Shop's Performance
VerifiedAdded on 2023/06/11
|6
|796
|254
Report
AI Summary
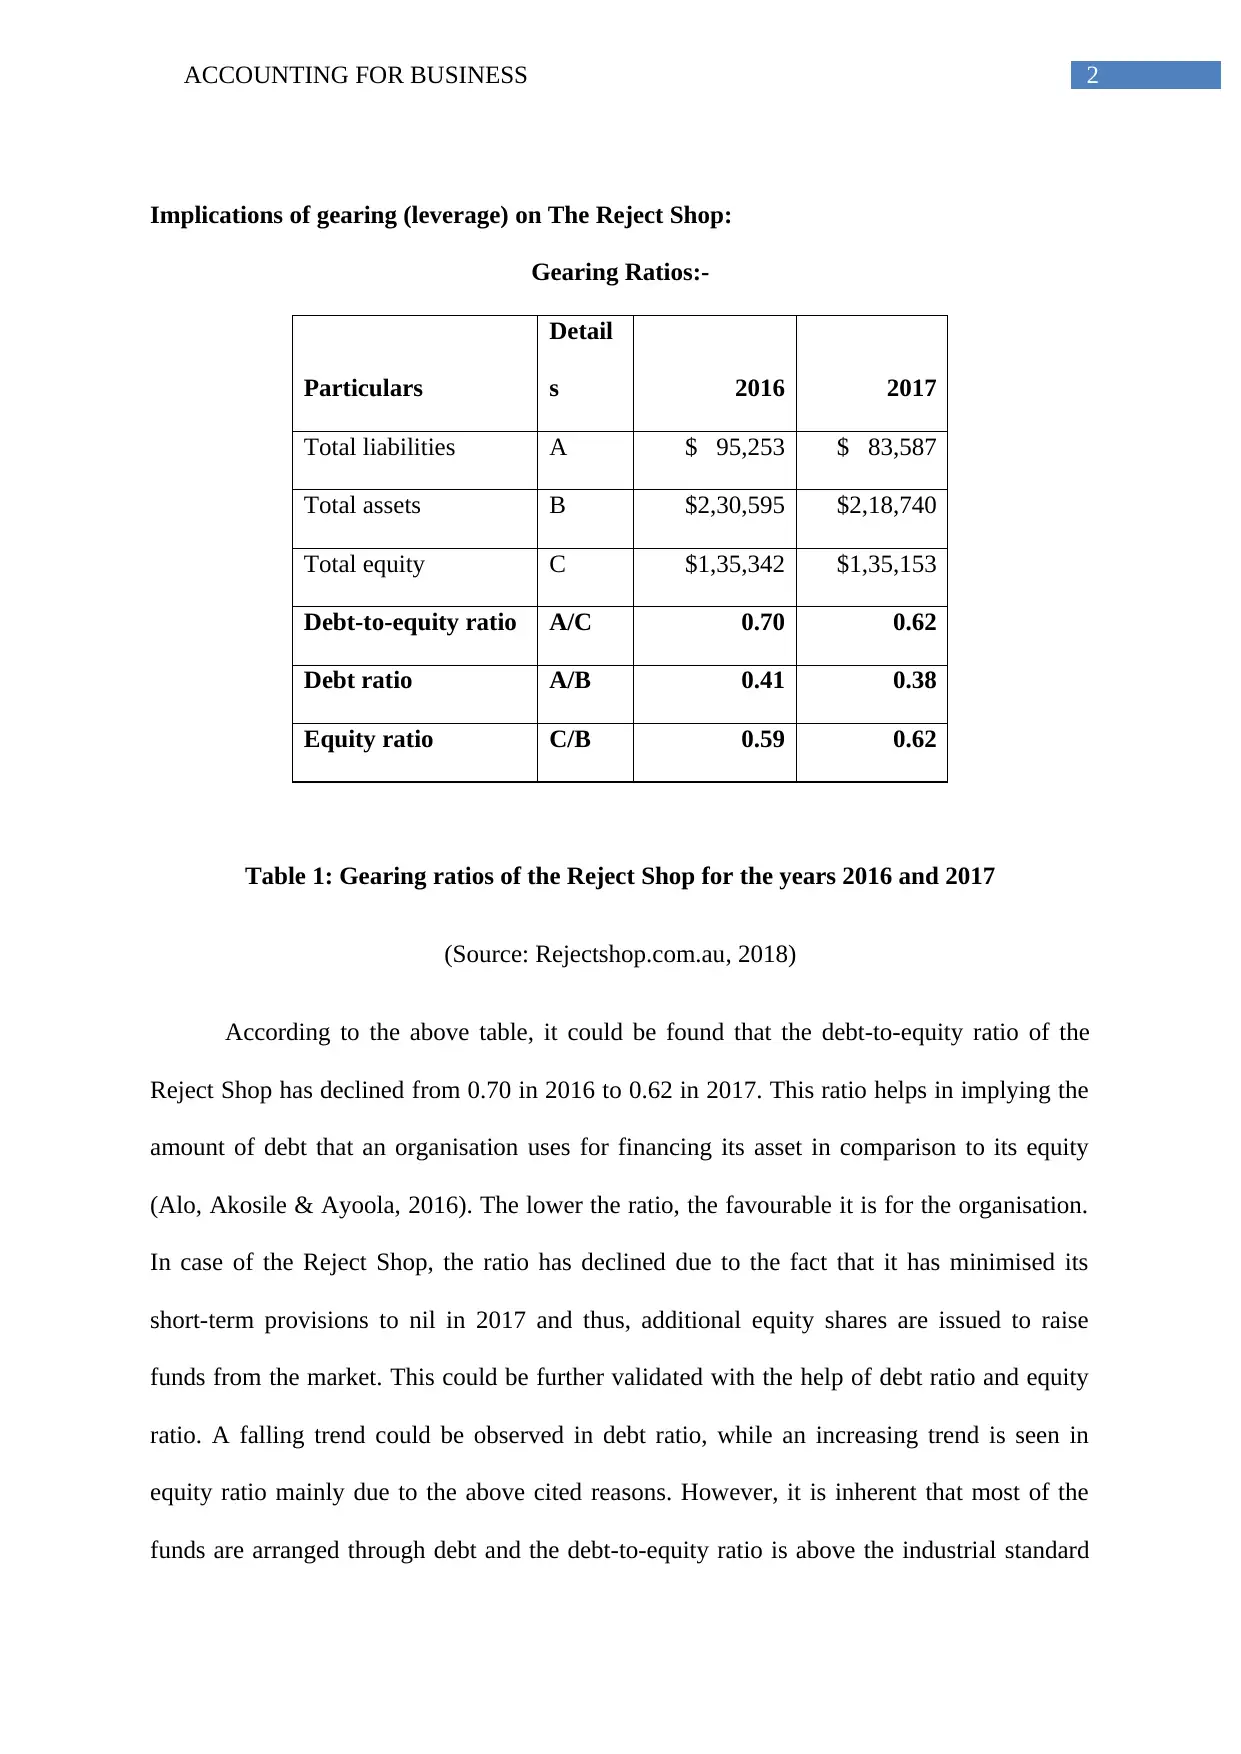
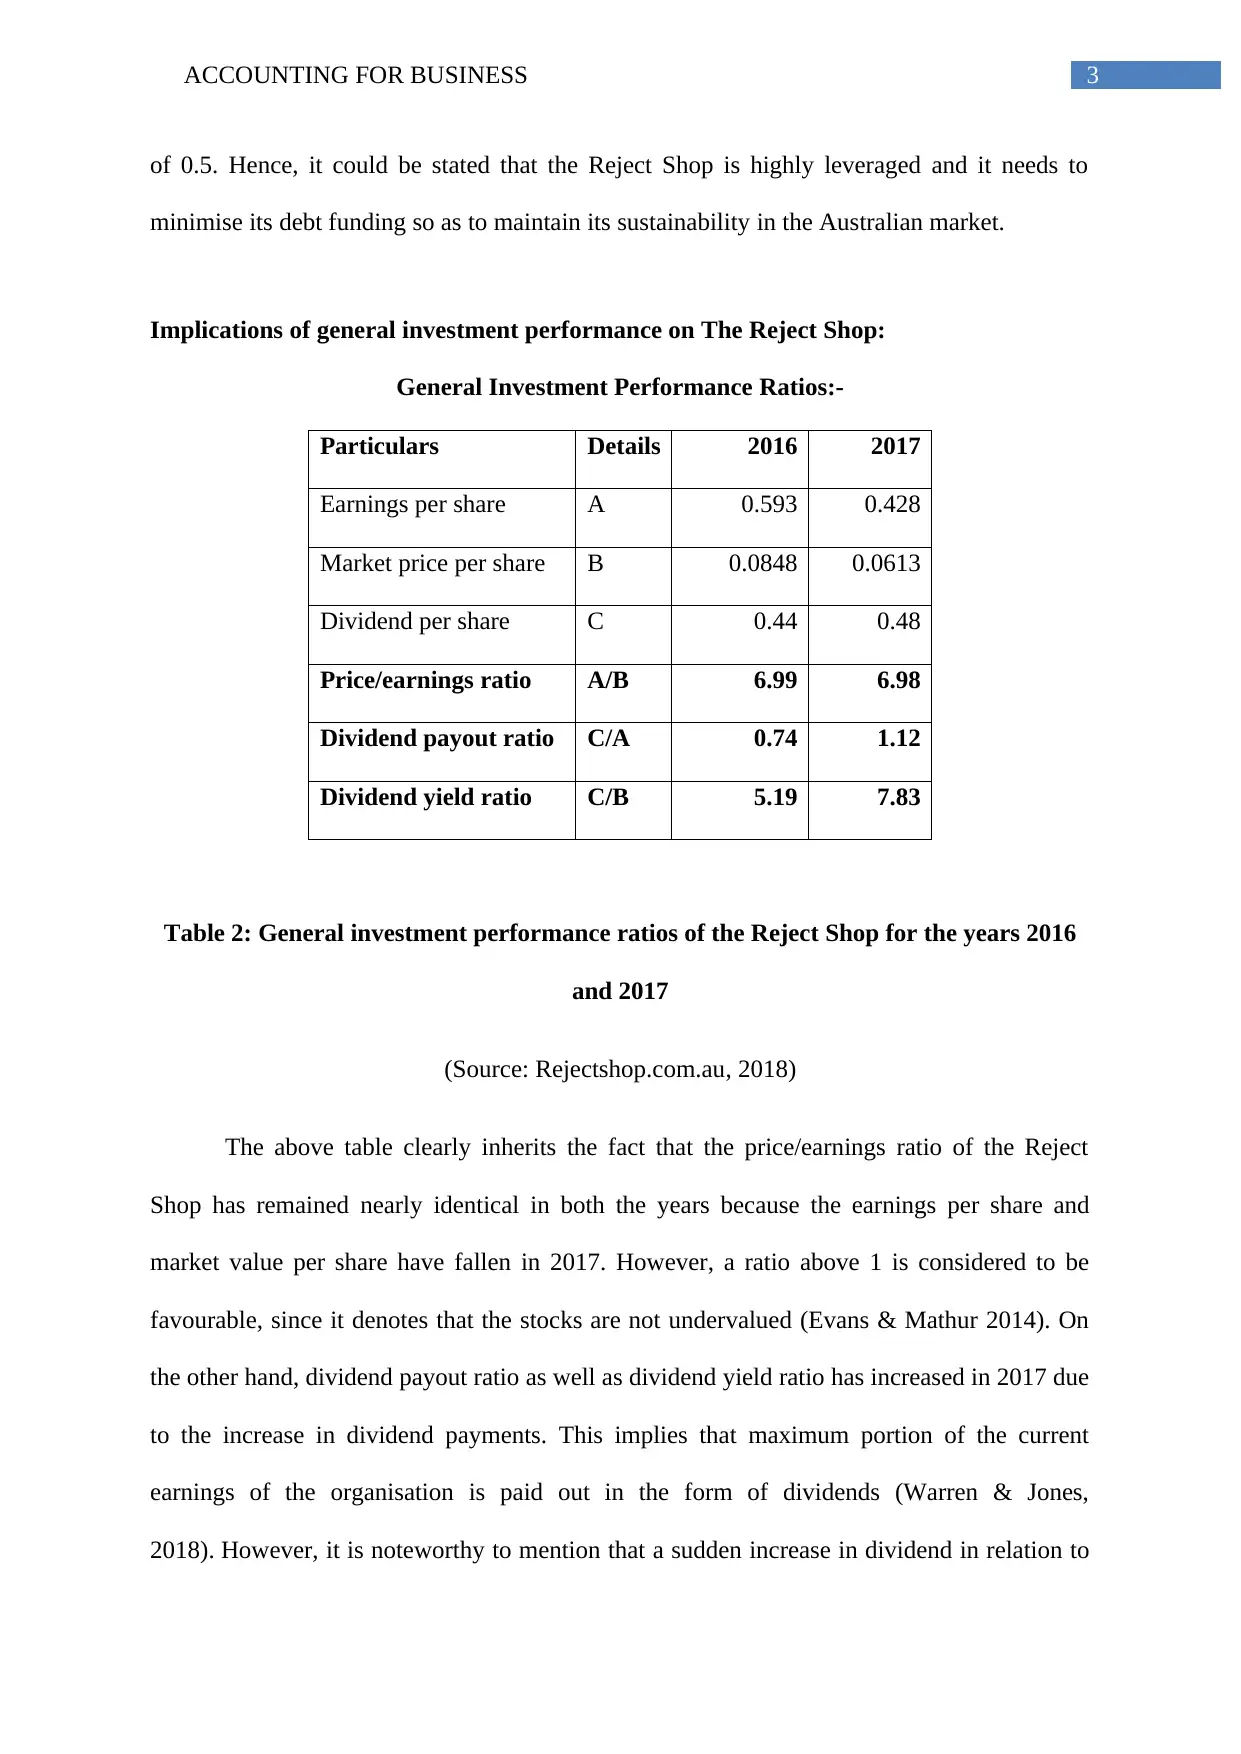
This report provides a financial analysis of The Reject Shop, focusing on its gearing (leverage) and general investment performance. It examines the company's debt-to-equity ratio, debt ratio, and equity ratio, noting a decrease in the debt-to-equity ratio from 2016 to 2017. However, the report ...

Running head: ACCOUNTING FOR BUSINESS
Accounting for Business
Name of the Student:
Name of the University:
Author’s Note:
Course ID:
Accounting for Business
Name of the Student:
Name of the University:
Author’s Note:
Course ID:
Paraphrase This Document
Need a fresh take? Get an instant paraphrase of this document with our AI Paraphraser

1ACCOUNTING FOR BUSINESS
Table of Contents
Implications of gearing (leverage) on The Reject Shop:...........................................................2
Implications of general investment performance on The Reject Shop:.....................................3
References:.................................................................................................................................5

2ACCOUNTING FOR BUSINESS
Implications of gearing (leverage) on The Reject Shop:
Gearing Ratios:-
Particulars
Detail
s 2016 2017
Total liabilities A $ 95,253 $ 83,587
Total assets B $2,30,595 $2,18,740
Total equity C $1,35,342 $1,35,153
Debt-to-equity ratio A/C 0.70 0.62
Debt ratio A/B 0.41 0.38
Equity ratio C/B 0.59 0.62
Table 1: Gearing ratios of the Reject Shop for the years 2016 and 2017
(Source: Rejectshop.com.au, 2018)
According to the above table, it could be found that the debt-to-equity ratio of the
Reject Shop has declined from 0.70 in 2016 to 0.62 in 2017. This ratio helps in implying the
amount of debt that an organisation uses for financing its asset in comparison to its equity
(Alo, Akosile & Ayoola, 2016). The lower the ratio, the favourable it is for the organisation.
In case of the Reject Shop, the ratio has declined due to the fact that it has minimised its
short-term provisions to nil in 2017 and thus, additional equity shares are issued to raise
funds from the market. This could be further validated with the help of debt ratio and equity
ratio. A falling trend could be observed in debt ratio, while an increasing trend is seen in
equity ratio mainly due to the above cited reasons. However, it is inherent that most of the
funds are arranged through debt and the debt-to-equity ratio is above the industrial standard
⊘ This is a preview!⊘
Do you want full access?
Subscribe today to unlock all pages.

Trusted by 1+ million students worldwide

3ACCOUNTING FOR BUSINESS
of 0.5. Hence, it could be stated that the Reject Shop is highly leveraged and it needs to
minimise its debt funding so as to maintain its sustainability in the Australian market.
Implications of general investment performance on The Reject Shop:
General Investment Performance Ratios:-
Particulars Details 2016 2017
Earnings per share A 0.593 0.428
Market price per share B 0.0848 0.0613
Dividend per share C 0.44 0.48
Price/earnings ratio A/B 6.99 6.98
Dividend payout ratio C/A 0.74 1.12
Dividend yield ratio C/B 5.19 7.83
Table 2: General investment performance ratios of the Reject Shop for the years 2016
and 2017
(Source: Rejectshop.com.au, 2018)
The above table clearly inherits the fact that the price/earnings ratio of the Reject
Shop has remained nearly identical in both the years because the earnings per share and
market value per share have fallen in 2017. However, a ratio above 1 is considered to be
favourable, since it denotes that the stocks are not undervalued (Evans & Mathur 2014). On
the other hand, dividend payout ratio as well as dividend yield ratio has increased in 2017 due
to the increase in dividend payments. This implies that maximum portion of the current
earnings of the organisation is paid out in the form of dividends (Warren & Jones,
2018). However, it is noteworthy to mention that a sudden increase in dividend in relation to
Paraphrase This Document
Need a fresh take? Get an instant paraphrase of this document with our AI Paraphraser

4ACCOUNTING FOR BUSINESS
the earnings might indicate unstable position of the organisation. In this case, it could be
observed that the Reject Shop has paid more dividends per share to its shareholders in
contrast to its current earnings. Therefore, it could be inferred that the shareholders might not
be able to obtain higher returns in future.

5ACCOUNTING FOR BUSINESS
References:
Alo, E. A., Akosile, A. I., & Ayoola, A. O. (2016). The Statistical Evaluation of the
Performance of Financial Ratio Analysis in Nigerian Manufacturing Industry: An
Empirical Study of Guinness Nigeria PLC. The International Journal of Business &
Management, 4(1), 295.
Evans, J. R., & Mathur, A. (2014). Retailing and the period leading up to the Great
Recession: a model and a 25-year financial ratio analysis of US retailing. The
International Review of Retail, Distribution and Consumer Research, 24(1), 30-58.
Rejectshop.com.au. (2018). Retrieved 4 June 2018, from
https://www.rejectshop.com.au/medias/Appendix-4E-and-Annual-Report-2017.pdf?
context=bWFzdGVyfHJvb3R8MTAxNDU
Warren, C.S. & Jones, J. (2018). Corporate financial accounting. Cengage Learning.
⊘ This is a preview!⊘
Do you want full access?
Subscribe today to unlock all pages.

Trusted by 1+ million students worldwide
1 out of 6
Related Documents

Your All-in-One AI-Powered Toolkit for Academic Success.
+13062052269
info@desklib.com
Available 24*7 on WhatsApp / Email
Unlock your academic potential
© 2024 | Zucol Services PVT LTD | All rights reserved.