Relative Valuation Model for AMCL Stock: A Financial Analysis Project
VerifiedAdded on 2022/09/26
|13
|2112
|18
Project
AI Summary
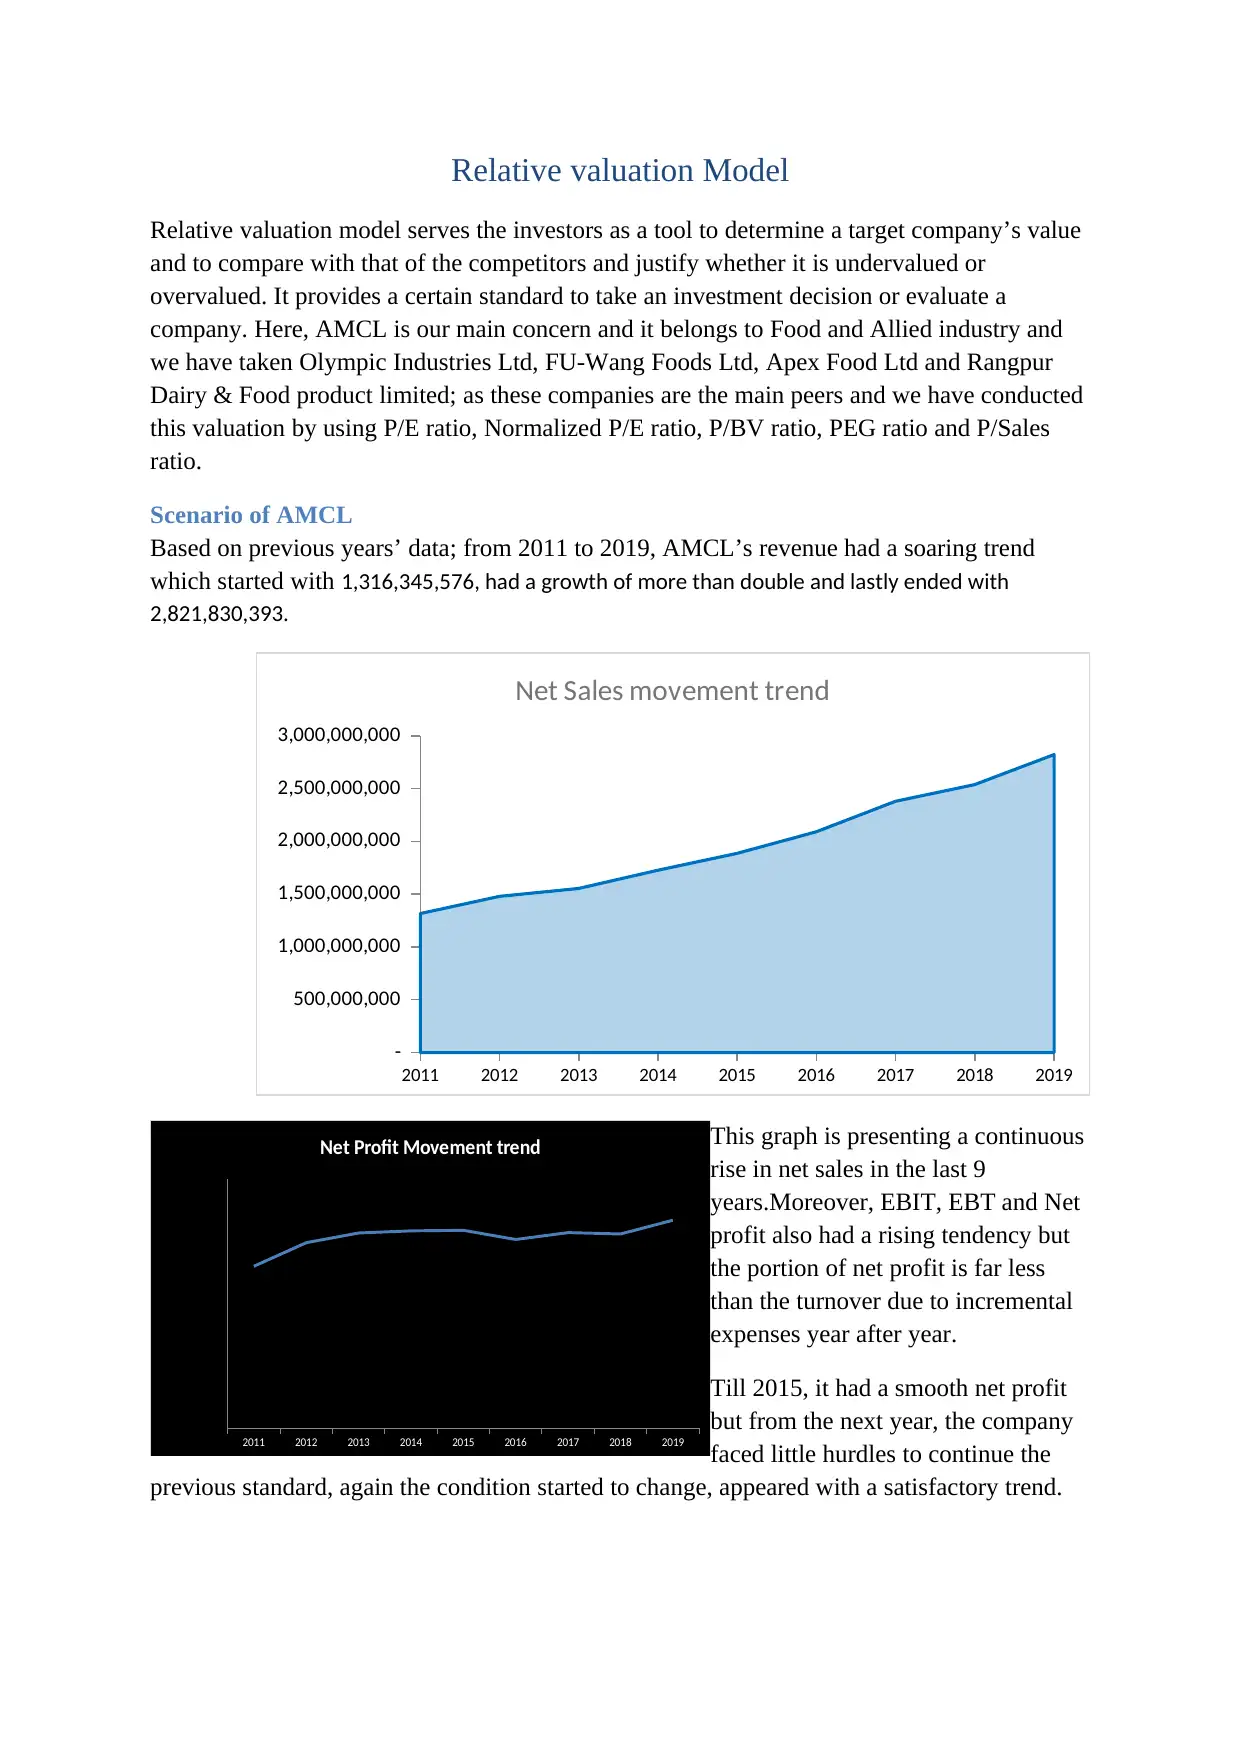
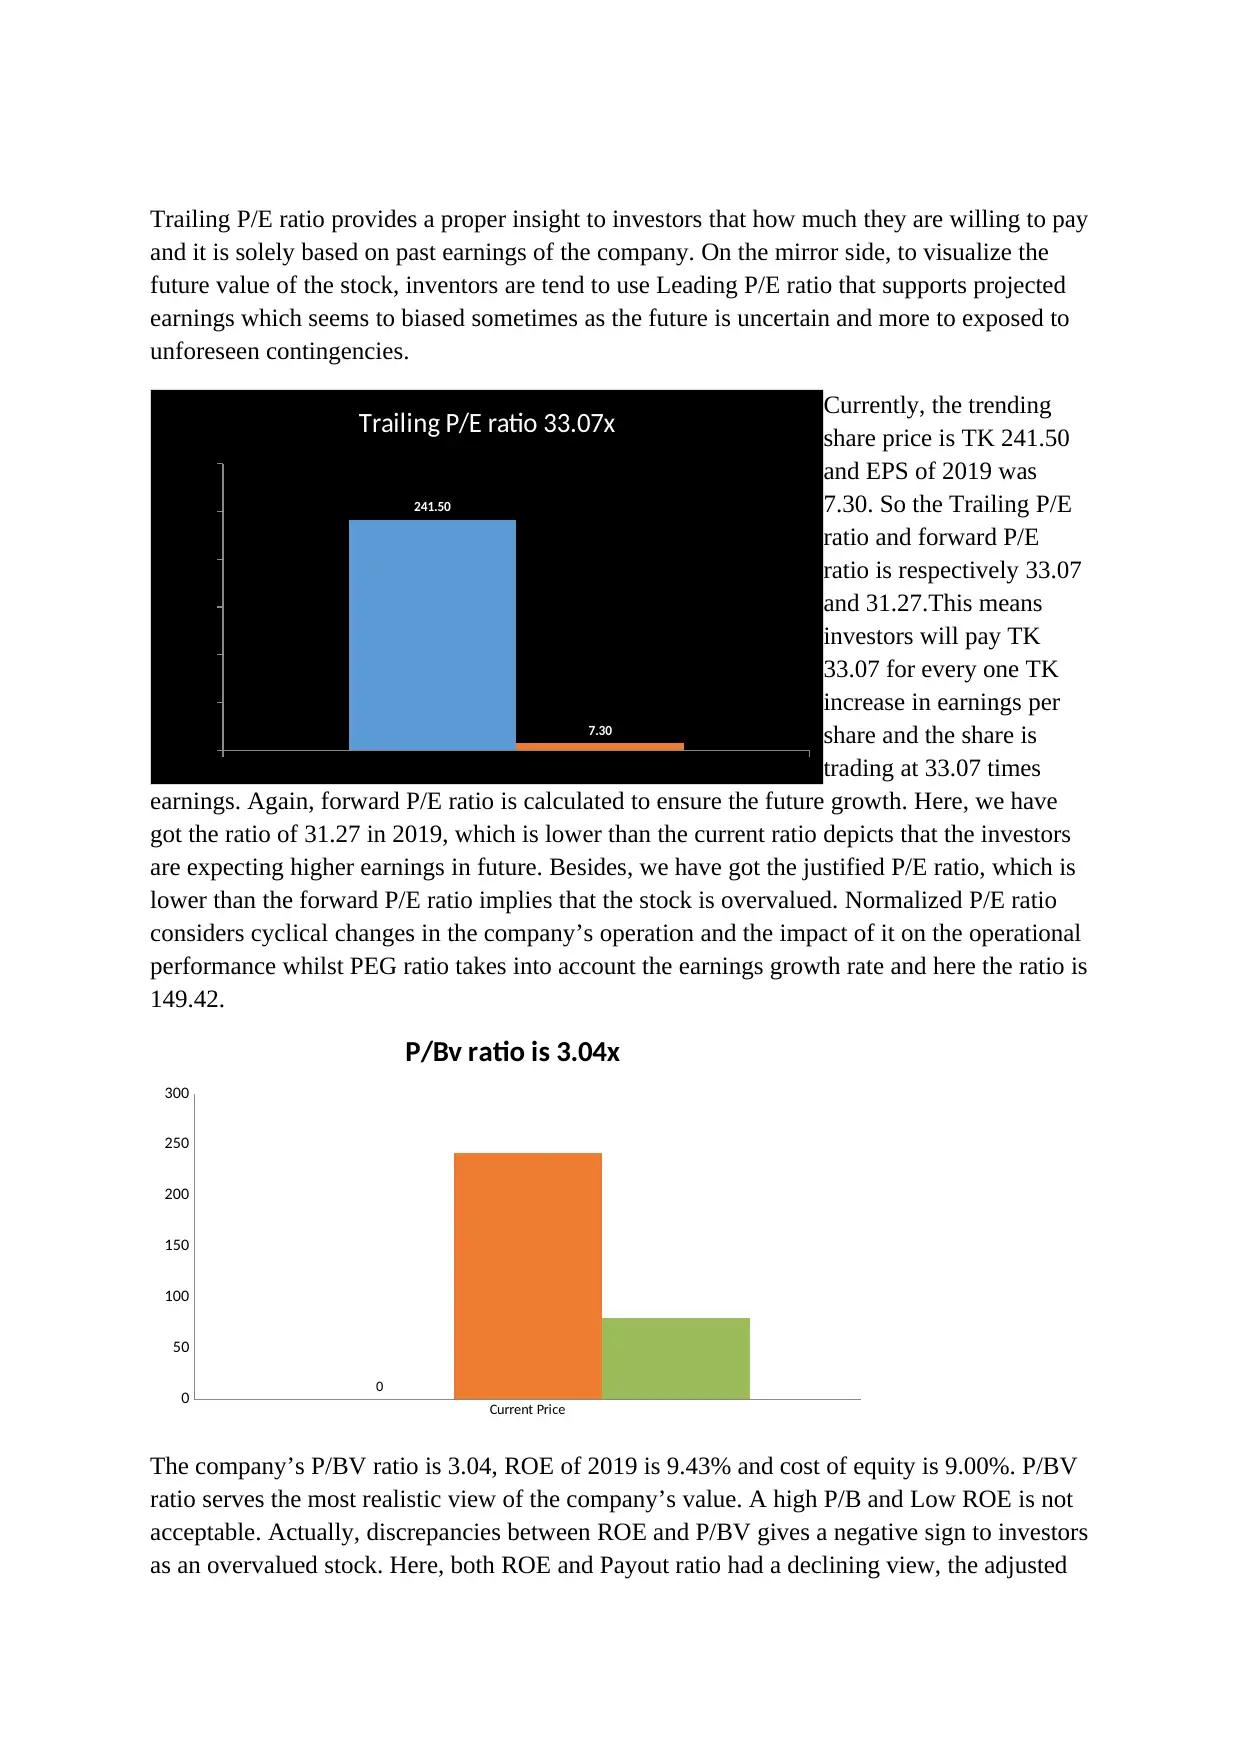
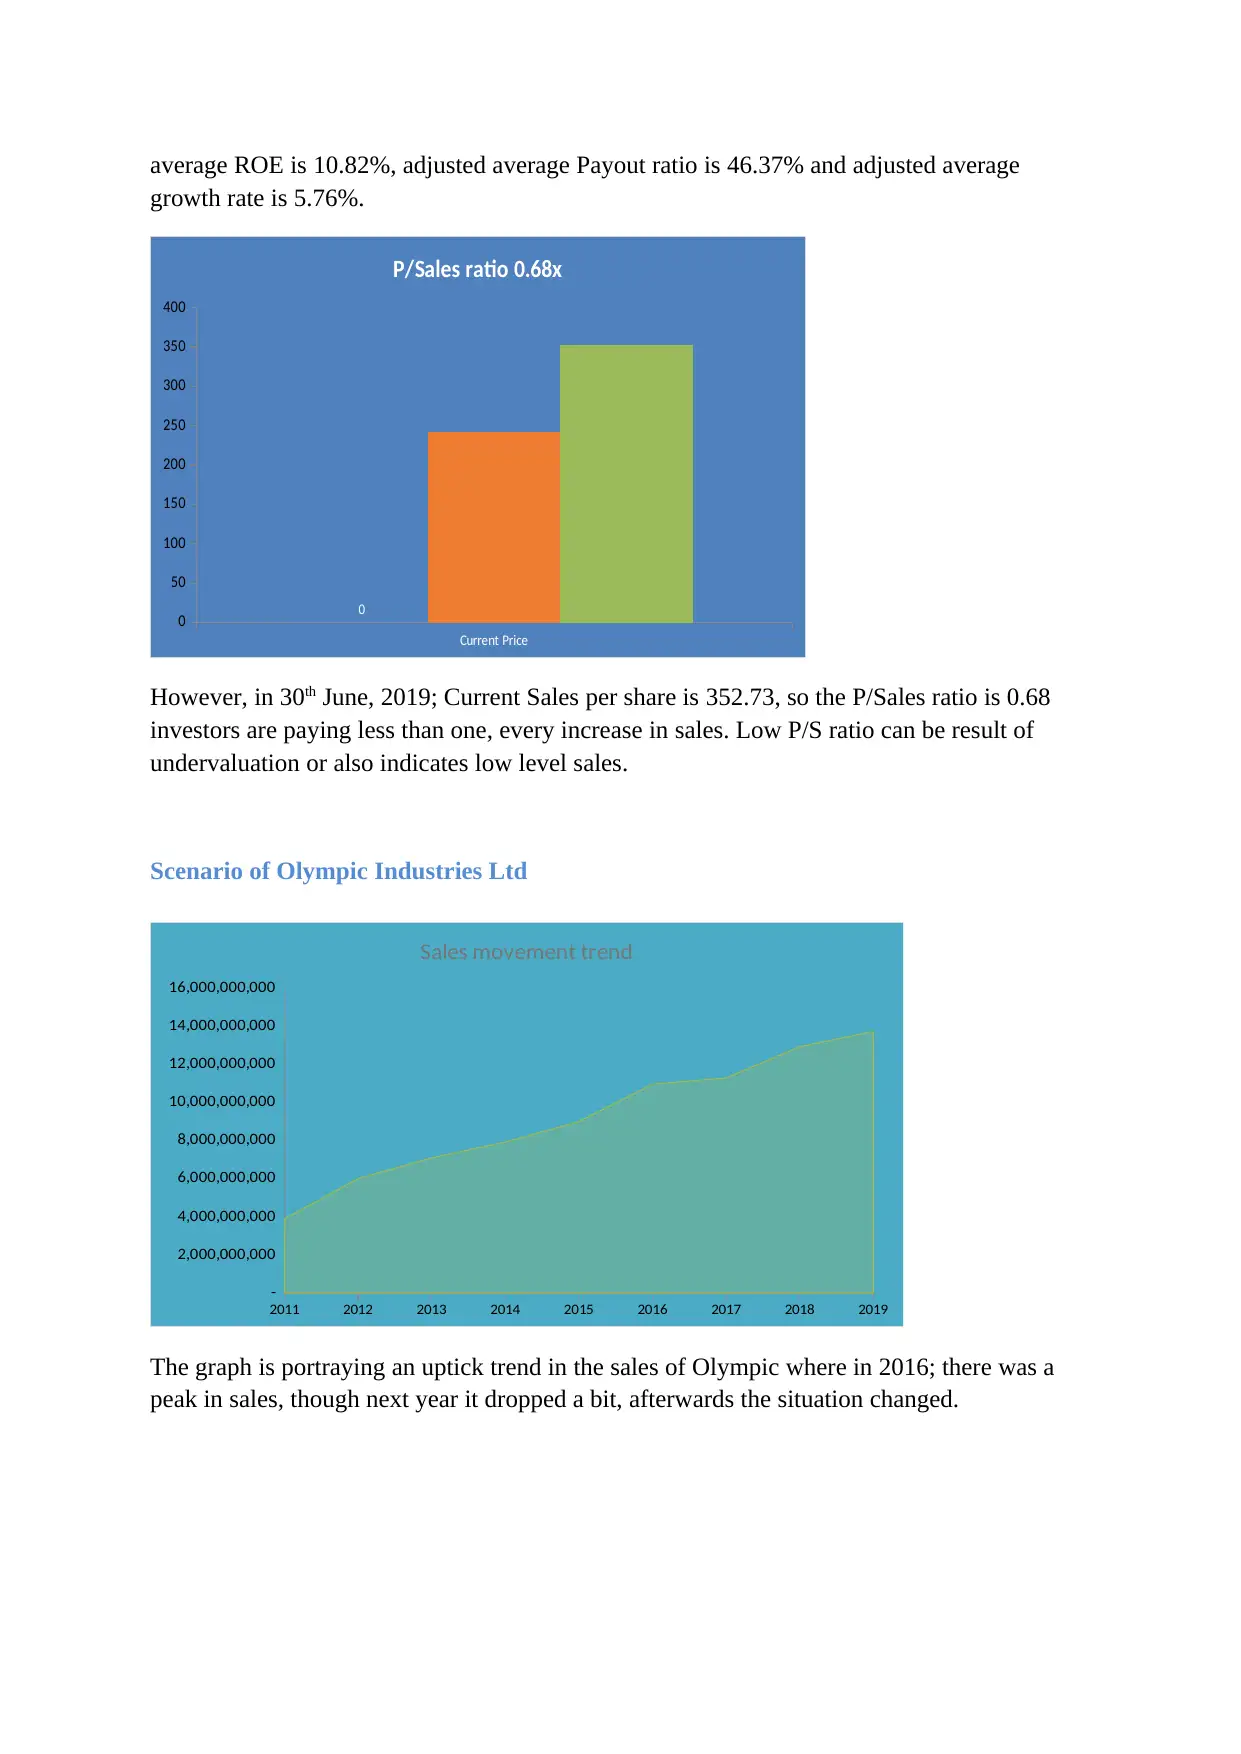
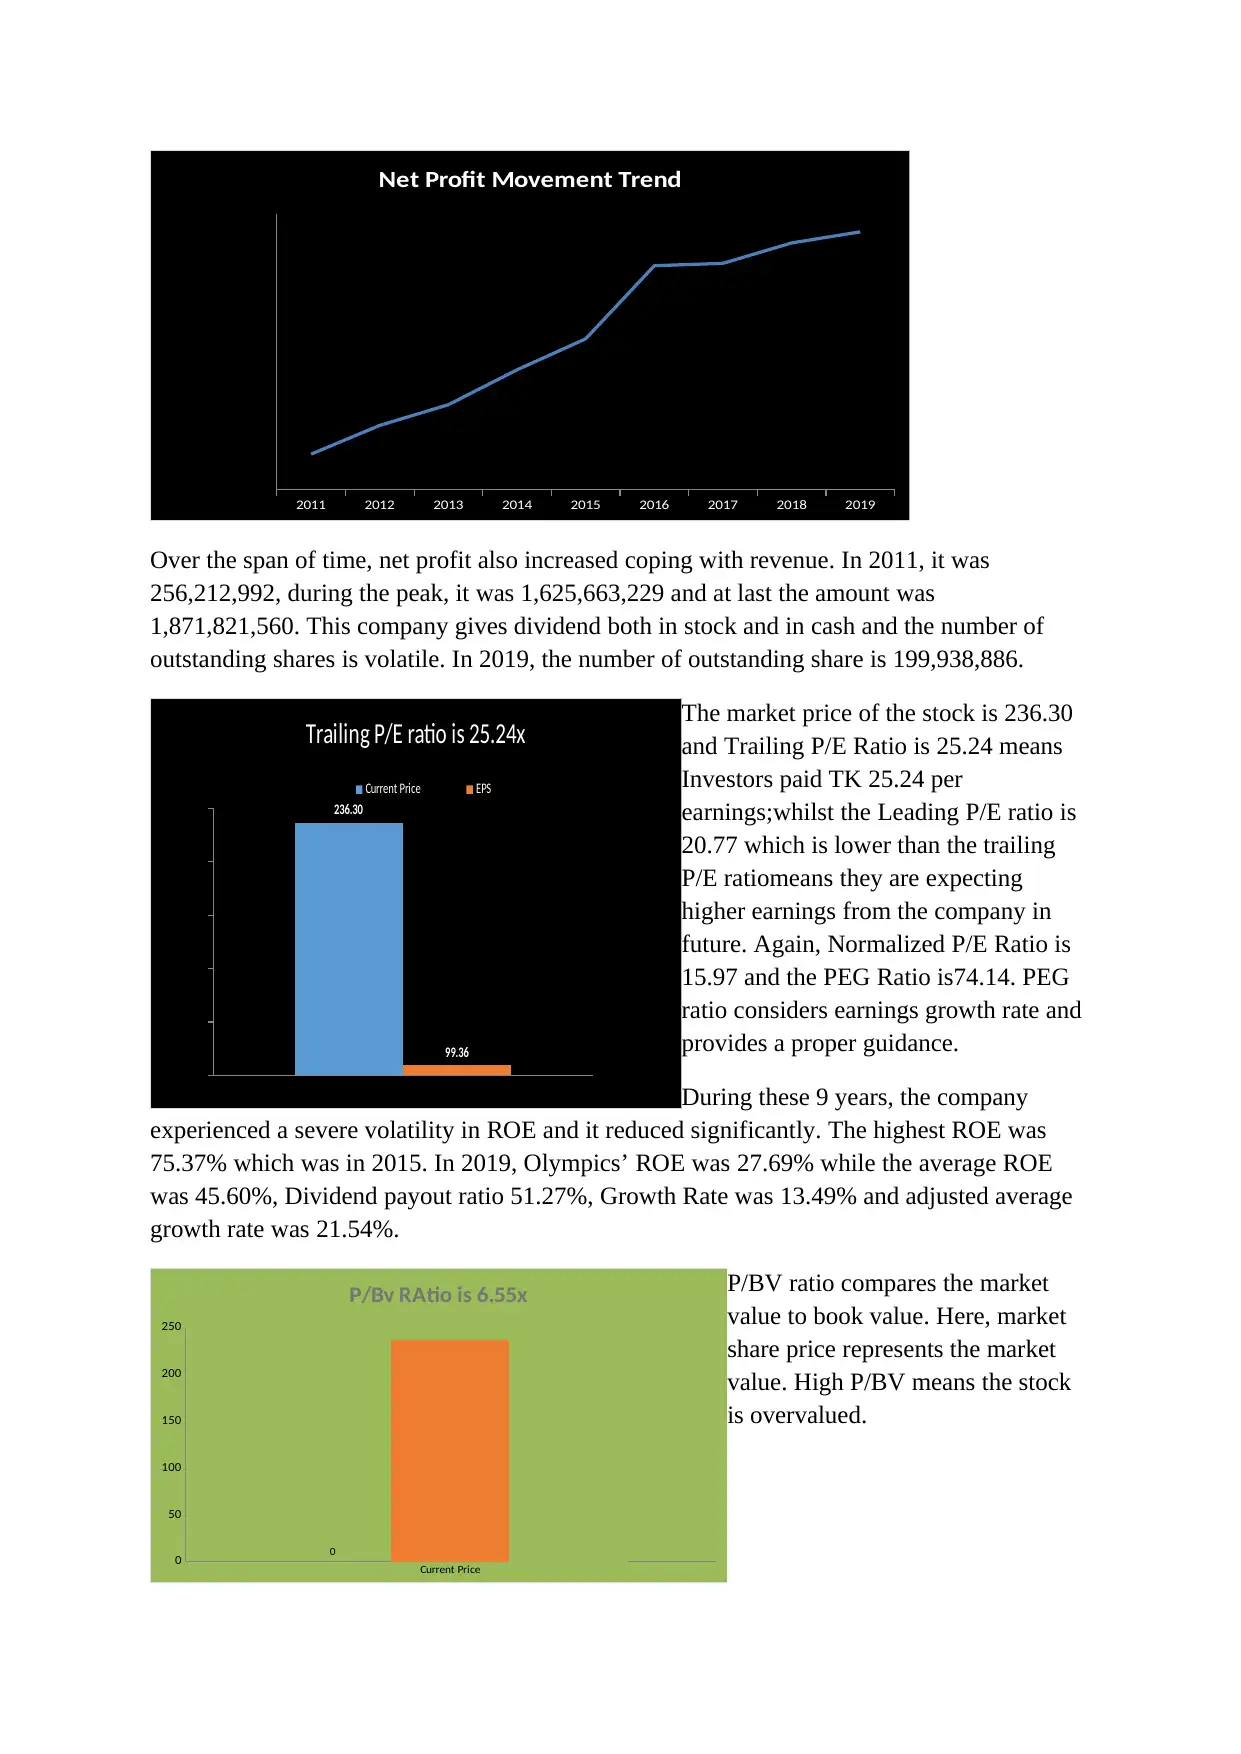
This project presents a relative valuation analysis of AMCL stock, a company in the Food and Allied industry, comparing it with key competitors including Olympic Industries Ltd, FU-Wang Foods Ltd, Apex Food Ltd, and Rangpur Dairy & Food product limited. The valuation utilizes several financial ratios such as P/E ratio, Normalized P/E ratio, P/BV ratio, PEG ratio, and P/Sales ratio, based on data from 2011 to 2019. The analysis includes detailed scenarios for each company, examining revenue, net profit, EPS, and other key metrics. The project assesses whether each stock is undervalued, overvalued, or fairly valued, considering factors like trailing and leading P/E ratios, ROE, and growth rates. The final conclusion suggests that AMCL is undervalued based on the P/E and P/Sales ratios, recommending a 'buy' strategy based on the potential for future price appreciation. The project provides a comprehensive overview of each company's financial performance, and a comparative analysis to inform investment decisions. The document highlights the importance of considering multiple valuation metrics and provides insights into the financial health and market performance of the selected companies.
1 out of 13
Related Documents


Your All-in-One AI-Powered Toolkit for Academic Success.
+13062052269
info@desklib.com
Available 24*7 on WhatsApp / Email
![[object Object]](/_next/static/media/star-bottom.7253800d.svg)
Copyright © 2020–2026 A2Z Services. All Rights Reserved. Developed and managed by ZUCOL.