Renewable Energy Systems: Electricity Generation, Solar Hot Water, Sun Path Diagram, Utilization Growth Rate, Bagasse Decline
VerifiedAdded on 2023/06/09
|9
|1587
|156
AI Summary
This article discusses the use of renewable energy systems in Australia, including the generation of electricity, solar hot water, and sun path diagrams. It also covers the growth rate of utilization and the decline of Bagasse. The article includes calculations and tables for better understanding.
Contribute Materials
Your contribution can guide someone’s learning journey. Share your
documents today.
Running head: RENEWABLE ENERGY SYSTEMS
RENEWABLE ENERGY SYSTEMS
Name of the Student
Name of the University
Author Note
RENEWABLE ENERGY SYSTEMS
Name of the Student
Name of the University
Author Note
Secure Best Marks with AI Grader
Need help grading? Try our AI Grader for instant feedback on your assignments.
1RENEWABLE ENERGY SYSTEMS
Problem 1: Renewable Energy and Australia’s Electricity Generation
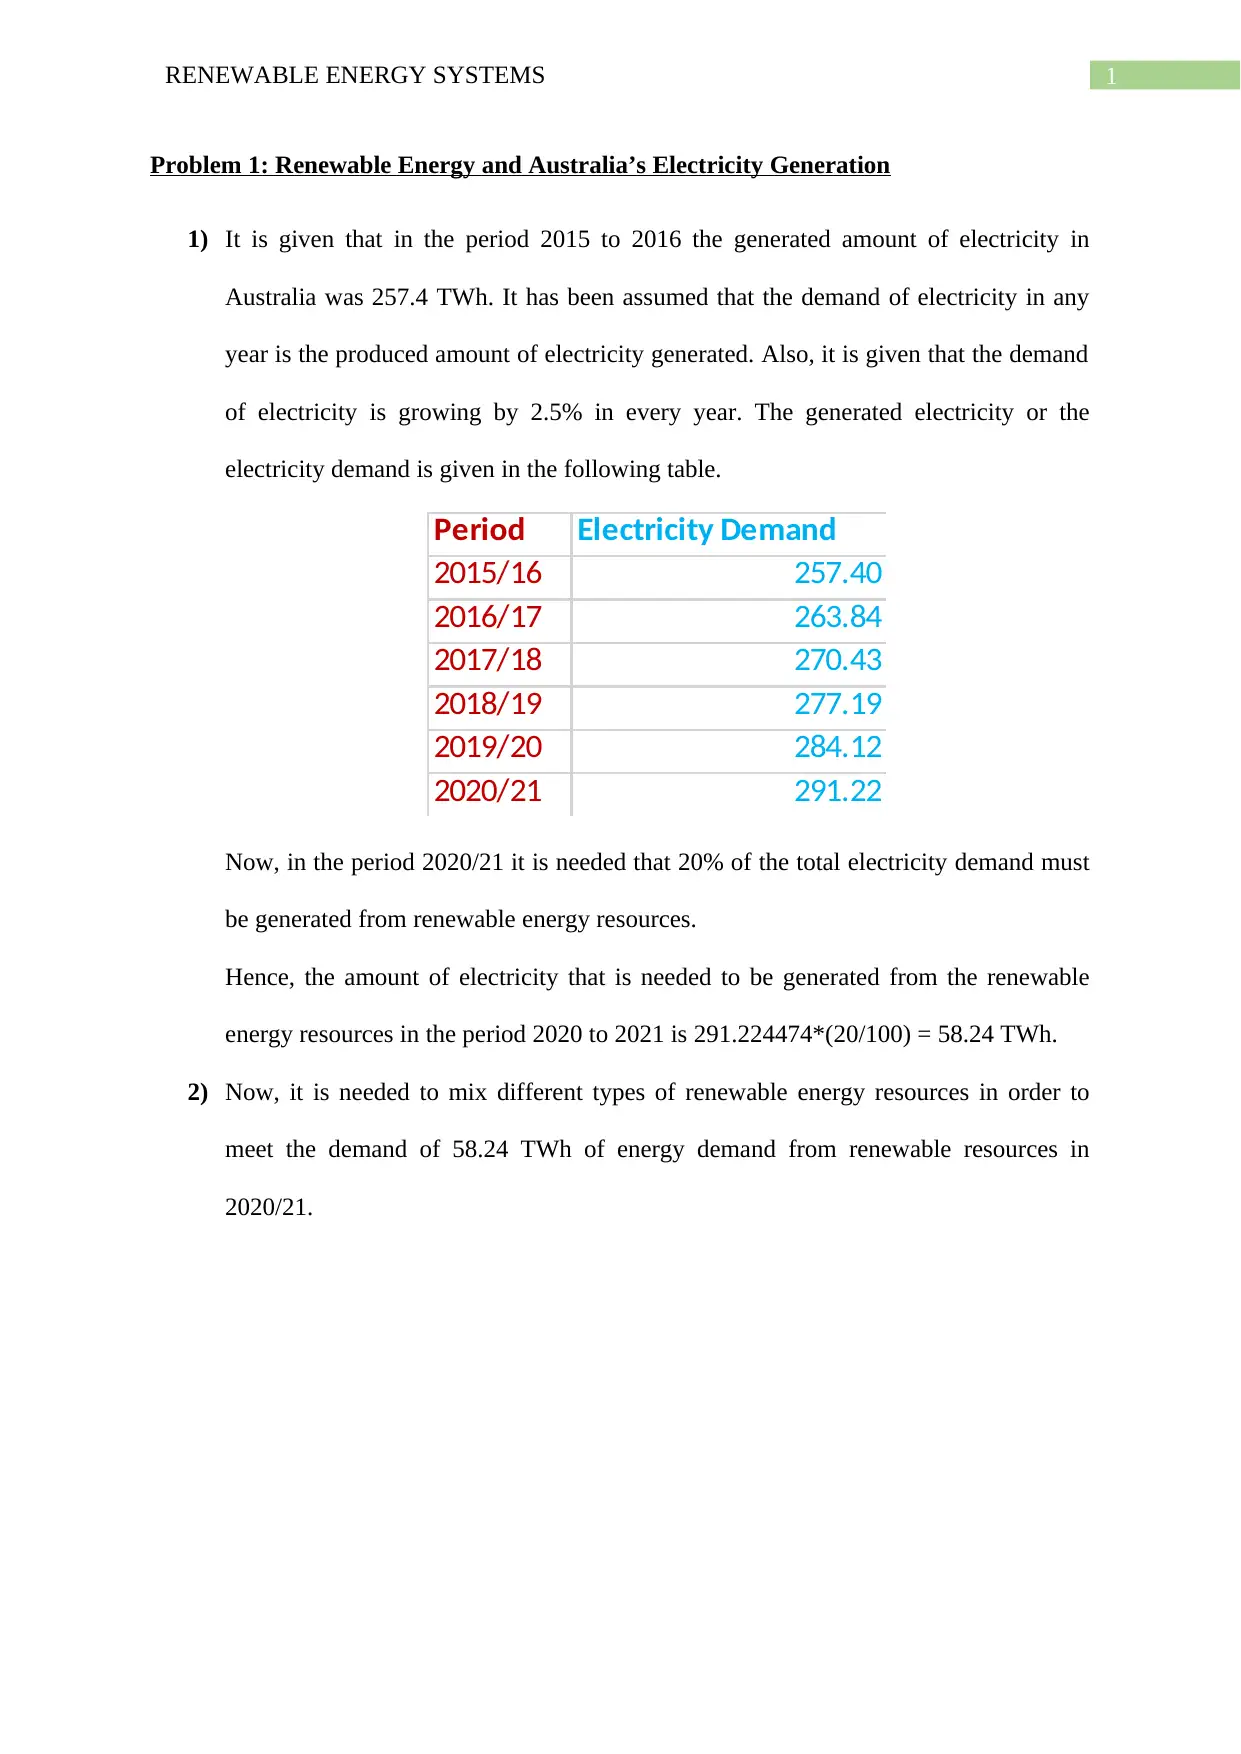
1) It is given that in the period 2015 to 2016 the generated amount of electricity in
Australia was 257.4 TWh. It has been assumed that the demand of electricity in any
year is the produced amount of electricity generated. Also, it is given that the demand
of electricity is growing by 2.5% in every year. The generated electricity or the
electricity demand is given in the following table.
Period Electricity Demand
2015/16 257.40
2016/17 263.84
2017/18 270.43
2018/19 277.19
2019/20 284.12
2020/21 291.22
Now, in the period 2020/21 it is needed that 20% of the total electricity demand must
be generated from renewable energy resources.
Hence, the amount of electricity that is needed to be generated from the renewable
energy resources in the period 2020 to 2021 is 291.224474*(20/100) = 58.24 TWh.
2) Now, it is needed to mix different types of renewable energy resources in order to
meet the demand of 58.24 TWh of energy demand from renewable resources in
2020/21.
Problem 1: Renewable Energy and Australia’s Electricity Generation
1) It is given that in the period 2015 to 2016 the generated amount of electricity in
Australia was 257.4 TWh. It has been assumed that the demand of electricity in any
year is the produced amount of electricity generated. Also, it is given that the demand
of electricity is growing by 2.5% in every year. The generated electricity or the
electricity demand is given in the following table.
Period Electricity Demand
2015/16 257.40
2016/17 263.84
2017/18 270.43
2018/19 277.19
2019/20 284.12
2020/21 291.22
Now, in the period 2020/21 it is needed that 20% of the total electricity demand must
be generated from renewable energy resources.
Hence, the amount of electricity that is needed to be generated from the renewable
energy resources in the period 2020 to 2021 is 291.224474*(20/100) = 58.24 TWh.
2) Now, it is needed to mix different types of renewable energy resources in order to
meet the demand of 58.24 TWh of energy demand from renewable resources in
2020/21.
2RENEWABLE ENERGY SYSTEMS
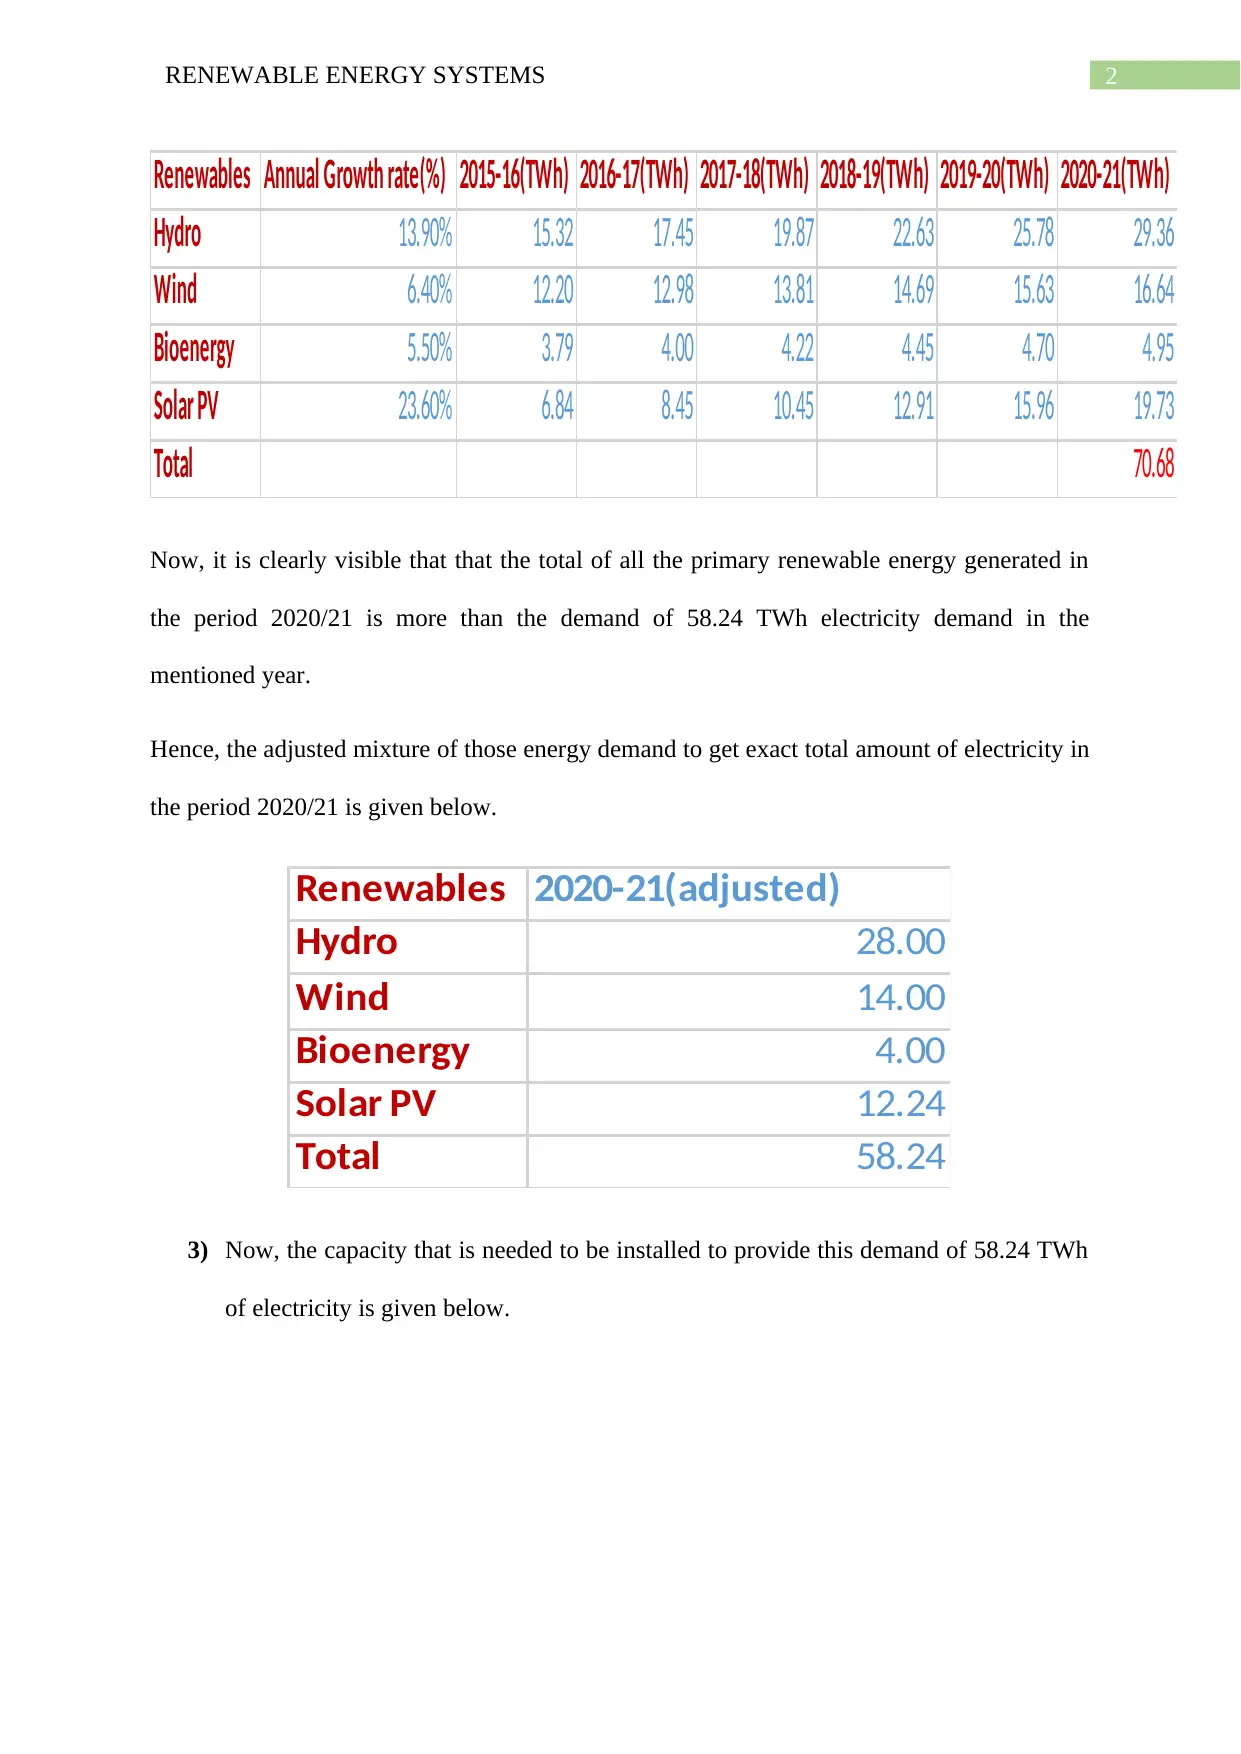
Renewables Annual Growth rate(%) 2015-16(TWh) 2016-17(TWh) 2017-18(TWh) 2018-19(TWh) 2019-20(TWh) 2020-21(TWh)
Hydro 13.90% 15.32 17.45 19.87 22.63 25.78 29.36
Wind 6.40% 12.20 12.98 13.81 14.69 15.63 16.64
Bioenergy 5.50% 3.79 4.00 4.22 4.45 4.70 4.95
Solar PV 23.60% 6.84 8.45 10.45 12.91 15.96 19.73
Total 70.68
Now, it is clearly visible that that the total of all the primary renewable energy generated in
the period 2020/21 is more than the demand of 58.24 TWh electricity demand in the
mentioned year.
Hence, the adjusted mixture of those energy demand to get exact total amount of electricity in
the period 2020/21 is given below.
Renewables 2020-21(adjusted)
Hydro 28.00
Wind 14.00
Bioenergy 4.00
Solar PV 12.24
Total 58.24
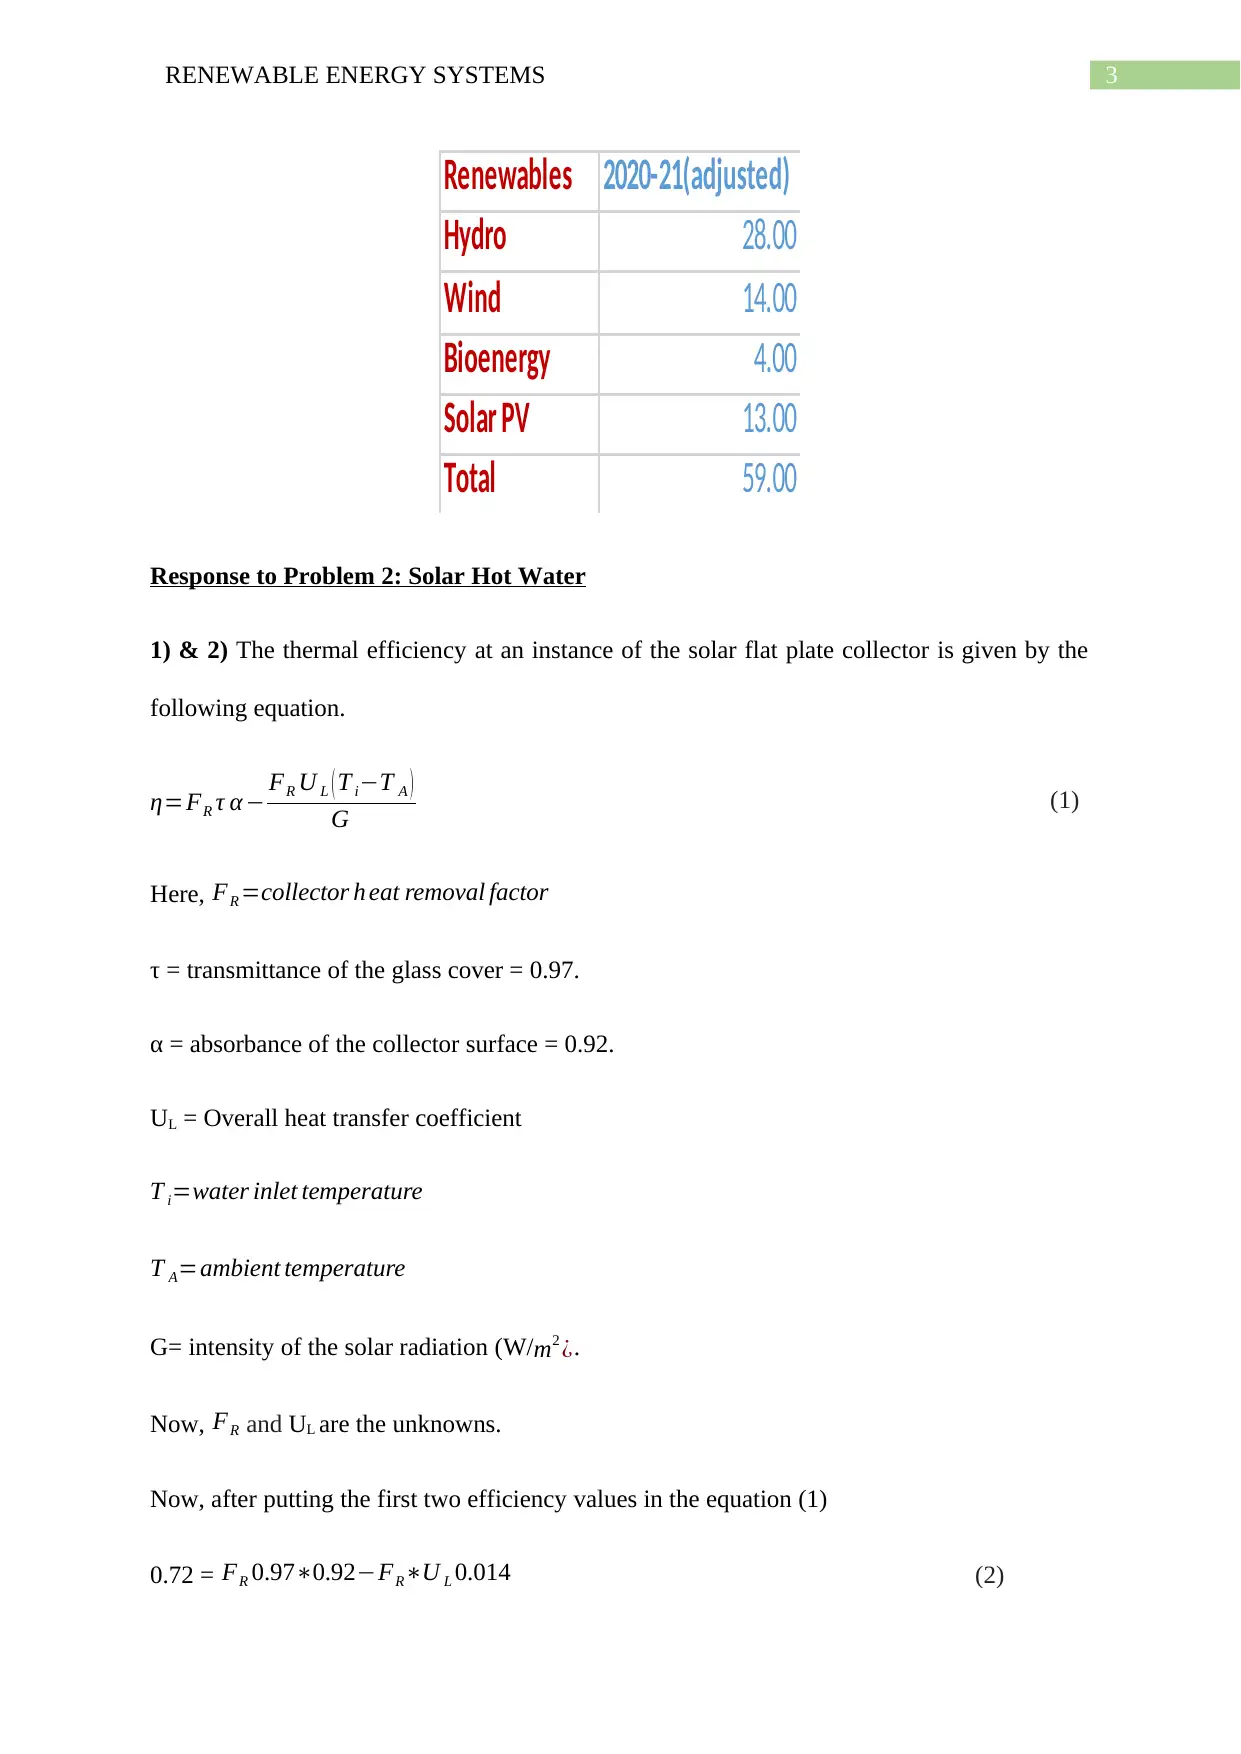
3) Now, the capacity that is needed to be installed to provide this demand of 58.24 TWh
of electricity is given below.
Renewables Annual Growth rate(%) 2015-16(TWh) 2016-17(TWh) 2017-18(TWh) 2018-19(TWh) 2019-20(TWh) 2020-21(TWh)
Hydro 13.90% 15.32 17.45 19.87 22.63 25.78 29.36
Wind 6.40% 12.20 12.98 13.81 14.69 15.63 16.64
Bioenergy 5.50% 3.79 4.00 4.22 4.45 4.70 4.95
Solar PV 23.60% 6.84 8.45 10.45 12.91 15.96 19.73
Total 70.68
Now, it is clearly visible that that the total of all the primary renewable energy generated in
the period 2020/21 is more than the demand of 58.24 TWh electricity demand in the
mentioned year.
Hence, the adjusted mixture of those energy demand to get exact total amount of electricity in
the period 2020/21 is given below.
Renewables 2020-21(adjusted)
Hydro 28.00
Wind 14.00
Bioenergy 4.00
Solar PV 12.24
Total 58.24
3) Now, the capacity that is needed to be installed to provide this demand of 58.24 TWh
of electricity is given below.
3RENEWABLE ENERGY SYSTEMS
Renewables 2020-21(adjusted)
Hydro 28.00
Wind 14.00
Bioenergy 4.00
Solar PV 13.00
Total 59.00
Response to Problem 2: Solar Hot Water
1) & 2) The thermal efficiency at an instance of the solar flat plate collector is given by the
following equation.
η=FR τ α − FR U L ( T i−T A )
G (1)
Here, FR =collector h eat removal factor
τ = transmittance of the glass cover = 0.97.
α = absorbance of the collector surface = 0.92.
UL = Overall heat transfer coefficient
T i=water inlet temperature
T A=ambient temperature
G= intensity of the solar radiation (W/ m2 ¿.
Now, FR and UL are the unknowns.
Now, after putting the first two efficiency values in the equation (1)
0.72 = FR 0.97∗0.92−FR∗U L 0.014 (2)
Secure Best Marks with AI Grader
Need help grading? Try our AI Grader for instant feedback on your assignments.
4RENEWABLE ENERGY SYSTEMS
0.71 = FR 0.97∗0.92−FR∗U L*0.0175 (3)
Now, from solving equations (2) and (3)
0.72
0.97∗0.92−U L 0.014 = 0.71
0.97∗0.92 – UL∗0.0175
0.6425−¿0.0126U L = 0.6336 – 0.00994U L
U L = 3.346 W
m2 K
Now, substitution of UL in equation (2) gives,
FR =0.72/(0.97∗0.92−3.346∗0.014) = 0.8515
So, the heat removal factor is 0.8515 and the overall heat transfer coefficient is 3.346
W
m2 K .
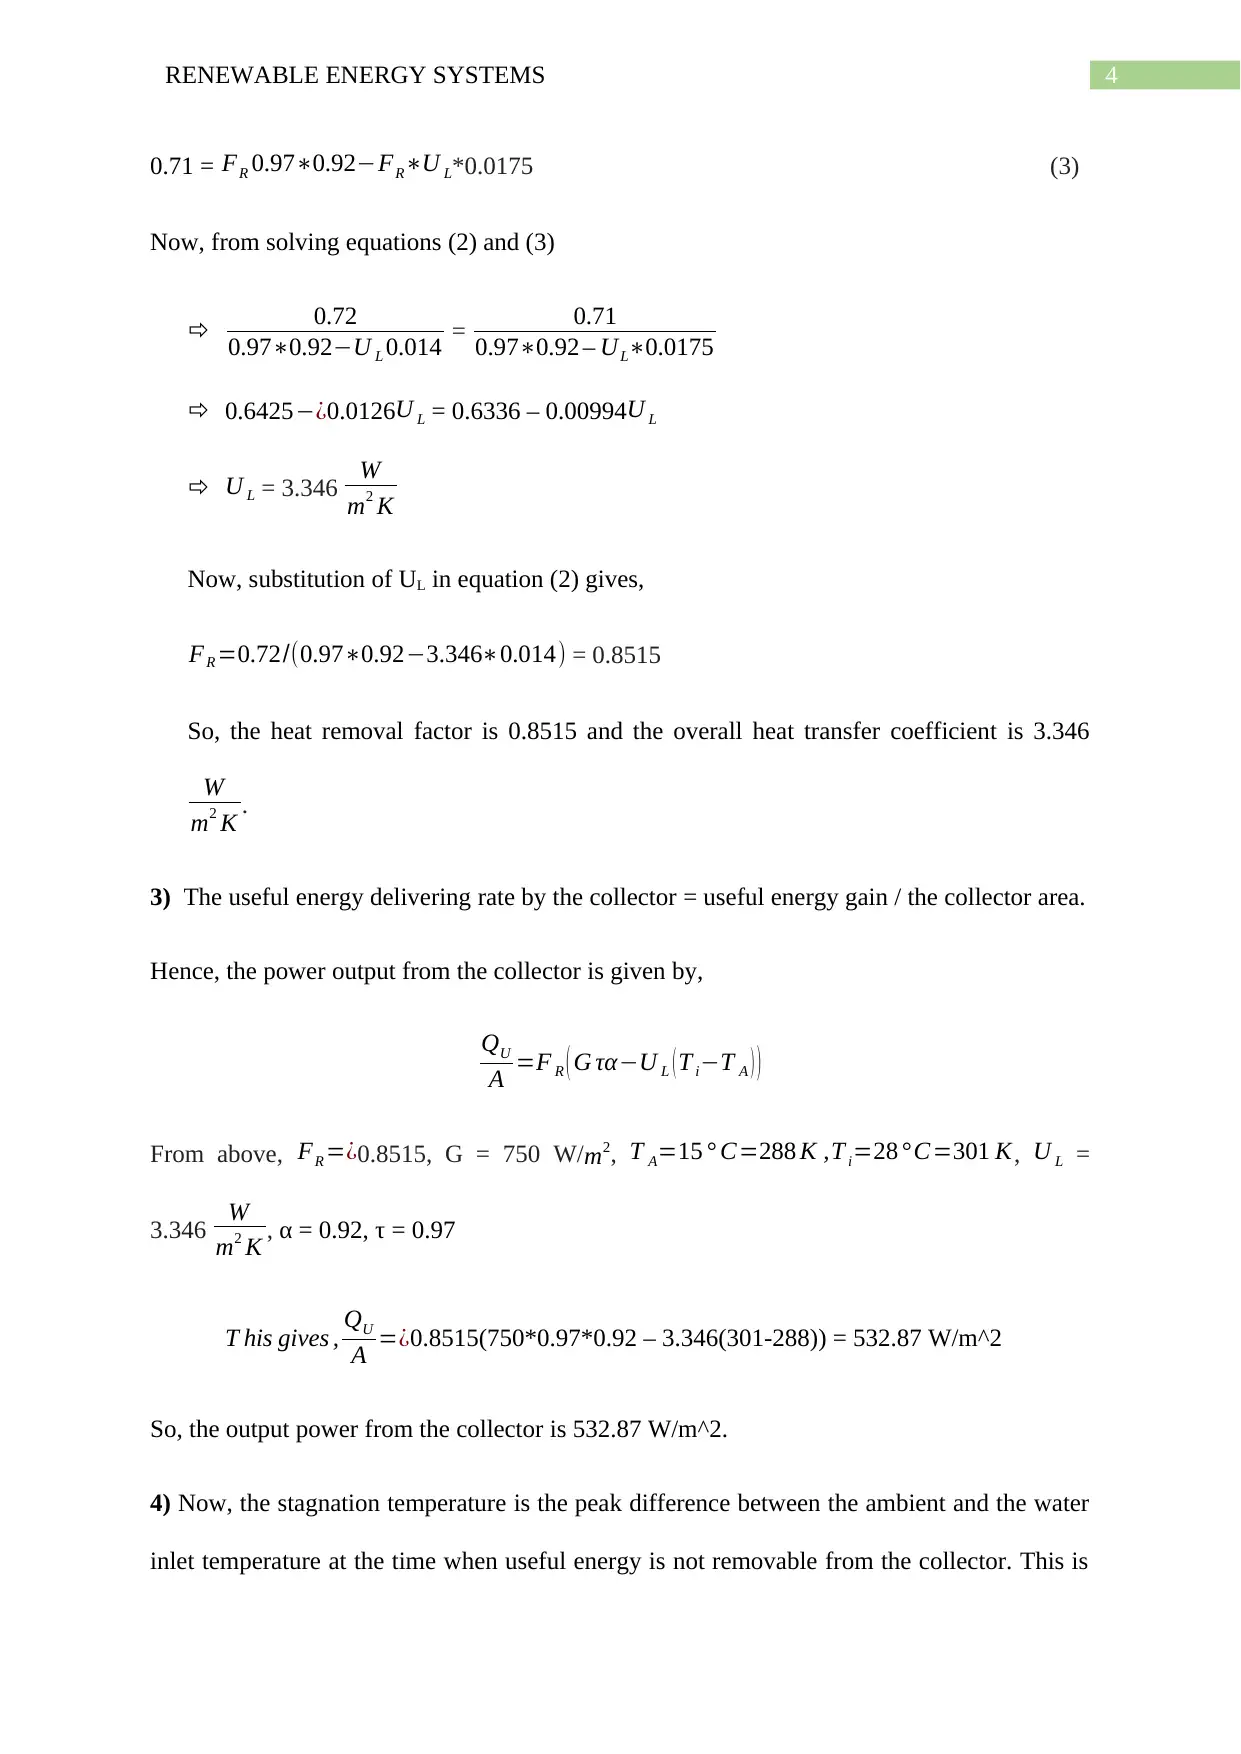
3) The useful energy delivering rate by the collector = useful energy gain / the collector area.
Hence, the power output from the collector is given by,
QU
A =F R ( G τα−U L ( T i−T A ) )
From above, FR =¿0.8515, G = 750 W/m2, T A=15 ° C=288 K ,T i=28 ° C=301 K, U L =
3.346 W
m2 K , α = 0.92, τ = 0.97
T his gives , QU
A =¿0.8515(750*0.97*0.92 – 3.346(301-288)) = 532.87 W/m^2
So, the output power from the collector is 532.87 W/m^2.
4) Now, the stagnation temperature is the peak difference between the ambient and the water
inlet temperature at the time when useful energy is not removable from the collector. This is
0.71 = FR 0.97∗0.92−FR∗U L*0.0175 (3)
Now, from solving equations (2) and (3)
0.72
0.97∗0.92−U L 0.014 = 0.71
0.97∗0.92 – UL∗0.0175
0.6425−¿0.0126U L = 0.6336 – 0.00994U L
U L = 3.346 W
m2 K
Now, substitution of UL in equation (2) gives,
FR =0.72/(0.97∗0.92−3.346∗0.014) = 0.8515
So, the heat removal factor is 0.8515 and the overall heat transfer coefficient is 3.346
W
m2 K .
3) The useful energy delivering rate by the collector = useful energy gain / the collector area.
Hence, the power output from the collector is given by,
QU
A =F R ( G τα−U L ( T i−T A ) )
From above, FR =¿0.8515, G = 750 W/m2, T A=15 ° C=288 K ,T i=28 ° C=301 K, U L =
3.346 W
m2 K , α = 0.92, τ = 0.97
T his gives , QU
A =¿0.8515(750*0.97*0.92 – 3.346(301-288)) = 532.87 W/m^2
So, the output power from the collector is 532.87 W/m^2.
4) Now, the stagnation temperature is the peak difference between the ambient and the water
inlet temperature at the time when useful energy is not removable from the collector. This is
5RENEWABLE ENERGY SYSTEMS
given by the intercept of the Efficiency vs ( Ti −T A )
G curve with the ( Ti −T A )
G axis. Now as per
the situation of the question (3) 28-15 = 13 ° Cis the stagnation temperature.
Response to problem 3:
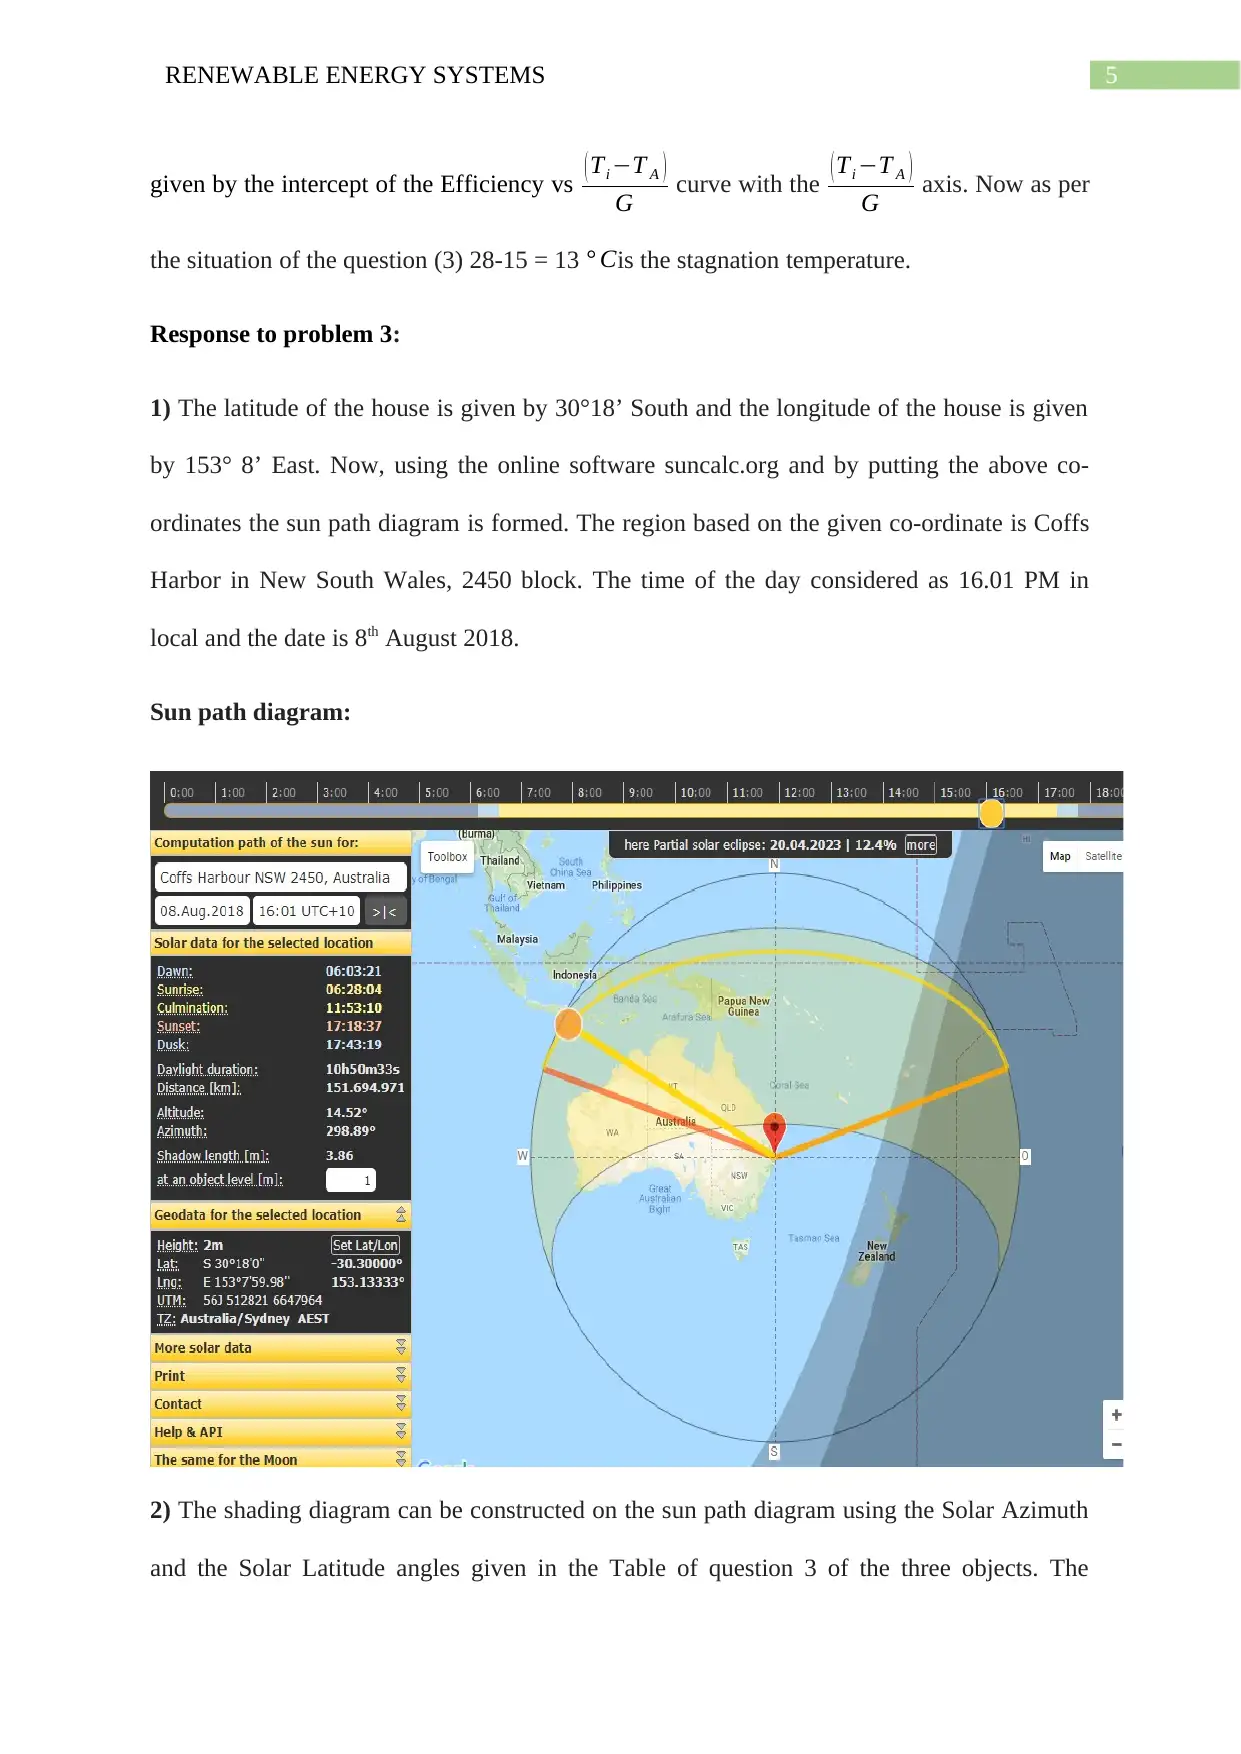
1) The latitude of the house is given by 30°18’ South and the longitude of the house is given
by 153° 8’ East. Now, using the online software suncalc.org and by putting the above co-
ordinates the sun path diagram is formed. The region based on the given co-ordinate is Coffs
Harbor in New South Wales, 2450 block. The time of the day considered as 16.01 PM in
local and the date is 8th August 2018.
Sun path diagram:
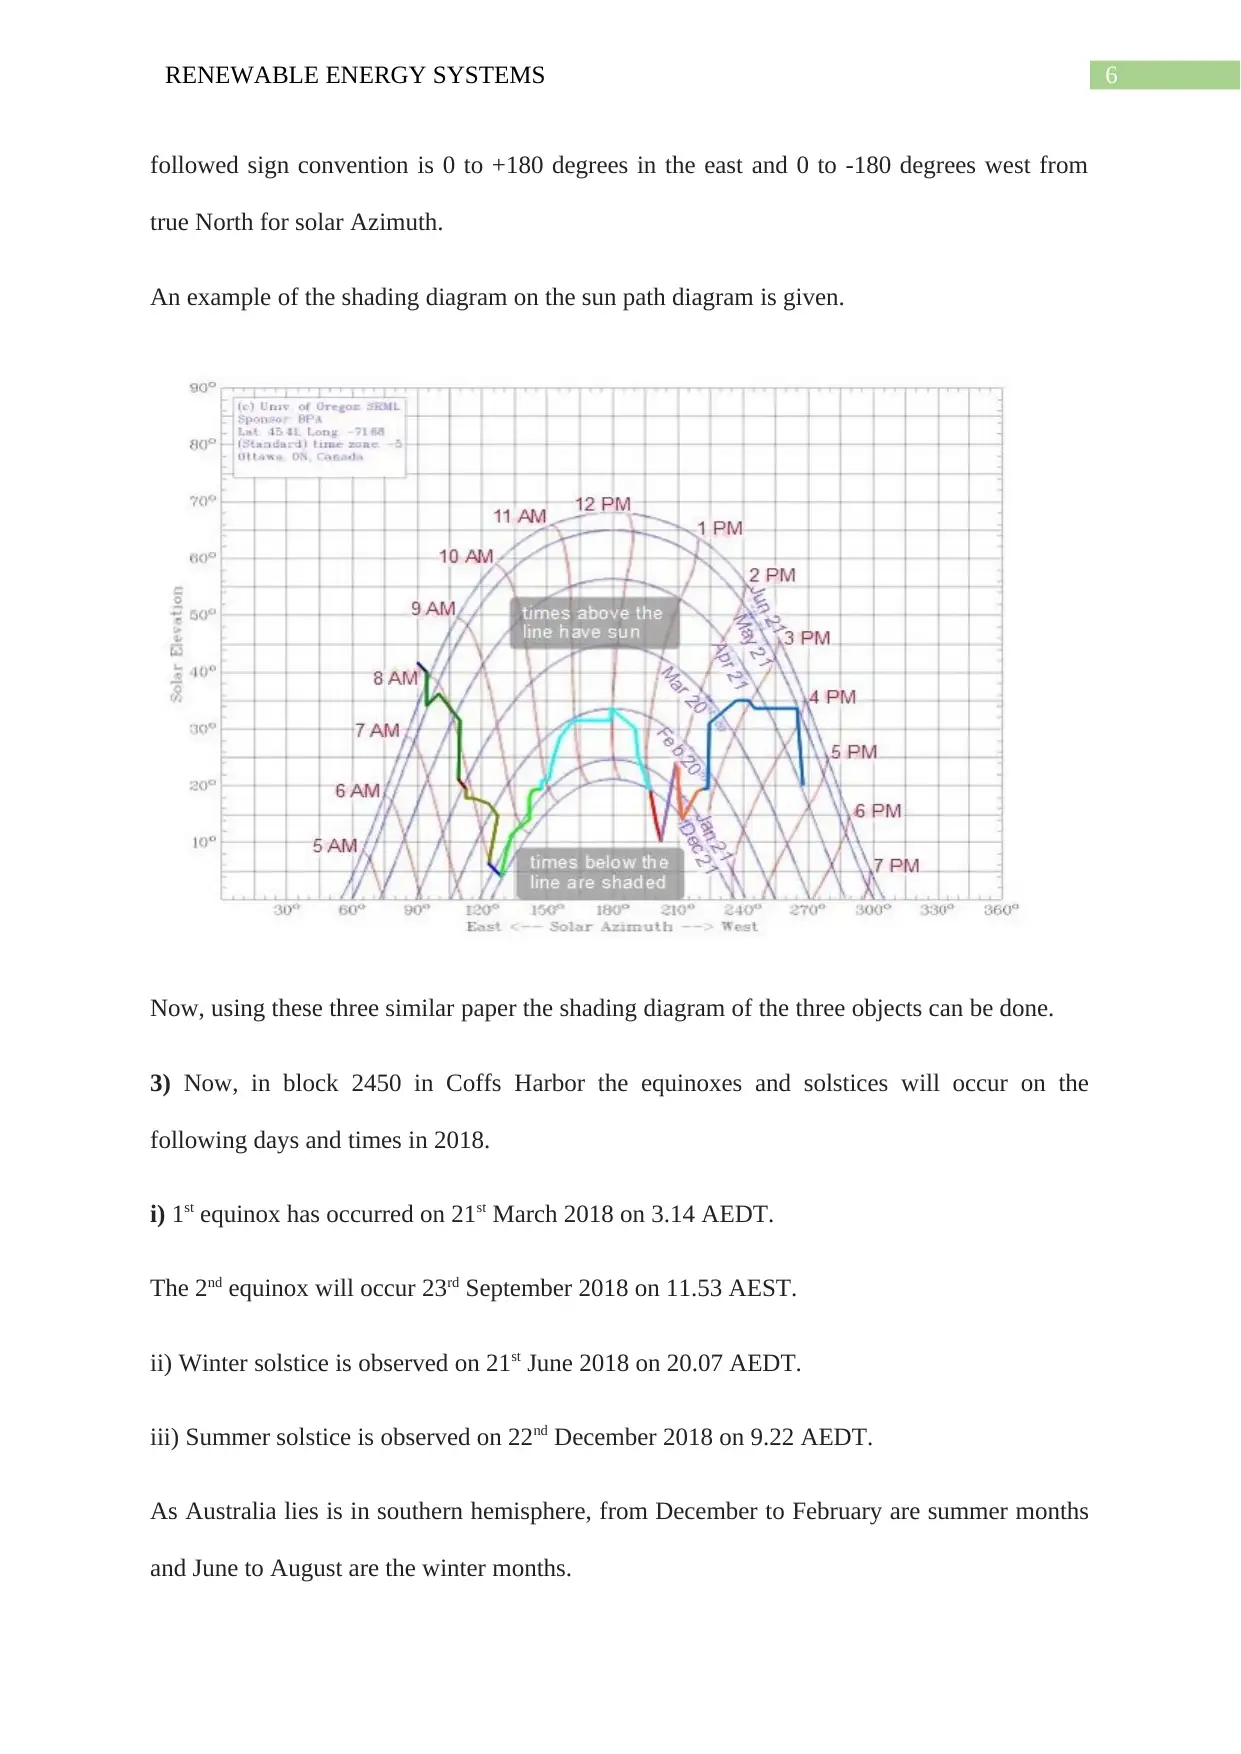
2) The shading diagram can be constructed on the sun path diagram using the Solar Azimuth
and the Solar Latitude angles given in the Table of question 3 of the three objects. The
given by the intercept of the Efficiency vs ( Ti −T A )
G curve with the ( Ti −T A )
G axis. Now as per
the situation of the question (3) 28-15 = 13 ° Cis the stagnation temperature.
Response to problem 3:
1) The latitude of the house is given by 30°18’ South and the longitude of the house is given
by 153° 8’ East. Now, using the online software suncalc.org and by putting the above co-
ordinates the sun path diagram is formed. The region based on the given co-ordinate is Coffs
Harbor in New South Wales, 2450 block. The time of the day considered as 16.01 PM in
local and the date is 8th August 2018.
Sun path diagram:
2) The shading diagram can be constructed on the sun path diagram using the Solar Azimuth
and the Solar Latitude angles given in the Table of question 3 of the three objects. The
6RENEWABLE ENERGY SYSTEMS
followed sign convention is 0 to +180 degrees in the east and 0 to -180 degrees west from
true North for solar Azimuth.
An example of the shading diagram on the sun path diagram is given.
Now, using these three similar paper the shading diagram of the three objects can be done.
3) Now, in block 2450 in Coffs Harbor the equinoxes and solstices will occur on the
following days and times in 2018.
i) 1st equinox has occurred on 21st March 2018 on 3.14 AEDT.
The 2nd equinox will occur 23rd September 2018 on 11.53 AEST.
ii) Winter solstice is observed on 21st June 2018 on 20.07 AEDT.
iii) Summer solstice is observed on 22nd December 2018 on 9.22 AEDT.
As Australia lies is in southern hemisphere, from December to February are summer months
and June to August are the winter months.
Paraphrase This Document
Need a fresh take? Get an instant paraphrase of this document with our AI Paraphraser
7RENEWABLE ENERGY SYSTEMS
Response to problem 4:
1) The given table of Question 4 shows that the major or the most amount of renewable
energy resource that were used in the period 2012-13 is Bagasse. The energy which was
produced from resource Bagasse is 95.3 PJ.
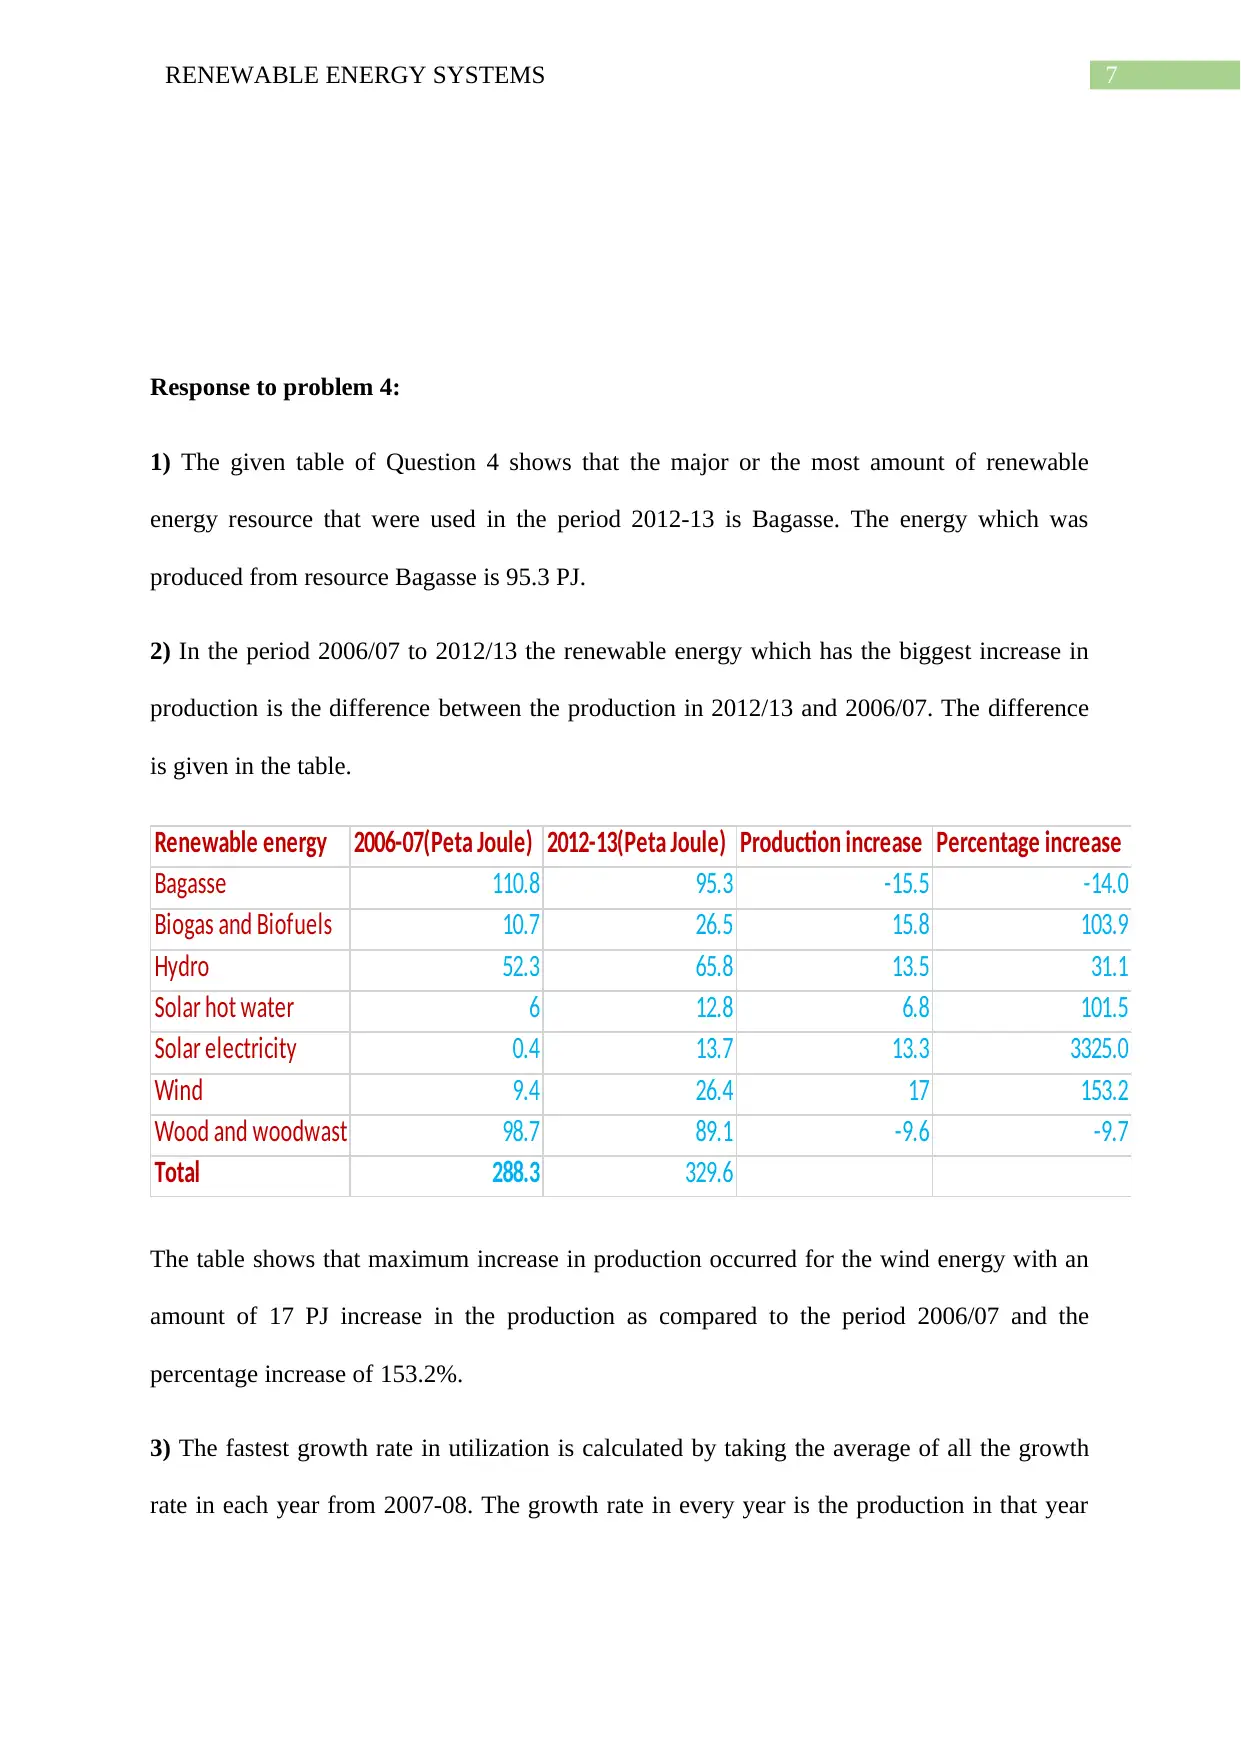
2) In the period 2006/07 to 2012/13 the renewable energy which has the biggest increase in
production is the difference between the production in 2012/13 and 2006/07. The difference
is given in the table.
Renewable energy 2006-07(Peta Joule) 2012-13(Peta Joule) Production increase Percentage increase
Bagasse 110.8 95.3 -15.5 -14.0
Biogas and Biofuels 10.7 26.5 15.8 103.9
Hydro 52.3 65.8 13.5 31.1
Solar hot water 6 12.8 6.8 101.5
Solar electricity 0.4 13.7 13.3 3325.0
Wind 9.4 26.4 17 153.2
Wood and woodwaste 98.7 89.1 -9.6 -9.7
Total 288.3 329.6
The table shows that maximum increase in production occurred for the wind energy with an
amount of 17 PJ increase in the production as compared to the period 2006/07 and the
percentage increase of 153.2%.
3) The fastest growth rate in utilization is calculated by taking the average of all the growth
rate in each year from 2007-08. The growth rate in every year is the production in that year
Response to problem 4:
1) The given table of Question 4 shows that the major or the most amount of renewable
energy resource that were used in the period 2012-13 is Bagasse. The energy which was
produced from resource Bagasse is 95.3 PJ.
2) In the period 2006/07 to 2012/13 the renewable energy which has the biggest increase in
production is the difference between the production in 2012/13 and 2006/07. The difference
is given in the table.
Renewable energy 2006-07(Peta Joule) 2012-13(Peta Joule) Production increase Percentage increase
Bagasse 110.8 95.3 -15.5 -14.0
Biogas and Biofuels 10.7 26.5 15.8 103.9
Hydro 52.3 65.8 13.5 31.1
Solar hot water 6 12.8 6.8 101.5
Solar electricity 0.4 13.7 13.3 3325.0
Wind 9.4 26.4 17 153.2
Wood and woodwaste 98.7 89.1 -9.6 -9.7
Total 288.3 329.6
The table shows that maximum increase in production occurred for the wind energy with an
amount of 17 PJ increase in the production as compared to the period 2006/07 and the
percentage increase of 153.2%.
3) The fastest growth rate in utilization is calculated by taking the average of all the growth
rate in each year from 2007-08. The growth rate in every year is the production in that year
8RENEWABLE ENERGY SYSTEMS
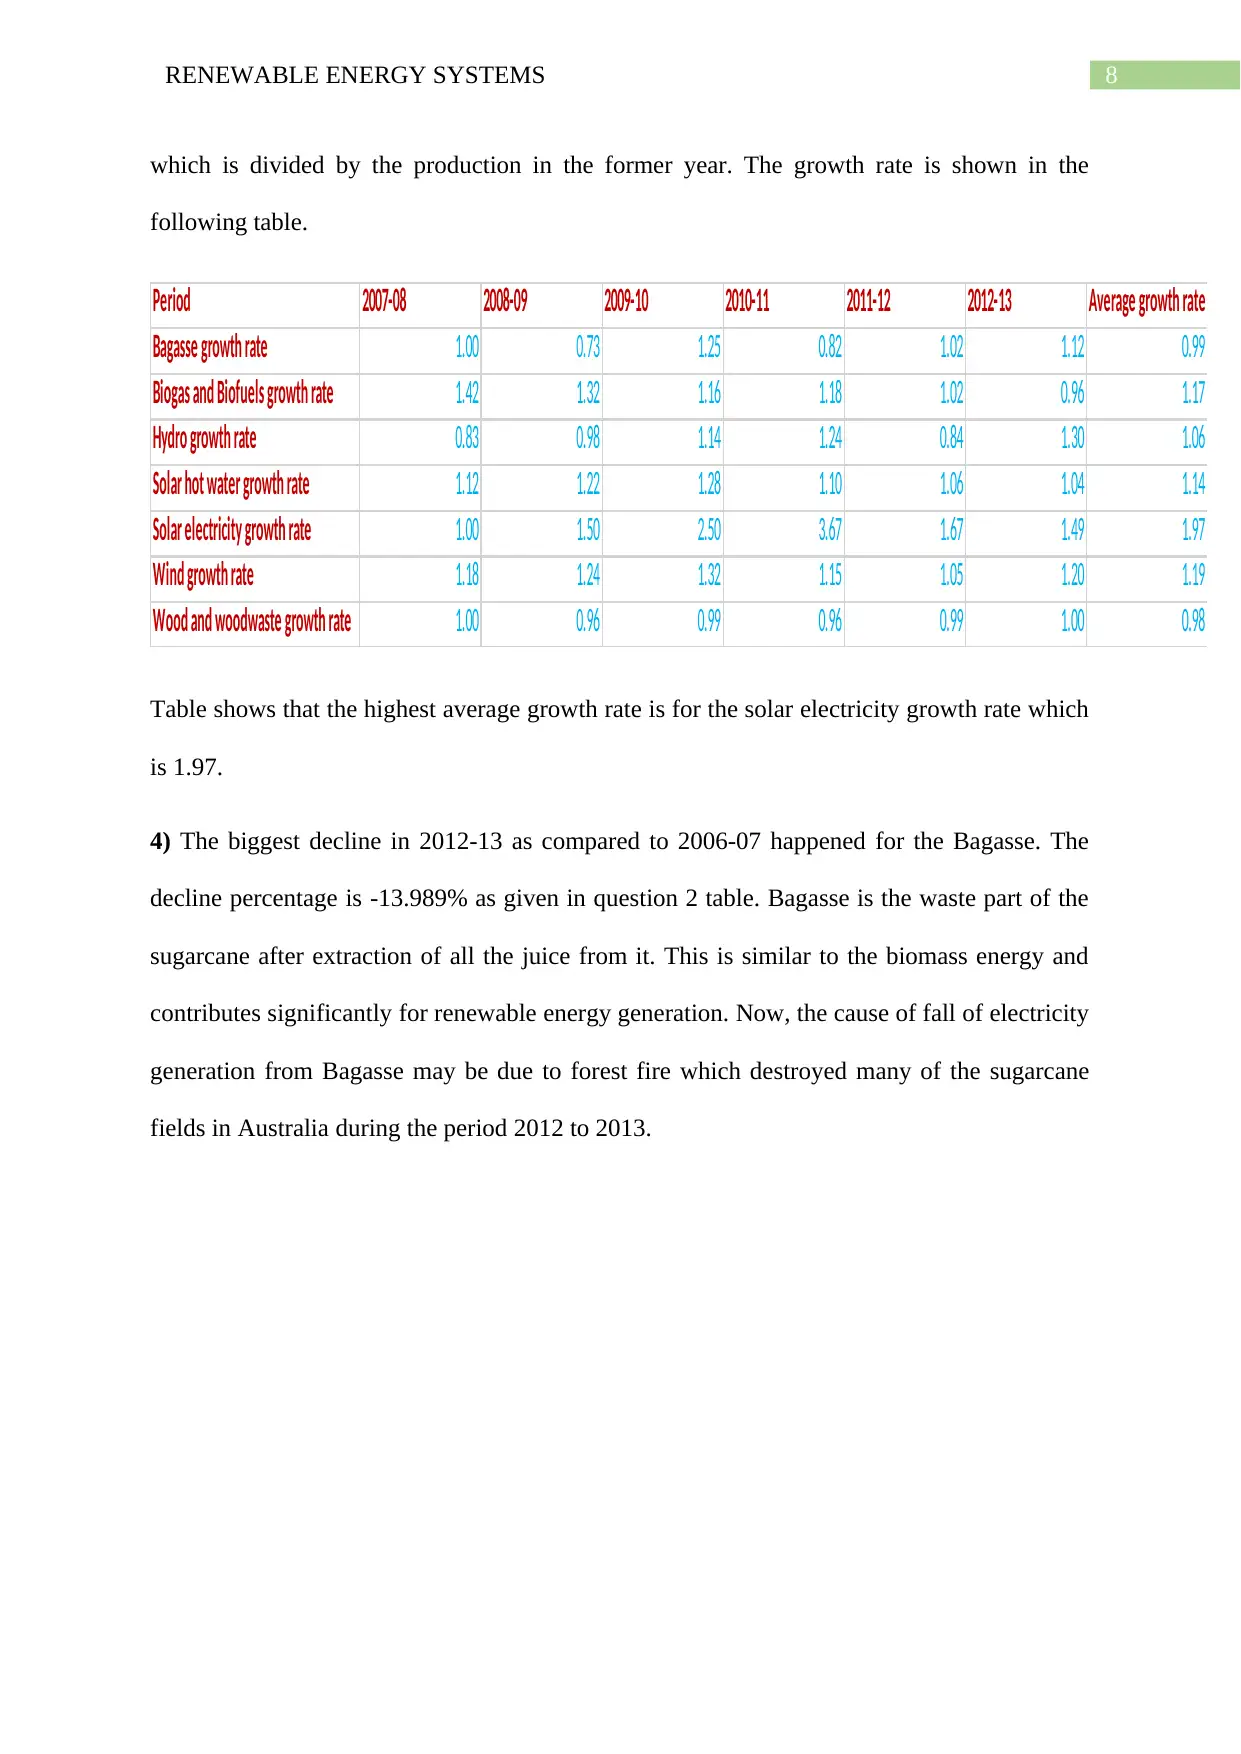
which is divided by the production in the former year. The growth rate is shown in the
following table.
Period 2007-08 2008-09 2009-10 2010-11 2011-12 2012-13 Average growth rate
Bagasse growth rate 1.00 0.73 1.25 0.82 1.02 1.12 0.99
Biogas and Biofuels growth rate 1.42 1.32 1.16 1.18 1.02 0.96 1.17
Hydro growth rate 0.83 0.98 1.14 1.24 0.84 1.30 1.06
Solar hot water growth rate 1.12 1.22 1.28 1.10 1.06 1.04 1.14
Solar electricity growth rate 1.00 1.50 2.50 3.67 1.67 1.49 1.97
Wind growth rate 1.18 1.24 1.32 1.15 1.05 1.20 1.19
Wood and woodwaste growth rate 1.00 0.96 0.99 0.96 0.99 1.00 0.98
Table shows that the highest average growth rate is for the solar electricity growth rate which
is 1.97.
4) The biggest decline in 2012-13 as compared to 2006-07 happened for the Bagasse. The
decline percentage is -13.989% as given in question 2 table. Bagasse is the waste part of the
sugarcane after extraction of all the juice from it. This is similar to the biomass energy and
contributes significantly for renewable energy generation. Now, the cause of fall of electricity
generation from Bagasse may be due to forest fire which destroyed many of the sugarcane
fields in Australia during the period 2012 to 2013.
1 out of 9

Your All-in-One AI-Powered Toolkit for Academic Success.
+13062052269
info@desklib.com
Available 24*7 on WhatsApp / Email
![[object Object]](/_next/static/media/star-bottom.7253800d.svg)
Unlock your academic potential
© 2024 | Zucol Services PVT LTD | All rights reserved.