Are Lipid Profiles and Obesity Risk Factors for SSNHL?
VerifiedAdded on 2023/04/07
|10
|2280
|279
AI Summary
This report explores the relationship between lipid profiles, obesity, and the prevalence of Sudden Sensorineural Hearing Loss (SSNHL). It discusses the findings of a study conducted on SSNHL patients and control subjects, highlighting the impact of high cholesterol and triglyceride levels on the condition. The report also examines the role of obesity as a risk factor for SSNHL.
Contribute Materials
Your contribution can guide someone’s learning journey. Share your
documents today.
Running head: REPORT ASSIGNMENT 1
Computer Lab 7: Are Lipid Profiles and Obesity Risk Factors for SSNHL?
By (Name of Student)
(Institutional Affiliation)
(Date of Submission)
Instructions for Make-up Report Assignment (optional)
Introduction
Sudden Sensorineural Hearing Loss (SSNHL) is a
condition affecting the inner ear that is defined as
hearing loss of more than 30 decibels on three
consecutive frequencies over three days. The
cause of the disease is currently unknown,
though a promising theory is impairment
of micro- vascular circulation to the
cochlea, an organ of the inner ear. This
1. Read the outline for this report assignment.
2. During the lab session, perform the analyses needed to address the main question and the specific
research questions in R Studio, using what you have learned in previous labs.
3. Carefully look at the model report and check list (grading rubric) to see what type of report is
expected.
4. Write a report of your study (ca. 2 pages plus up to 3 figures or tables, word limit 800 – 1200
words, see check list).
5. Save your file in MS Word format (.doc or docx) and give it the following name:
MakeupReport_Utorid.doc, where you substitute your Utor-ID for “Utorid”.
6. Submit your file on Quercus > Assignments > Make-up Report.
Deadline: Mon March 25, end of day.
7. A grace period of 1 week (April 1) applies. If the assignment is handed in after grace period, it
will not be marked.
Secure Best Marks with AI Grader
Need help grading? Try our AI Grader for instant feedback on your assignments.
2
REPORT ASSIGNMNET 2
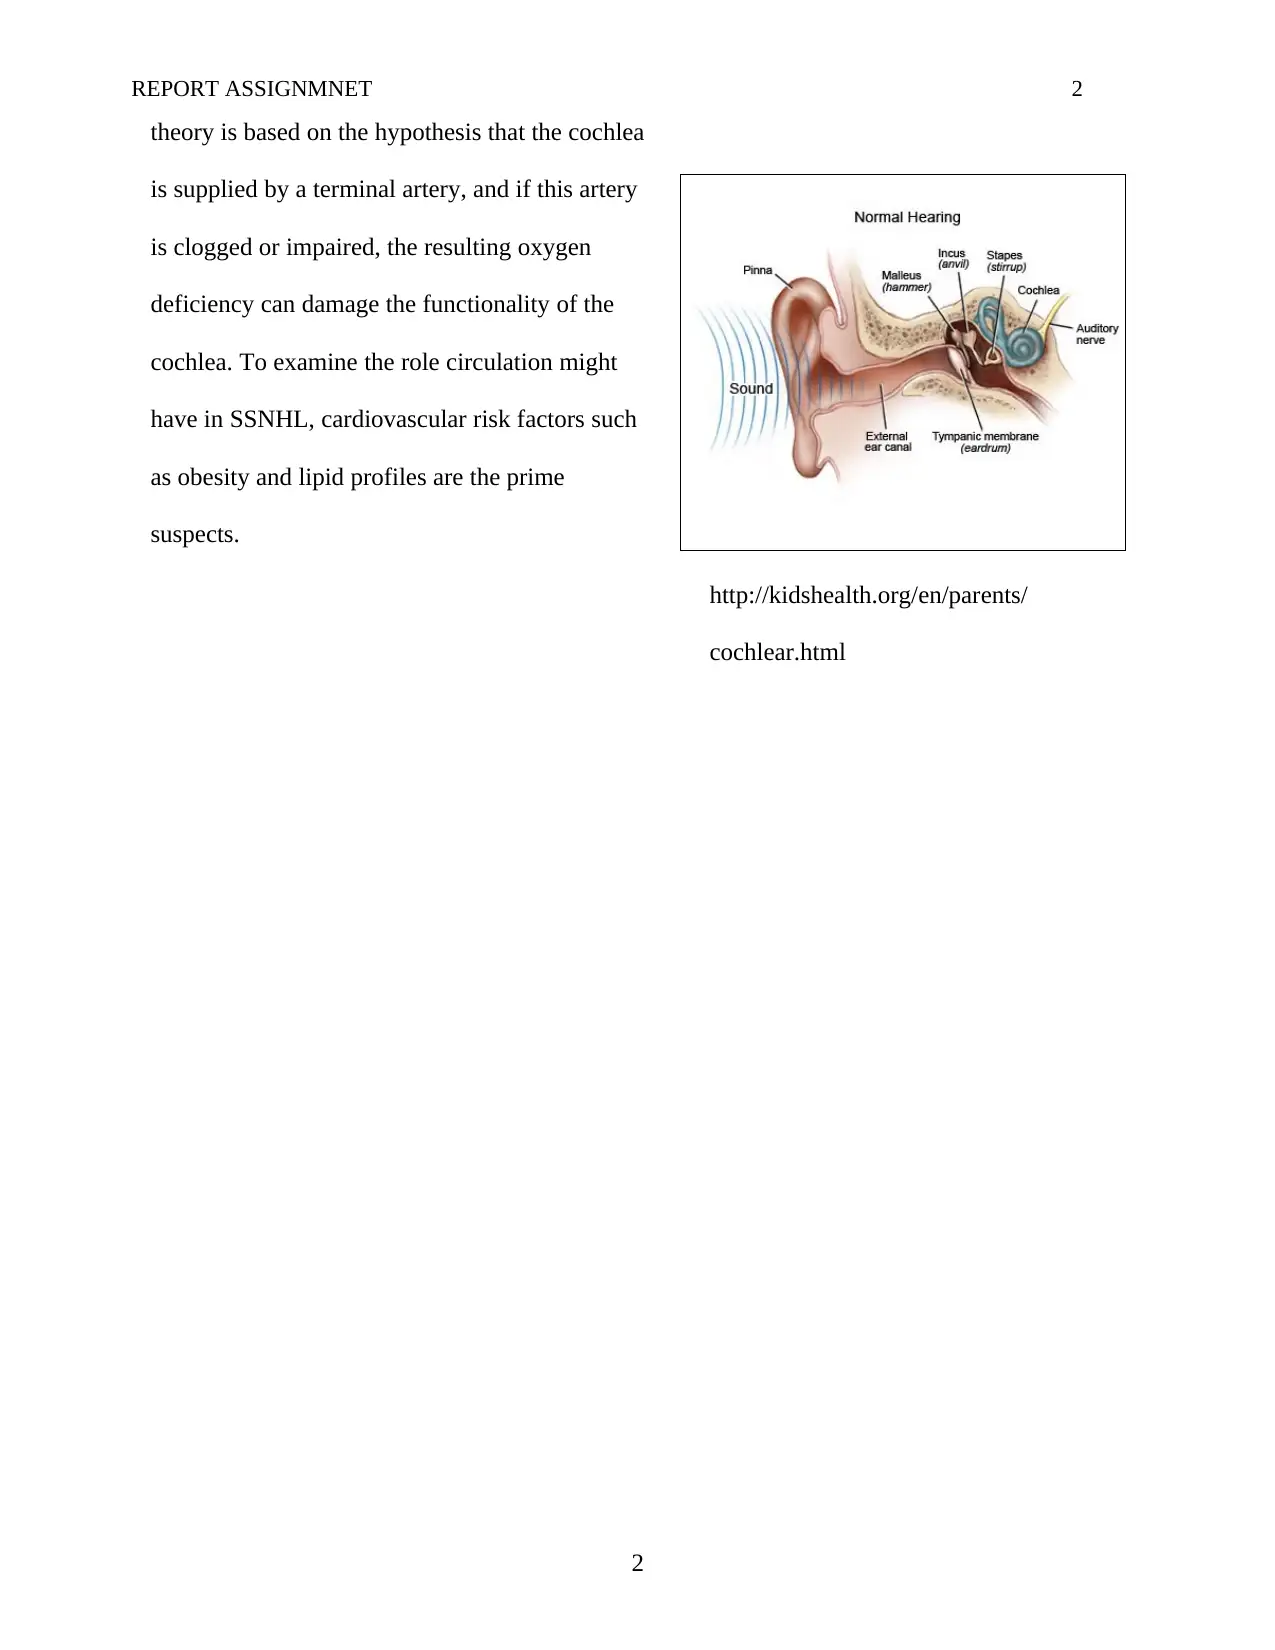
theory is based on the hypothesis that the cochlea
is supplied by a terminal artery, and if this artery
is clogged or impaired, the resulting oxygen
deficiency can damage the functionality of the
cochlea. To examine the role circulation might
have in SSNHL, cardiovascular risk factors such
as obesity and lipid profiles are the prime
suspects.
http://kidshealth.org/en/parents/
cochlear.html
REPORT ASSIGNMNET 2
theory is based on the hypothesis that the cochlea
is supplied by a terminal artery, and if this artery
is clogged or impaired, the resulting oxygen
deficiency can damage the functionality of the
cochlea. To examine the role circulation might
have in SSNHL, cardiovascular risk factors such
as obesity and lipid profiles are the prime
suspects.
http://kidshealth.org/en/parents/
cochlear.html
REPORT ASSIGNMNET 3
Lee et al. (2015) conducted a study to determine if lipid profiles and obesity affect the prevalence
and prognosis of SSNHL in order to provide evidence for the cardiovascular theory discussed
above. This study was a case-controlled study with 324 hospitalized SSNHL patients and 972
control subjects. The cases included all patients diagnosed with SSNHL between January 2009
and February 2012 at Hallym University Sacred Heart Hospital in Korea. Patients with a history
of hearing loss or with complications that were known to cause hearing loss were excluded from
the study. Data for the control group were obtained from the Korean National Health and
Nutrition Examination Survey (KNHANES) from 2009 – 2010, from which three control
subjects were matched for each case subject. As a result of this matching, case and control group
showed no statistically significant differences in gender, age, height or underlying diseases. For
your analysis you will look at cardiovascular risk factors such as BMI and triglyceride. For BMI,
the classes are Underweight, Normal, Overweight, and obese (the last two are combined. For
triglyceride, the classes are Normal, High, and Very High
Data
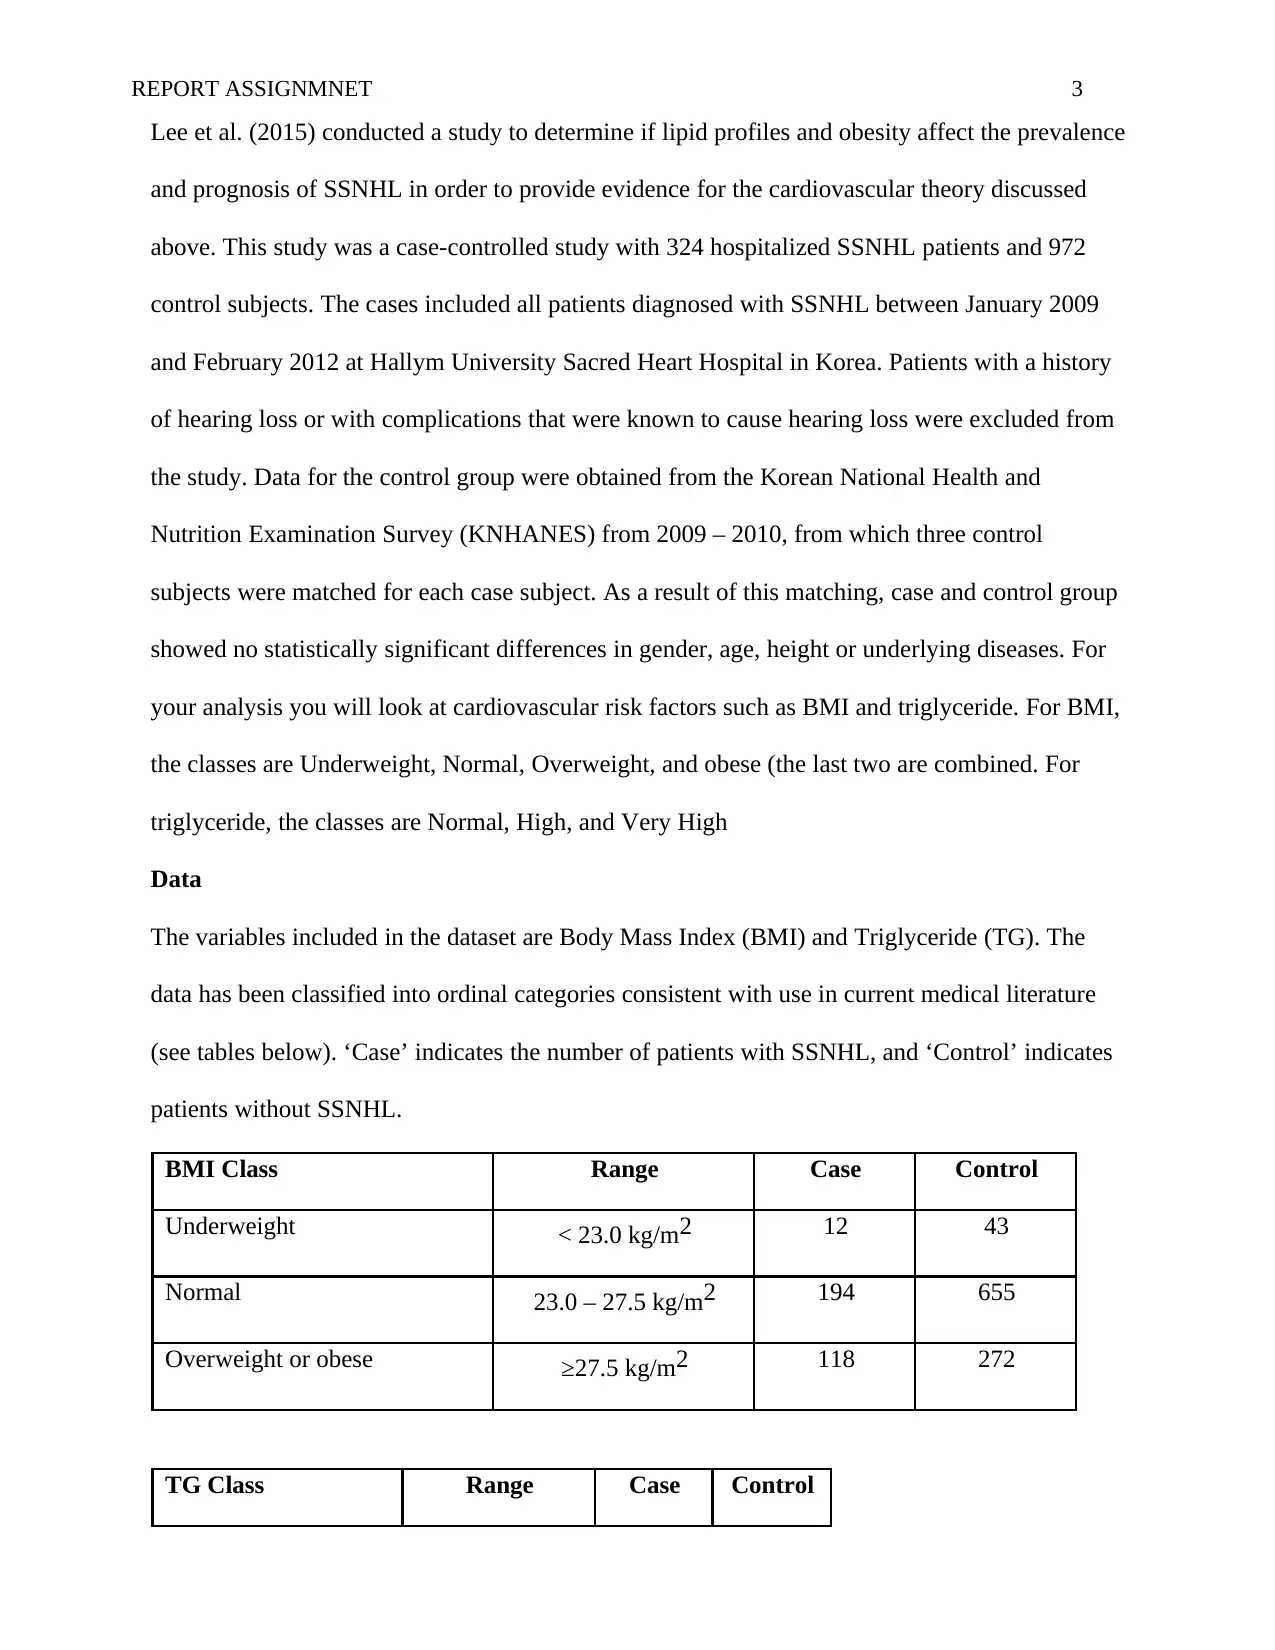
The variables included in the dataset are Body Mass Index (BMI) and Triglyceride (TG). The
data has been classified into ordinal categories consistent with use in current medical literature
(see tables below). ‘Case’ indicates the number of patients with SSNHL, and ‘Control’ indicates
patients without SSNHL.
BMI Class Range Case Control
Underweight < 23.0 kg/m2 12 43
Normal 23.0 – 27.5 kg/m2 194 655
Overweight or obese ≥27.5 kg/m2 118 272
TG Class Range Case Control
Lee et al. (2015) conducted a study to determine if lipid profiles and obesity affect the prevalence
and prognosis of SSNHL in order to provide evidence for the cardiovascular theory discussed
above. This study was a case-controlled study with 324 hospitalized SSNHL patients and 972
control subjects. The cases included all patients diagnosed with SSNHL between January 2009
and February 2012 at Hallym University Sacred Heart Hospital in Korea. Patients with a history
of hearing loss or with complications that were known to cause hearing loss were excluded from
the study. Data for the control group were obtained from the Korean National Health and
Nutrition Examination Survey (KNHANES) from 2009 – 2010, from which three control
subjects were matched for each case subject. As a result of this matching, case and control group
showed no statistically significant differences in gender, age, height or underlying diseases. For
your analysis you will look at cardiovascular risk factors such as BMI and triglyceride. For BMI,
the classes are Underweight, Normal, Overweight, and obese (the last two are combined. For
triglyceride, the classes are Normal, High, and Very High
Data
The variables included in the dataset are Body Mass Index (BMI) and Triglyceride (TG). The
data has been classified into ordinal categories consistent with use in current medical literature
(see tables below). ‘Case’ indicates the number of patients with SSNHL, and ‘Control’ indicates
patients without SSNHL.
BMI Class Range Case Control
Underweight < 23.0 kg/m2 12 43
Normal 23.0 – 27.5 kg/m2 194 655
Overweight or obese ≥27.5 kg/m2 118 272
TG Class Range Case Control
REPORT ASSIGNMNET 4
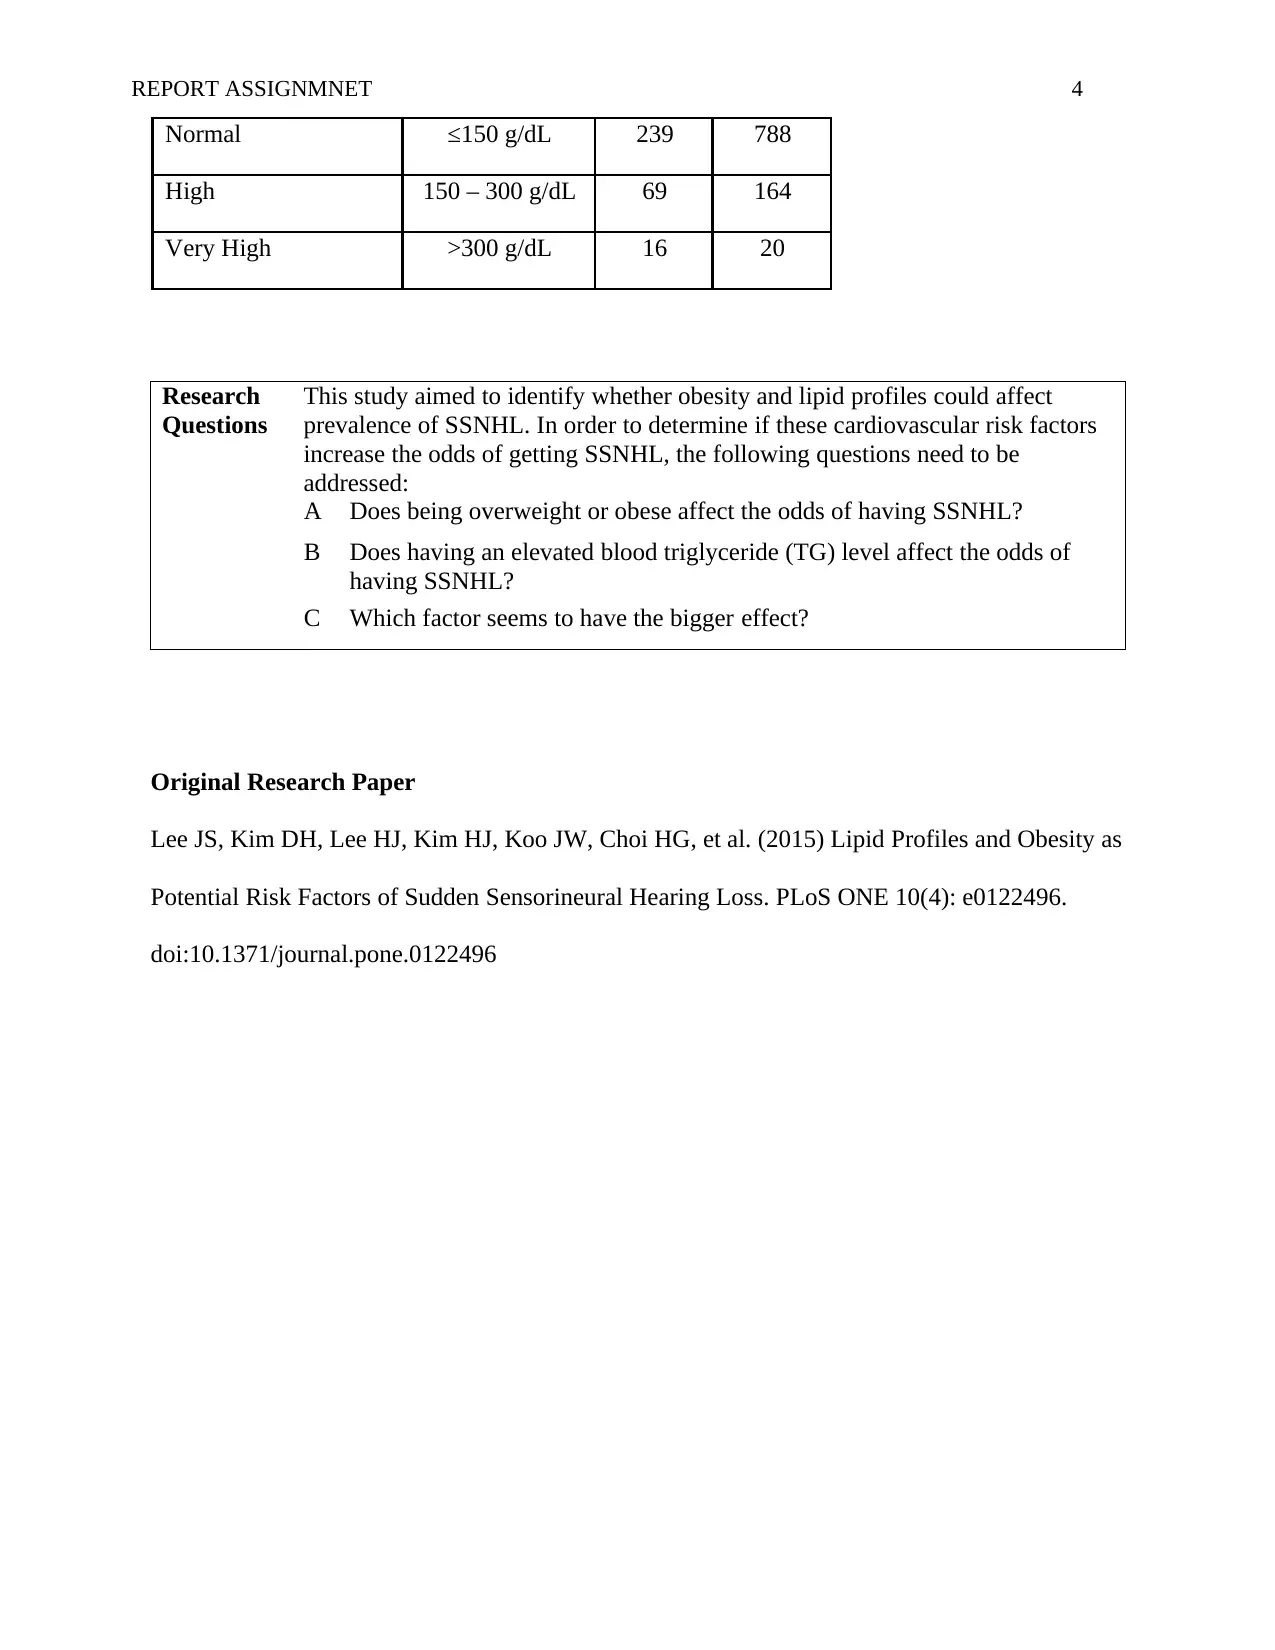
Normal ≤150 g/dL 239 788
High 150 – 300 g/dL 69 164
Very High >300 g/dL 16 20
Original Research Paper
Lee JS, Kim DH, Lee HJ, Kim HJ, Koo JW, Choi HG, et al. (2015) Lipid Profiles and Obesity as
Potential Risk Factors of Sudden Sensorineural Hearing Loss. PLoS ONE 10(4): e0122496.
doi:10.1371/journal.pone.0122496
Research This study aimed to identify whether obesity and lipid profiles could affect
Questions prevalence of SSNHL. In order to determine if these cardiovascular risk factors
increase the odds of getting SSNHL, the following questions need to be
addressed:
A Does being overweight or obese affect the odds of having SSNHL?
B Does having an elevated blood triglyceride (TG) level affect the odds of
having SSNHL?
C Which factor seems to have the bigger effect?
Secure Best Marks with AI Grader
Need help grading? Try our AI Grader for instant feedback on your assignments.
REPORT ASSIGNMNET 5
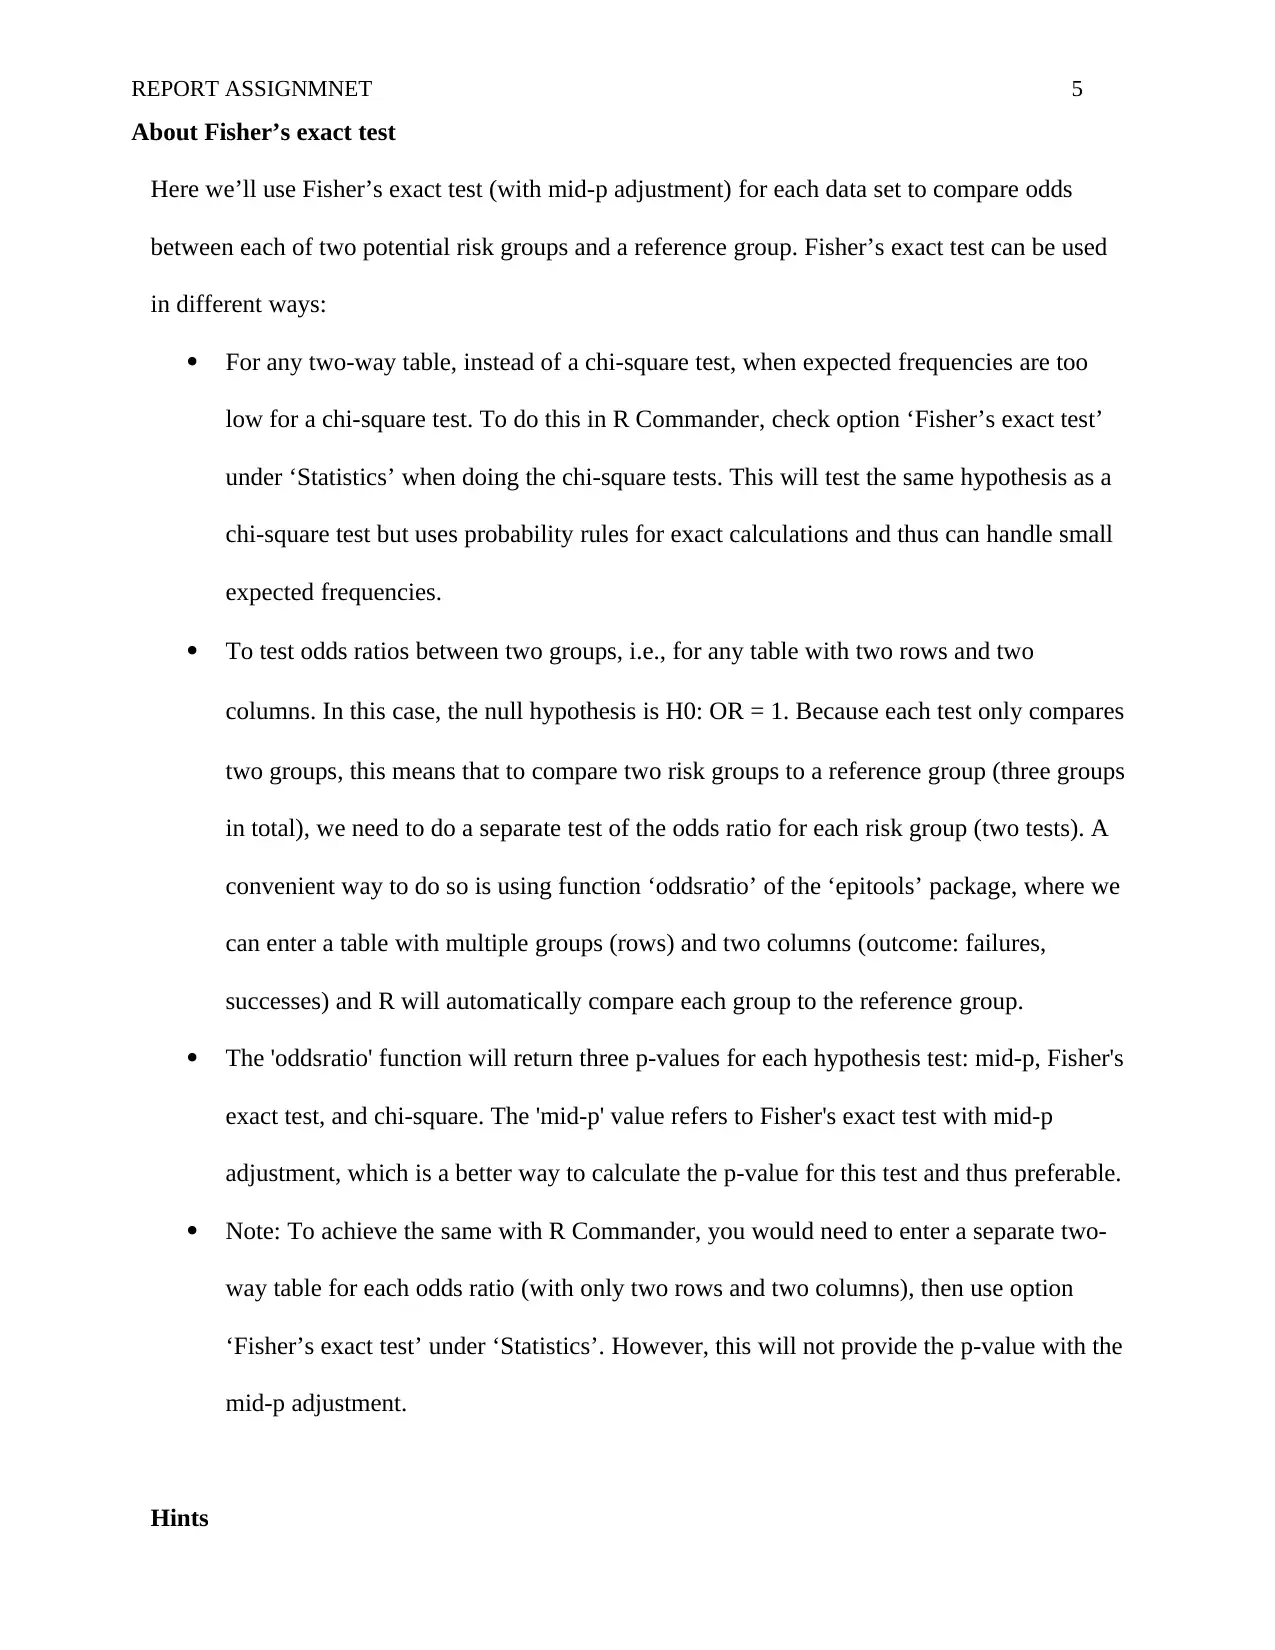
About Fisher’s exact test
Here we’ll use Fisher’s exact test (with mid-p adjustment) for each data set to compare odds
between each of two potential risk groups and a reference group. Fisher’s exact test can be used
in different ways:
For any two-way table, instead of a chi-square test, when expected frequencies are too
low for a chi-square test. To do this in R Commander, check option ‘Fisher’s exact test’
under ‘Statistics’ when doing the chi-square tests. This will test the same hypothesis as a
chi-square test but uses probability rules for exact calculations and thus can handle small
expected frequencies.
To test odds ratios between two groups, i.e., for any table with two rows and two
columns. In this case, the null hypothesis is H0: OR = 1. Because each test only compares
two groups, this means that to compare two risk groups to a reference group (three groups
in total), we need to do a separate test of the odds ratio for each risk group (two tests). A
convenient way to do so is using function ‘oddsratio’ of the ‘epitools’ package, where we
can enter a table with multiple groups (rows) and two columns (outcome: failures,
successes) and R will automatically compare each group to the reference group.
The 'oddsratio' function will return three p-values for each hypothesis test: mid-p, Fisher's
exact test, and chi-square. The 'mid-p' value refers to Fisher's exact test with mid-p
adjustment, which is a better way to calculate the p-value for this test and thus preferable.
Note: To achieve the same with R Commander, you would need to enter a separate two-
way table for each odds ratio (with only two rows and two columns), then use option
‘Fisher’s exact test’ under ‘Statistics’. However, this will not provide the p-value with the
mid-p adjustment.
Hints
REPORT ASSIGNMNET 6
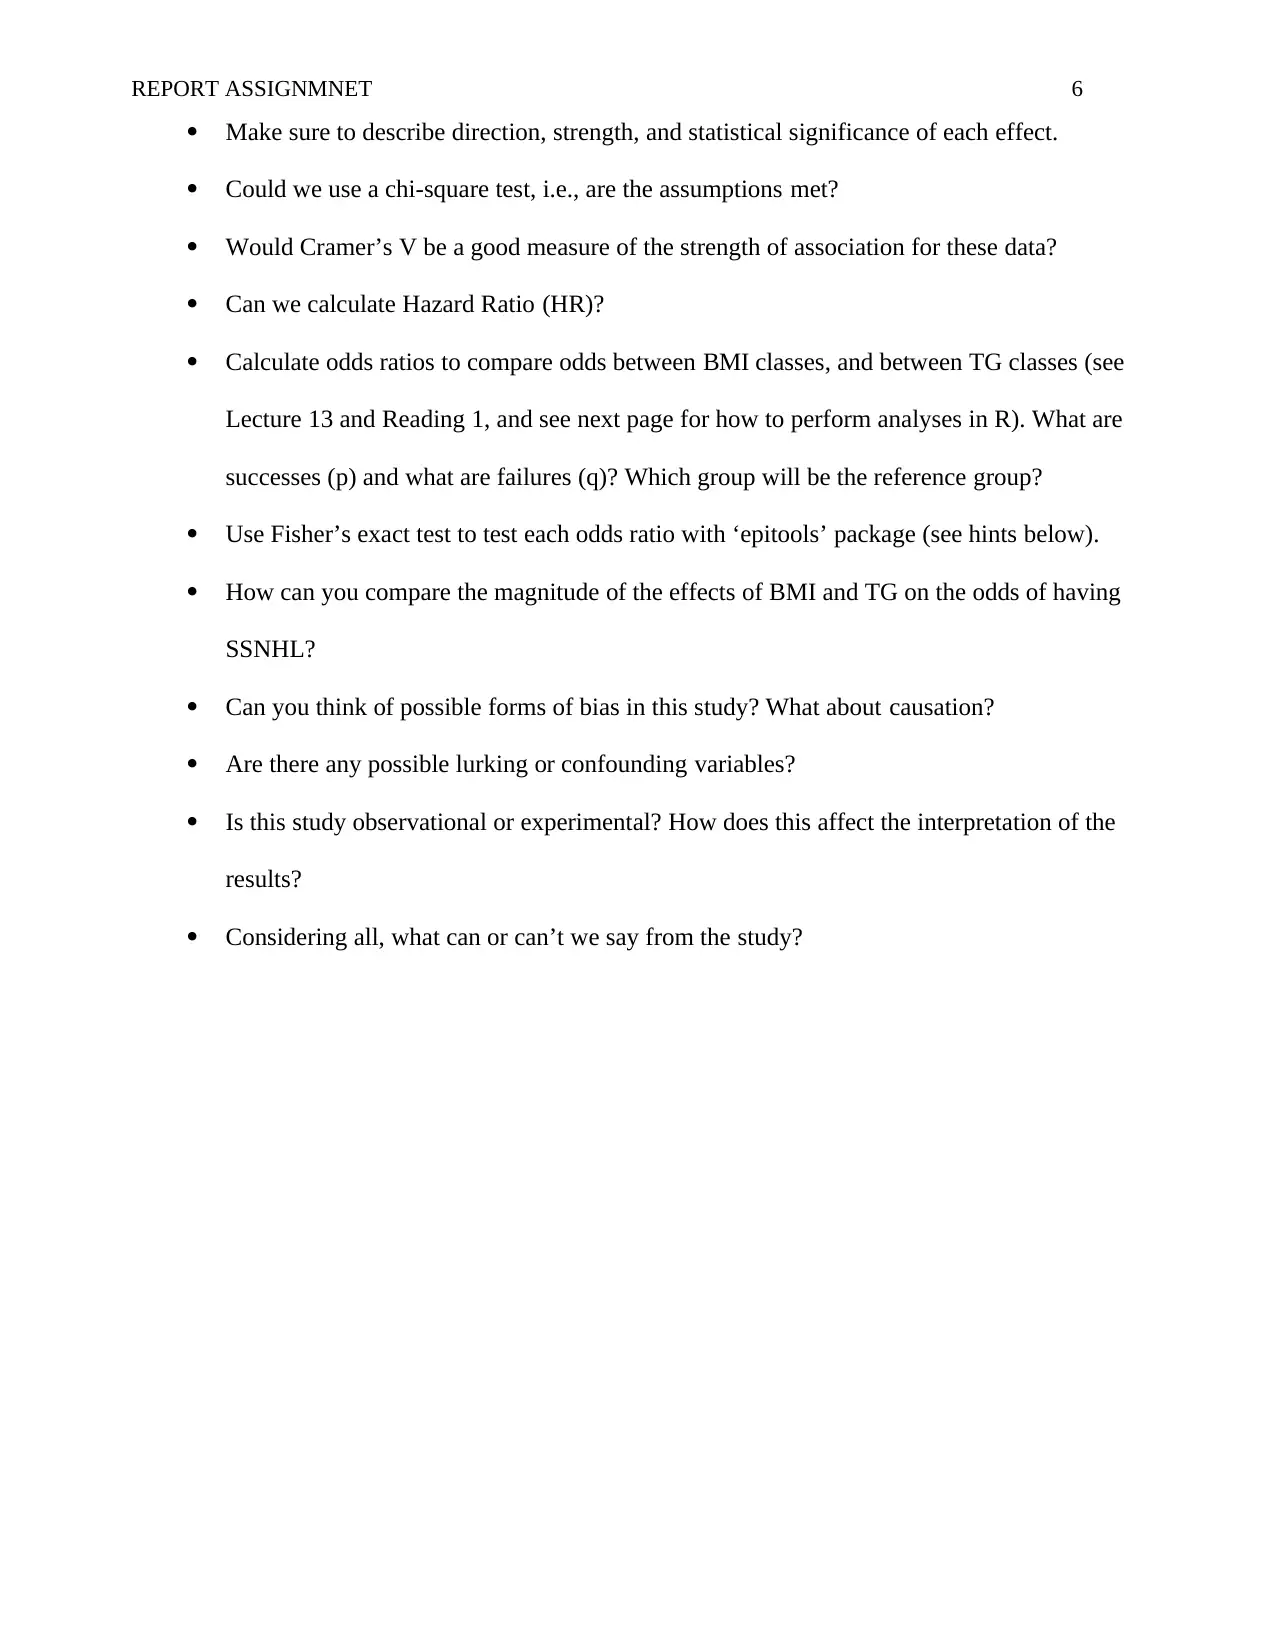
Make sure to describe direction, strength, and statistical significance of each effect.
Could we use a chi-square test, i.e., are the assumptions met?
Would Cramer’s V be a good measure of the strength of association for these data?
Can we calculate Hazard Ratio (HR)?
Calculate odds ratios to compare odds between BMI classes, and between TG classes (see
Lecture 13 and Reading 1, and see next page for how to perform analyses in R). What are
successes (p) and what are failures (q)? Which group will be the reference group?
Use Fisher’s exact test to test each odds ratio with ‘epitools’ package (see hints below).
How can you compare the magnitude of the effects of BMI and TG on the odds of having
SSNHL?
Can you think of possible forms of bias in this study? What about causation?
Are there any possible lurking or confounding variables?
Is this study observational or experimental? How does this affect the interpretation of the
results?
Considering all, what can or can’t we say from the study?
REPORT ASSIGNMNET 7
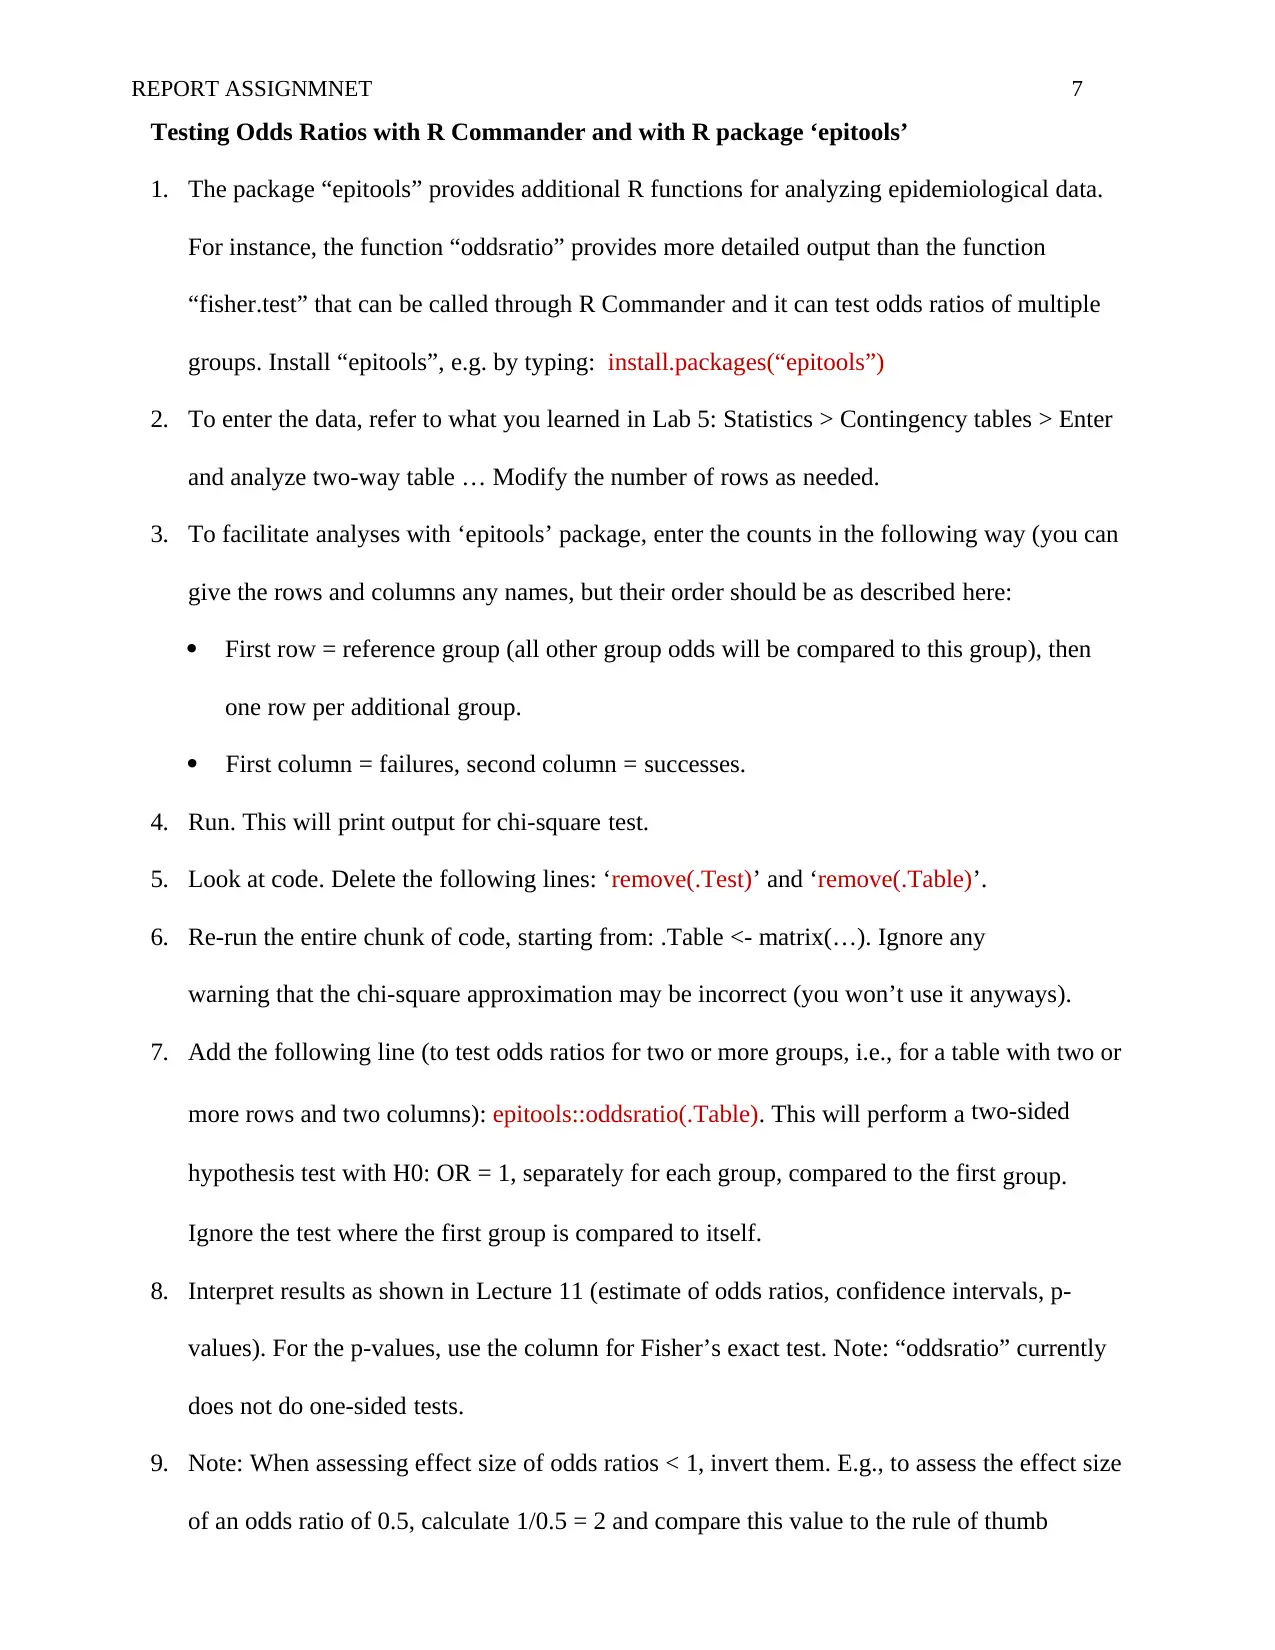
Testing Odds Ratios with R Commander and with R package ‘epitools’
1. The package “epitools” provides additional R functions for analyzing epidemiological data.
For instance, the function “oddsratio” provides more detailed output than the function
“fisher.test” that can be called through R Commander and it can test odds ratios of multiple
groups. Install “epitools”, e.g. by typing: install.packages(“epitools”)
2. To enter the data, refer to what you learned in Lab 5: Statistics > Contingency tables > Enter
and analyze two-way table … Modify the number of rows as needed.
3. To facilitate analyses with ‘epitools’ package, enter the counts in the following way (you can
give the rows and columns any names, but their order should be as described here:
First row = reference group (all other group odds will be compared to this group), then
one row per additional group.
First column = failures, second column = successes.
4. Run. This will print output for chi-square test.
5. Look at code. Delete the following lines: ‘remove(.Test)’ and ‘remove(.Table)’.
6. Re-run the entire chunk of code, starting from: .Table <- matrix(…). Ignore any
warning that the chi-square approximation may be incorrect (you won’t use it anyways).
7. Add the following line (to test odds ratios for two or more groups, i.e., for a table with two or
more rows and two columns): epitools::oddsratio(.Table). This will perform a two-sided
hypothesis test with H0: OR = 1, separately for each group, compared to the first group.
Ignore the test where the first group is compared to itself.
8. Interpret results as shown in Lecture 11 (estimate of odds ratios, confidence intervals, p-
values). For the p-values, use the column for Fisher’s exact test. Note: “oddsratio” currently
does not do one-sided tests.
9. Note: When assessing effect size of odds ratios < 1, invert them. E.g., to assess the effect size
of an odds ratio of 0.5, calculate 1/0.5 = 2 and compare this value to the rule of thumb
Paraphrase This Document
Need a fresh take? Get an instant paraphrase of this document with our AI Paraphraser
REPORT ASSIGNMNET 8
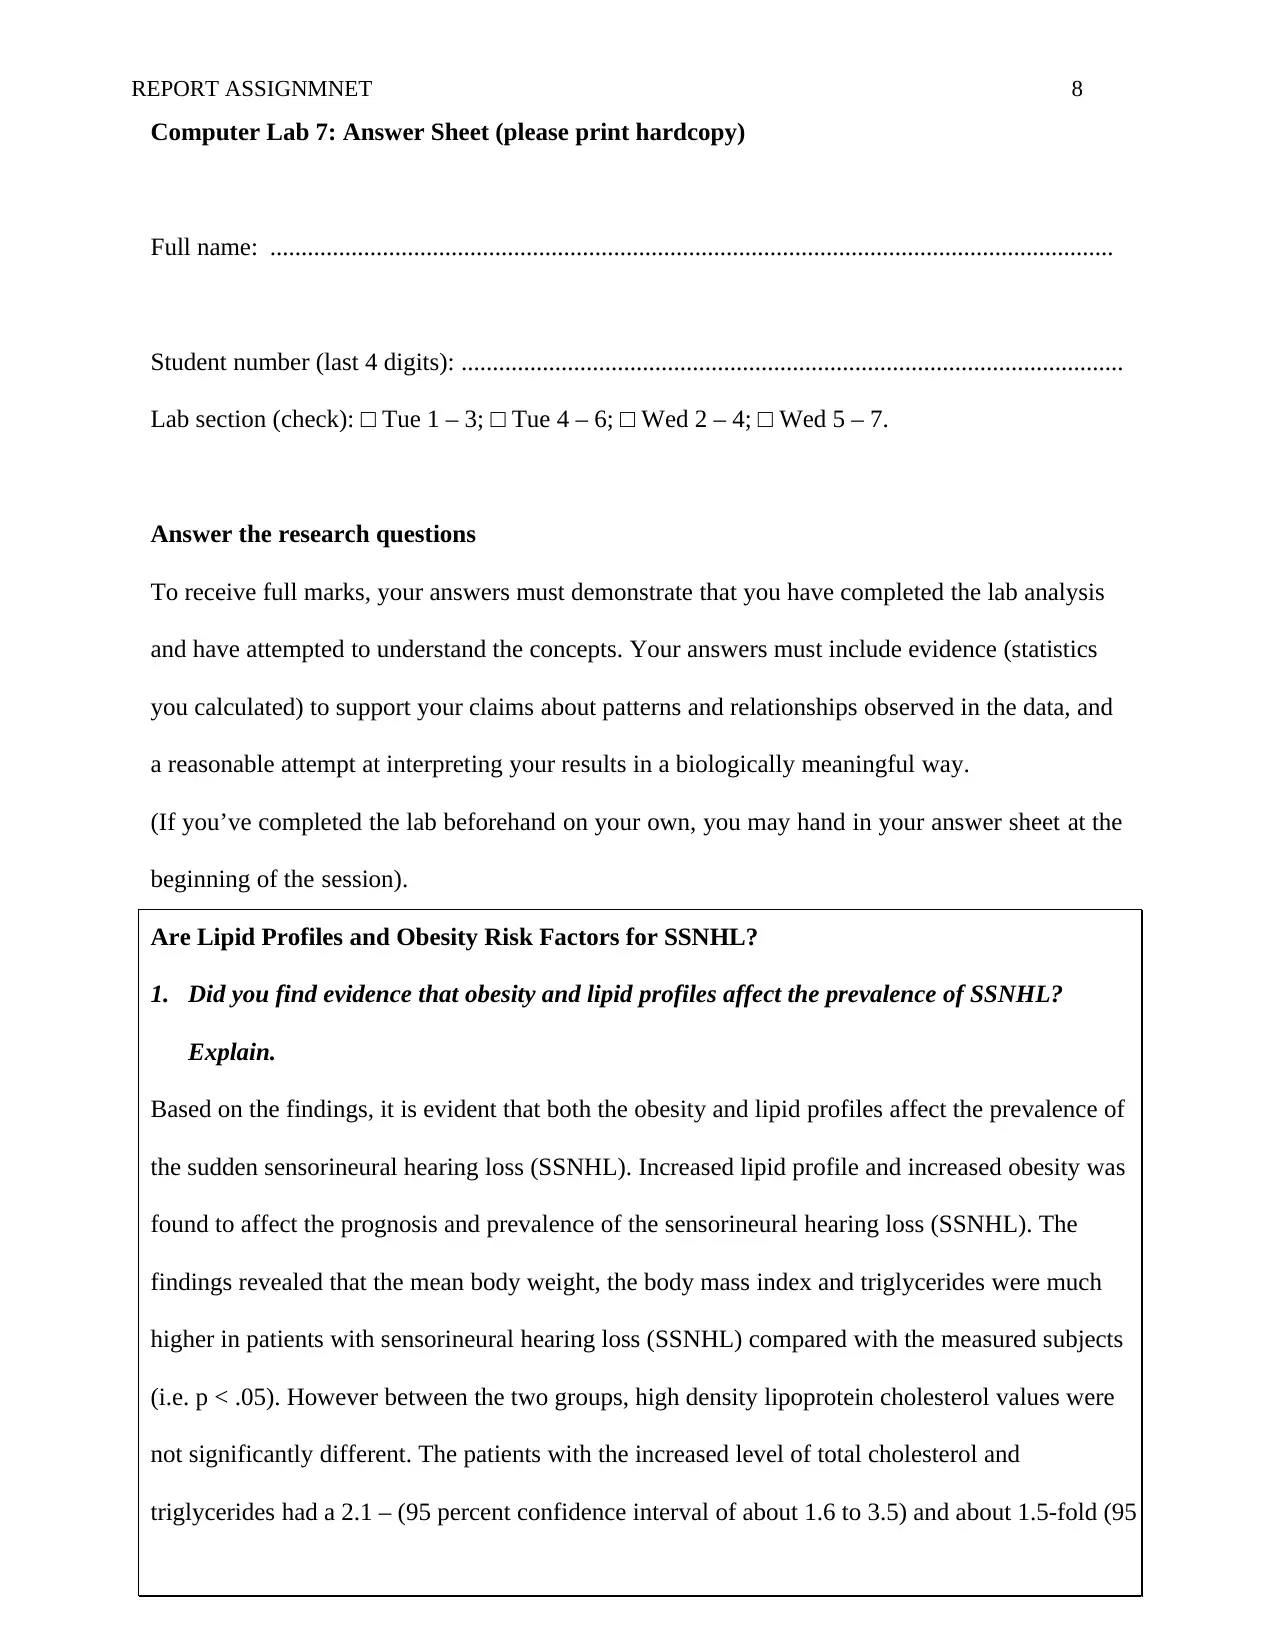
Computer Lab 7: Answer Sheet (please print hardcopy)
Full name: .......................................................................................................................................
Student number (last 4 digits): ..........................................................................................................
Lab section (check): □ Tue 1 – 3; □ Tue 4 – 6; □ Wed 2 – 4; □ Wed 5 – 7.
Answer the research questions
To receive full marks, your answers must demonstrate that you have completed the lab analysis
and have attempted to understand the concepts. Your answers must include evidence (statistics
you calculated) to support your claims about patterns and relationships observed in the data, and
a reasonable attempt at interpreting your results in a biologically meaningful way.
(If you’ve completed the lab beforehand on your own, you may hand in your answer sheet at the
beginning of the session).
Are Lipid Profiles and Obesity Risk Factors for SSNHL?
1. Did you find evidence that obesity and lipid profiles affect the prevalence of SSNHL?
Explain.
Based on the findings, it is evident that both the obesity and lipid profiles affect the prevalence of
the sudden sensorineural hearing loss (SSNHL). Increased lipid profile and increased obesity was
found to affect the prognosis and prevalence of the sensorineural hearing loss (SSNHL). The
findings revealed that the mean body weight, the body mass index and triglycerides were much
higher in patients with sensorineural hearing loss (SSNHL) compared with the measured subjects
(i.e. p < .05). However between the two groups, high density lipoprotein cholesterol values were
not significantly different. The patients with the increased level of total cholesterol and
triglycerides had a 2.1 – (95 percent confidence interval of about 1.6 to 3.5) and about 1.5-fold (95
REPORT ASSIGNMNET 9
percent confidence interval about 1.9 to 2.1) increased odds ratio, respectively of SSNHL as
compared with patients with average level of total cholesterol and triglycerides levels. Also, the
patients with normal body mass index had a fold of about 1.6 (with a 95 percent confidence
interval of 1.2 to 2.2) increased odds ratio of SSNHL. Moreover, the multivariate cox regression
analysis proved that the body mass index was an independent risk factor of the outcome of the
treatment as the subjects (patients) with body mass index greater than 28 were less likely to
achieve complete recovery than the patients whose body mass index is less 28. (P < .05). Thus the
findings of the study reveals that high levels of total cholesterol which describes obesity and high
levels of triglycerides together with the increased body mass index are factors that significantly
affects the prevalence of the SSNHL and its prognosis (Cadoni et al., 2010). This further reveals
that the vascular compromise may play a vital function in the pathogenesis of the sensorineural
hearing loss (SSNHL) (Lee et al., 2015).
2. Which effect seems to be larger? Justify your answer.
As per the findings, high level of total cholesterol and triglycerides (TG) showed higher effects on
the sensorineural hearing (SSNHL) as compared to the effects by the body mass index. Both the
high level of the total cholesterol (TC) and triglycerides (TG) produced a better confidences
interval as compared to that of the body mass index. For instance, the 95% confidence interval for
the body mass index was (95% CI 1.6-3.5). Which is wider confidence interval and thus had no
much effect on the sensorineural hearing loss (SSNHL) (Rajati et al., 2016). Also, under the
regression analysis, the body mass index (BMI) was found to be an independent factor of the
outcome. However, under high body mass index, the effect seemed to be much larger. This is due
to the fact that high body mass index is as a result of high overweight range. Hence according to
the results, the triglycerides (TG) has a higher effect than the body mass index (BMI).
REPORT ASSIGNMNET 10
References
Cadoni, G., Scorpecci, A., Cianfrone, F., Giannantonio, S., Paludetti, G., & Lippa, S. (2010).
Serum fatty acids and cardiovascular risk factors in sudden sensorineural hearing loss: a
case-control study. Annals of Otology, Rhinology & Laryngology, 119(2), 82-88.
Dhanda, N., & Taheri, S. (2017). A narrative review of obesity and hearing loss. International
Journal of Obesity, 41(7), 1066.
Lee, J. S., Kim, D. H., Lee, H. J., Kim, H. J., Koo, J. W., Choi, H. G., ... & Hong, S. K. (2015).
Lipid profiles and obesity as potential risk factors of sudden sensorineural hearing
loss. PLoS One, 10(4), e0122496.
Rajati, M., Azarpajooh, M. R., Mouhebati, M., Nasrollahi, M., Salehi, M., Khadivi, E., &
Bakhshaee, M. (2016). Is sudden hearing loss associated with atherosclerosis? Iranian
journal of otorhinolaryngology, 28(86), 189.
1 out of 10
Your All-in-One AI-Powered Toolkit for Academic Success.
+13062052269
info@desklib.com
Available 24*7 on WhatsApp / Email
![[object Object]](/_next/static/media/star-bottom.7253800d.svg)
Unlock your academic potential
© 2024 | Zucol Services PVT LTD | All rights reserved.