Management Accounting Report: Cost, Budget, and Performance Analysis
VerifiedAdded on 2020/02/05
|21
|6890
|46
Report
AI Summary
This report on management accounting provides a comprehensive overview of cost classification, job costing, and absorption costing techniques. It delves into the calculation of job and unit costs, followed by an analysis of overhead absorption rates using direct labor hours. The report also includes a detailed cost sheet preparation and variance analysis, highlighting performance indicators for potential improvements and strategies for cost reduction. Furthermore, it covers the budgeting process, including material purchase, production, and cash budgets, along with variance analysis and the identification of responsibility centers. The report concludes with recommendations for corrective actions based on the variance analysis and provides a detailed analysis of the performance of the company.
MANAGEMENT
ACCOUNTING
ACCOUNTING
Paraphrase This Document
Need a fresh take? Get an instant paraphrase of this document with our AI Paraphraser
TABLE OF CONTENTS
INTRODUCTION...........................................................................................................................3
1.1 Classification of cost on the basis of various factors............................................................3
1.2 Calculation of job cost and unit cost.....................................................................................4
1.3 Calculation of the cost by using absorption costing technique.............................................4
1.4 Calculation of overhead absorption rate using direct labor hours.........................................6
TASK 2............................................................................................................................................7
2.1 Preparation of cost sheet and variance analysis...................................................................7
2.2 Various performance indicators used to identify the areas of potential improvements.......8
2.3 Ways to reduce cost, enhance value and quality..................................................................9
TASK 3 .........................................................................................................................................10
3.1 Nature and purpose of budgeting process...........................................................................10
3.2 Appropriate budgeting method for the organization and its need.......................................11
3.3 Material purchase budget and production requirement budget...........................................12
3.4 preparation of cash budget.................................................................................................13
TASK 4..........................................................................................................................................14
4.1, 4.2 Variance analysis and recommendation corrective actions.........................................14
4.3 Identifications of responsibility centers.............................................................................15
CONCLCUSION...........................................................................................................................15
REFERENCES..............................................................................................................................16
INDEX OF TABLES
Table 1: Calculation of total cost and per unit cost for a job...........................................................5
Table 2: Calculation of overhead absorption rate using direct labor hours.....................................7
Table 3: Preparation of budgeted and actual cost (In £)..................................................................8
Table 4: Variance analysis...............................................................................................................8
Table 5: Production budget for July, August and September (In Units).......................................13
Table 6: Material purchase budget (In Kg)....................................................................................14
Table 7: preparation of Cash budget..............................................................................................14
Table 8: Calculation of budgeted cost for 4000 units....................................................................15
Table 9: operating statement reconciling both budgeted and actual results..................................15
Table 10: Calculation of per unit variances...................................................................................15
INTRODUCTION
In the competitive business environment most of the firms are competing with each other
on the basis of price of the product. Due to this reason it become necessary for the firms to
reduce their cost of production and to keep control on the expenses that are incurred for
producing goods and services. In this report, classification of cost is done and the same is
explained in detail. Further, various performance indicators are explained in detail in the report.
Apart from this, steps that firms can take in order to reduce their cost of production is also
explained in the report. After that budget process and its main purpose is explained in detail. In
the report, cash, material and production budget are prepared and necessary comments regarding
same are made. At the end of the report, responsibility center is explained and managers are held
responsible for the mistakes they committed in compliance with the budget.
TASK 1
1.1 Classification of cost on the basis of various factors
Cost indicates the aggregate value that is incurred to produce the goods and while making
services available at the workplace. There are many types of costs and these are classified on the
basis of various parameters. Classification of costs is given as below:
Elements of cost- Costs are divided into three categories namely material, labor and
overhead cost. Labor cost refers to the wages that are paid to the labors for producing goods in
the manufacturing facility. On the other hand, material cost refers to the cost of purchase of raw
material that is used for the production of goods (Kaplan and Atkinson, 2015). At last, overhead
expenses come in which all expenses related to the production are included. All these costs are
added in order to compute the final cost of production.
Function – On the basis of functions, cost related to various departments is considered
by the firm. There are various departments like HR, marketing and finance, etc. Various
administrative expenses are incurred in these departments. By adding these expenses, final cost
of various departments are computed in the organization.
Nature- On the basis of nature, costs are classified into two categories like direct and
indirect costs. Direct cost is a cost that is incurred in the production process. On the contrary,
indirect cost refers to the cost that is incurred to support the entire production process (Zadek,
Evans and Pruzan, 2013). Cost incurred to purchase raw material is the example of direct cost.
⊘ This is a preview!⊘
Do you want full access?
Subscribe today to unlock all pages.
Trusted by 1+ million students worldwide
But transport expense that is incurred for the transportation of raw material is an example of
indirect cost.
Behavior- On the basis of behavior, costs are divided into three categories namely fixed,
variable and semi variable cost. Fixed cost refers to the cost that does not change with the change
in production. Land and building purchase cost comes under fixed cost category. On the other
hand, there is the variable cost which keeps on changing with the change in production level
(Quattrone and Hopper, 2005). Semi variable cost is a special type of cost which contains
features of fixed and variable cost. Some parts of semi variable cost remain same and some part
of the same cost remains variable. Hence, it can be said that all costs fall under these three
categories.
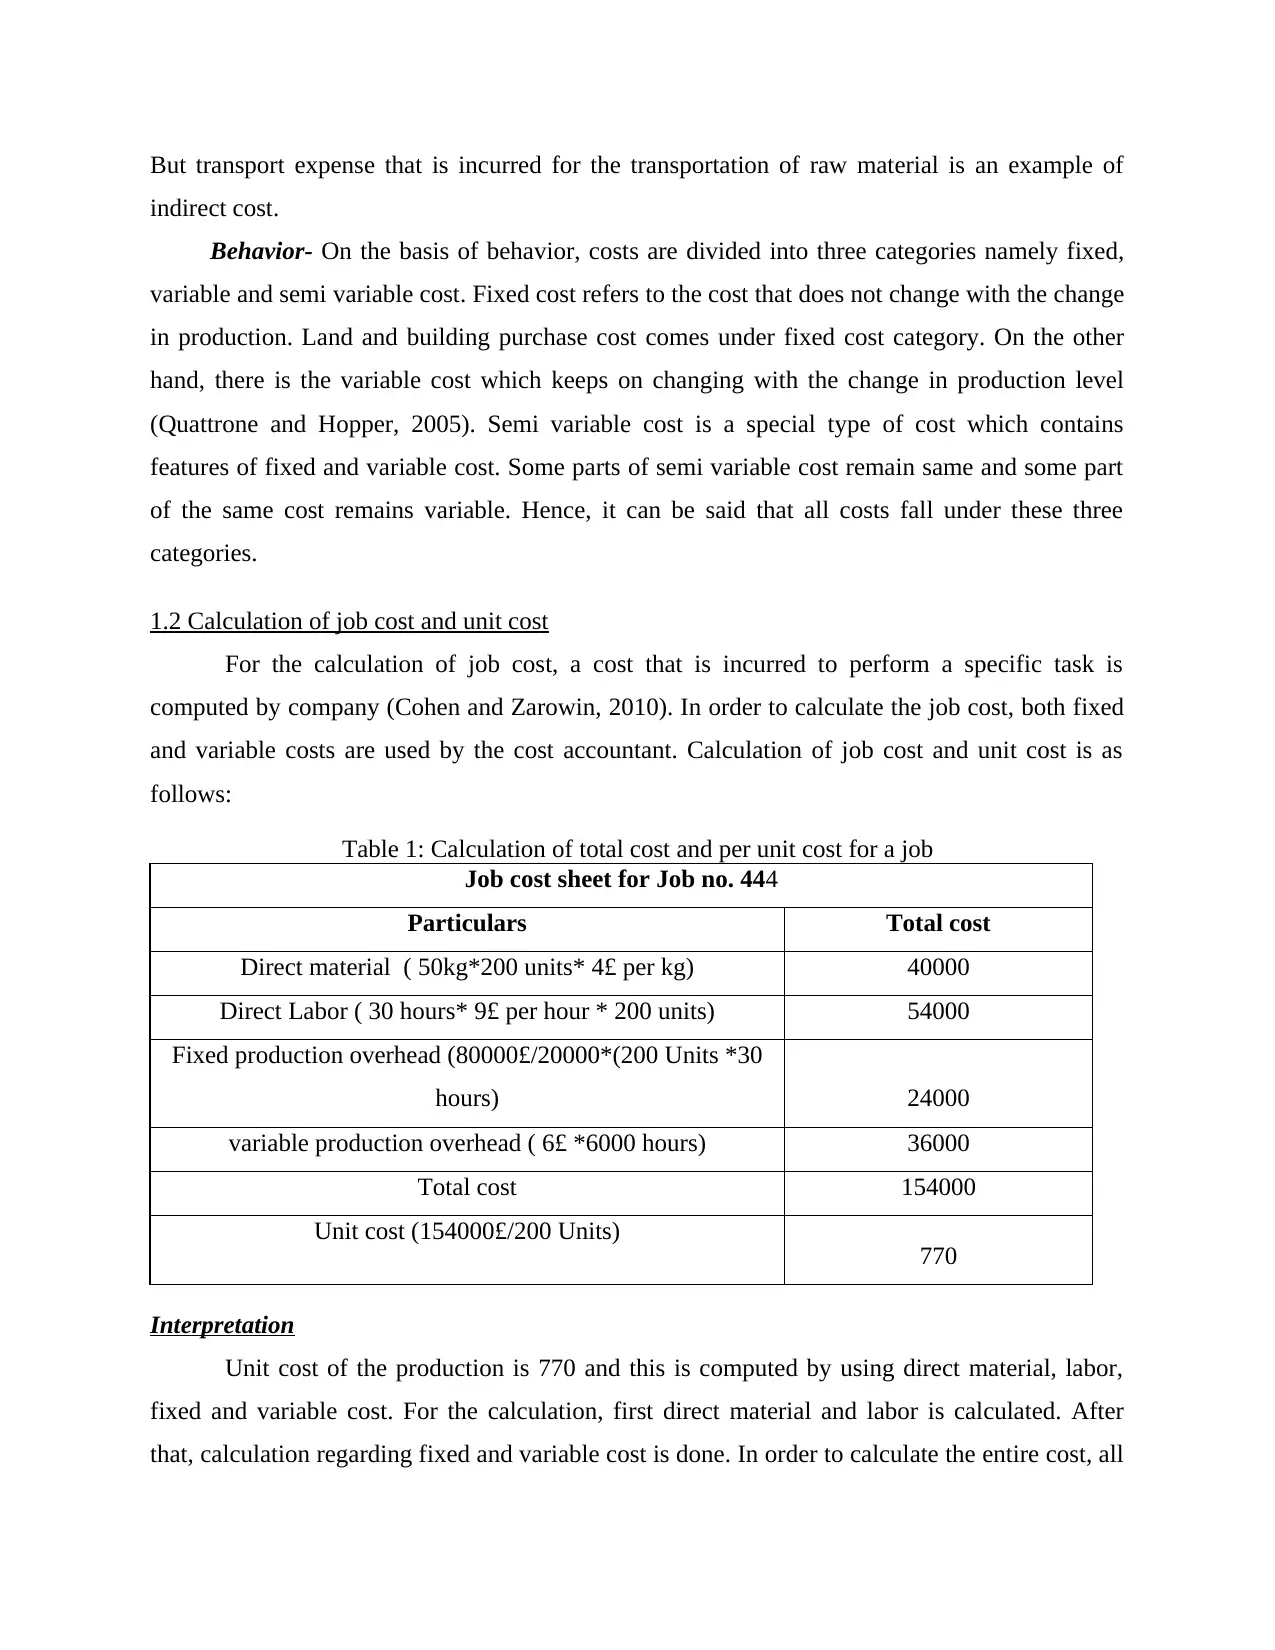
1.2 Calculation of job cost and unit cost
For the calculation of job cost, a cost that is incurred to perform a specific task is
computed by company (Cohen and Zarowin, 2010). In order to calculate the job cost, both fixed
and variable costs are used by the cost accountant. Calculation of job cost and unit cost is as
follows:
Table 1: Calculation of total cost and per unit cost for a job
Job cost sheet for Job no. 444
Particulars Total cost
Direct material ( 50kg*200 units* 4£ per kg) 40000
Direct Labor ( 30 hours* 9£ per hour * 200 units) 54000
Fixed production overhead (80000£/20000*(200 Units *30
hours) 24000
variable production overhead ( 6£ *6000 hours) 36000
Total cost 154000
Unit cost (154000£/200 Units) 770
Interpretation
Unit cost of the production is 770 and this is computed by using direct material, labor,
fixed and variable cost. For the calculation, first direct material and labor is calculated. After
that, calculation regarding fixed and variable cost is done. In order to calculate the entire cost, all
indirect cost.
Behavior- On the basis of behavior, costs are divided into three categories namely fixed,
variable and semi variable cost. Fixed cost refers to the cost that does not change with the change
in production. Land and building purchase cost comes under fixed cost category. On the other
hand, there is the variable cost which keeps on changing with the change in production level
(Quattrone and Hopper, 2005). Semi variable cost is a special type of cost which contains
features of fixed and variable cost. Some parts of semi variable cost remain same and some part
of the same cost remains variable. Hence, it can be said that all costs fall under these three
categories.
1.2 Calculation of job cost and unit cost
For the calculation of job cost, a cost that is incurred to perform a specific task is
computed by company (Cohen and Zarowin, 2010). In order to calculate the job cost, both fixed
and variable costs are used by the cost accountant. Calculation of job cost and unit cost is as
follows:
Table 1: Calculation of total cost and per unit cost for a job
Job cost sheet for Job no. 444
Particulars Total cost
Direct material ( 50kg*200 units* 4£ per kg) 40000
Direct Labor ( 30 hours* 9£ per hour * 200 units) 54000
Fixed production overhead (80000£/20000*(200 Units *30
hours) 24000
variable production overhead ( 6£ *6000 hours) 36000
Total cost 154000
Unit cost (154000£/200 Units) 770
Interpretation
Unit cost of the production is 770 and this is computed by using direct material, labor,
fixed and variable cost. For the calculation, first direct material and labor is calculated. After
that, calculation regarding fixed and variable cost is done. In order to calculate the entire cost, all
Paraphrase This Document
Need a fresh take? Get an instant paraphrase of this document with our AI Paraphraser
these expenses or costs are added and then divided by the total number of units that firm
produces. Finally, by doing this, per unit cost is calculated.
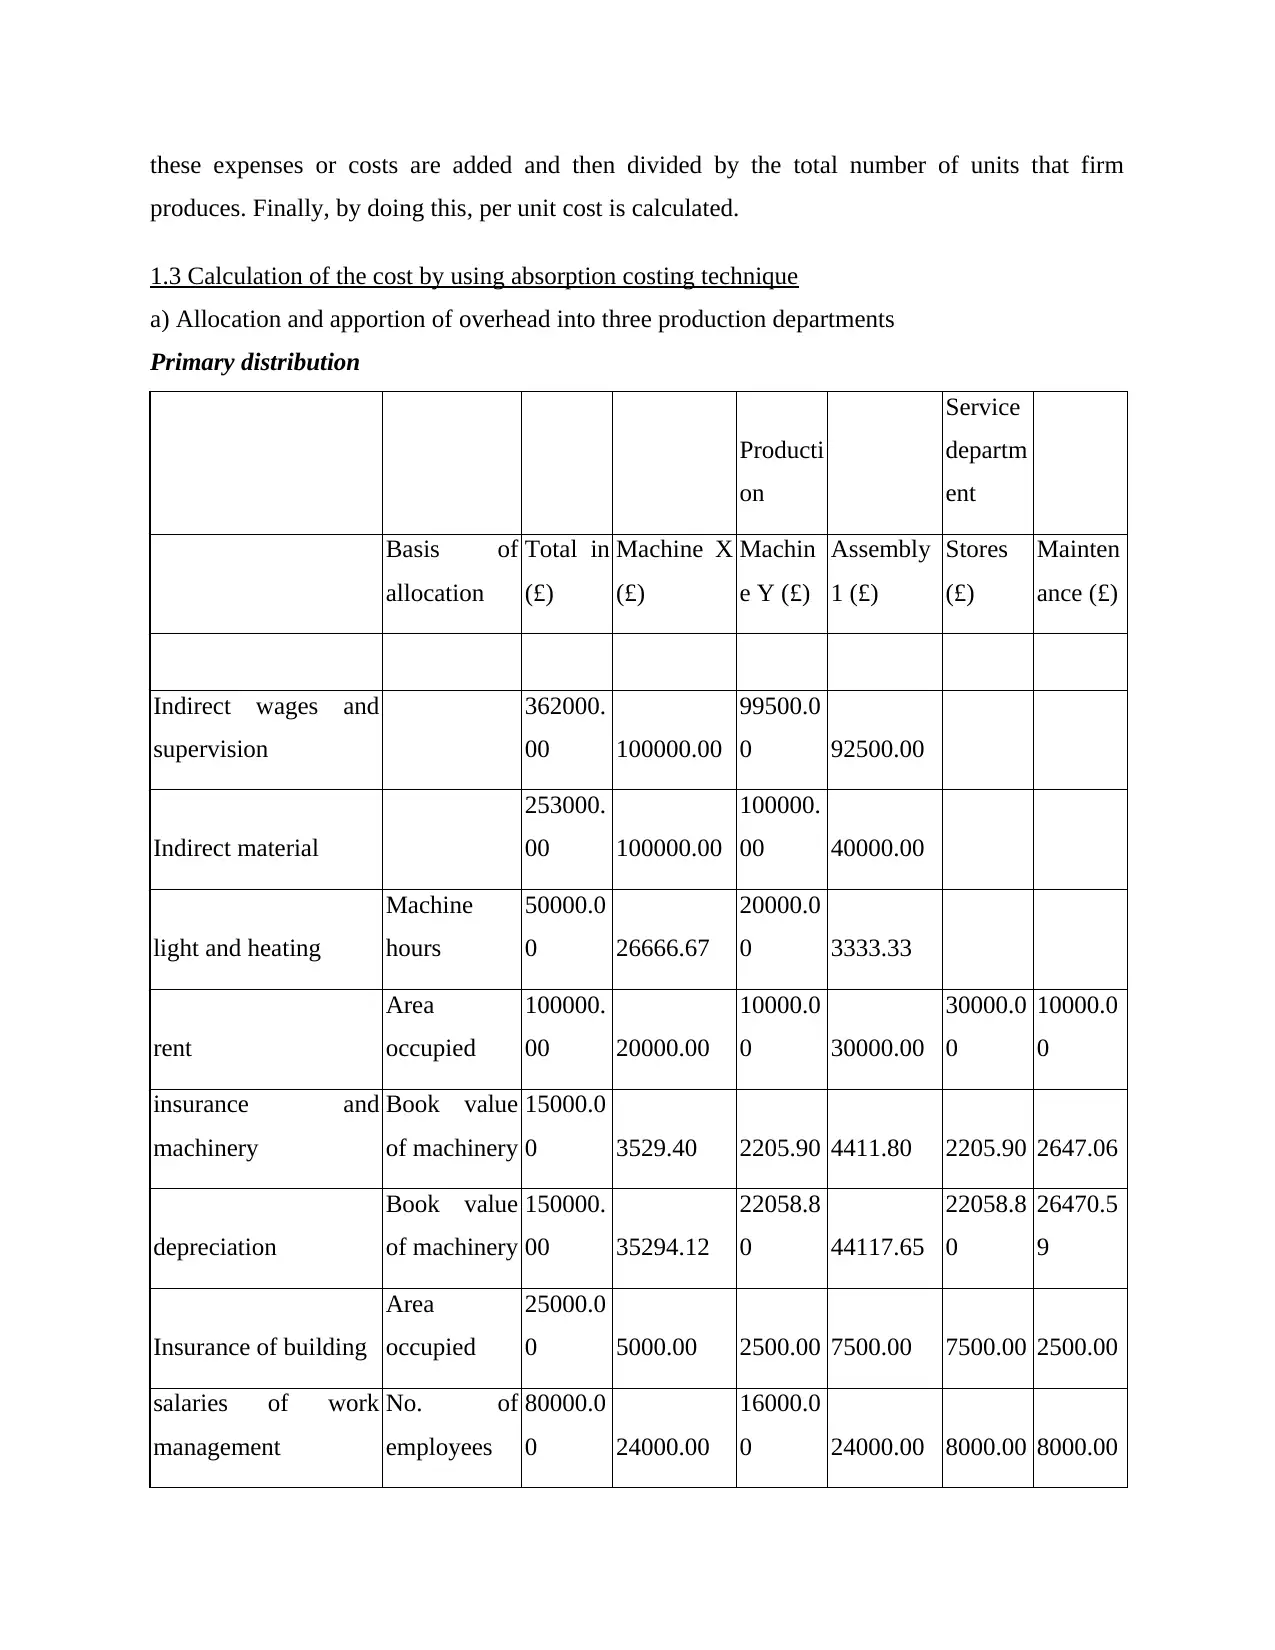
1.3 Calculation of the cost by using absorption costing technique
a) Allocation and apportion of overhead into three production departments
Primary distribution
Producti
on
Service
departm
ent
Basis of
allocation
Total in
(£)
Machine X
(£)
Machin
e Y (£)
Assembly
1 (£)
Stores
(£)
Mainten
ance (£)
Indirect wages and
supervision
362000.
00 100000.00
99500.0
0 92500.00
Indirect material
253000.
00 100000.00
100000.
00 40000.00
light and heating
Machine
hours
50000.0
0 26666.67
20000.0
0 3333.33
rent
Area
occupied
100000.
00 20000.00
10000.0
0 30000.00
30000.0
0
10000.0
0
insurance and
machinery
Book value
of machinery
15000.0
0 3529.40 2205.90 4411.80 2205.90 2647.06
depreciation
Book value
of machinery
150000.
00 35294.12
22058.8
0 44117.65
22058.8
0
26470.5
9
Insurance of building
Area
occupied
25000.0
0 5000.00 2500.00 7500.00 7500.00 2500.00
salaries of work
management
No. of
employees
80000.0
0 24000.00
16000.0
0 24000.00 8000.00 8000.00
produces. Finally, by doing this, per unit cost is calculated.
1.3 Calculation of the cost by using absorption costing technique
a) Allocation and apportion of overhead into three production departments
Primary distribution
Producti
on
Service
departm
ent
Basis of
allocation
Total in
(£)
Machine X
(£)
Machin
e Y (£)
Assembly
1 (£)
Stores
(£)
Mainten
ance (£)
Indirect wages and
supervision
362000.
00 100000.00
99500.0
0 92500.00
Indirect material
253000.
00 100000.00
100000.
00 40000.00
light and heating
Machine
hours
50000.0
0 26666.67
20000.0
0 3333.33
rent
Area
occupied
100000.
00 20000.00
10000.0
0 30000.00
30000.0
0
10000.0
0
insurance and
machinery
Book value
of machinery
15000.0
0 3529.40 2205.90 4411.80 2205.90 2647.06
depreciation
Book value
of machinery
150000.
00 35294.12
22058.8
0 44117.65
22058.8
0
26470.5
9
Insurance of building
Area
occupied
25000.0
0 5000.00 2500.00 7500.00 7500.00 2500.00
salaries of work
management
No. of
employees
80000.0
0 24000.00
16000.0
0 24000.00 8000.00 8000.00
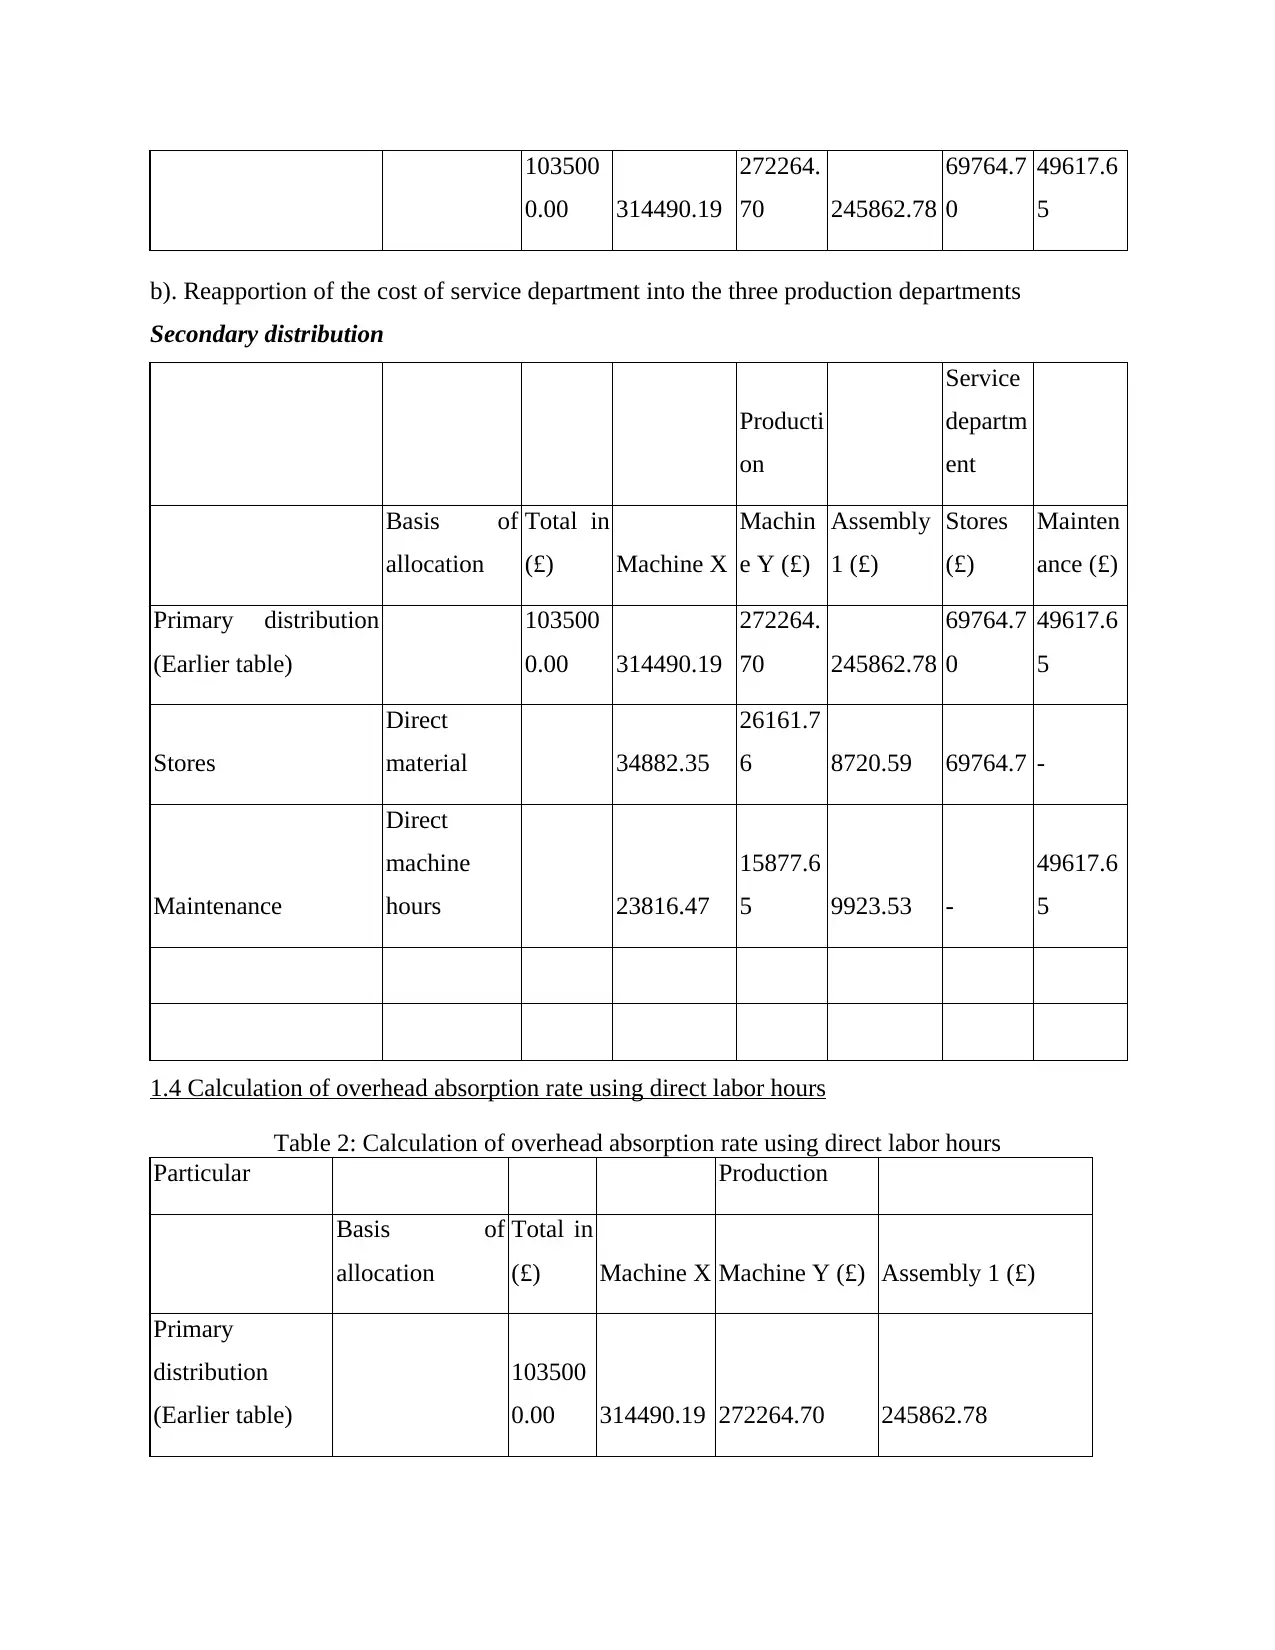
103500
0.00 314490.19
272264.
70 245862.78
69764.7
0
49617.6
5
b). Reapportion of the cost of service department into the three production departments
Secondary distribution
Producti
on
Service
departm
ent
Basis of
allocation
Total in
(£) Machine X
Machin
e Y (£)
Assembly
1 (£)
Stores
(£)
Mainten
ance (£)
Primary distribution
(Earlier table)
103500
0.00 314490.19
272264.
70 245862.78
69764.7
0
49617.6
5
Stores
Direct
material 34882.35
26161.7
6 8720.59 69764.7 -
Maintenance
Direct
machine
hours 23816.47
15877.6
5 9923.53 -
49617.6
5
1.4 Calculation of overhead absorption rate using direct labor hours
Table 2: Calculation of overhead absorption rate using direct labor hours
Particular Production
Basis of
allocation
Total in
(£) Machine X Machine Y (£) Assembly 1 (£)
Primary
distribution
(Earlier table)
103500
0.00 314490.19 272264.70 245862.78
0.00 314490.19
272264.
70 245862.78
69764.7
0
49617.6
5
b). Reapportion of the cost of service department into the three production departments
Secondary distribution
Producti
on
Service
departm
ent
Basis of
allocation
Total in
(£) Machine X
Machin
e Y (£)
Assembly
1 (£)
Stores
(£)
Mainten
ance (£)
Primary distribution
(Earlier table)
103500
0.00 314490.19
272264.
70 245862.78
69764.7
0
49617.6
5
Stores
Direct
material 34882.35
26161.7
6 8720.59 69764.7 -
Maintenance
Direct
machine
hours 23816.47
15877.6
5 9923.53 -
49617.6
5
1.4 Calculation of overhead absorption rate using direct labor hours
Table 2: Calculation of overhead absorption rate using direct labor hours
Particular Production
Basis of
allocation
Total in
(£) Machine X Machine Y (£) Assembly 1 (£)
Primary
distribution
(Earlier table)
103500
0.00 314490.19 272264.70 245862.78
⊘ This is a preview!⊘
Do you want full access?
Subscribe today to unlock all pages.
Trusted by 1+ million students worldwide
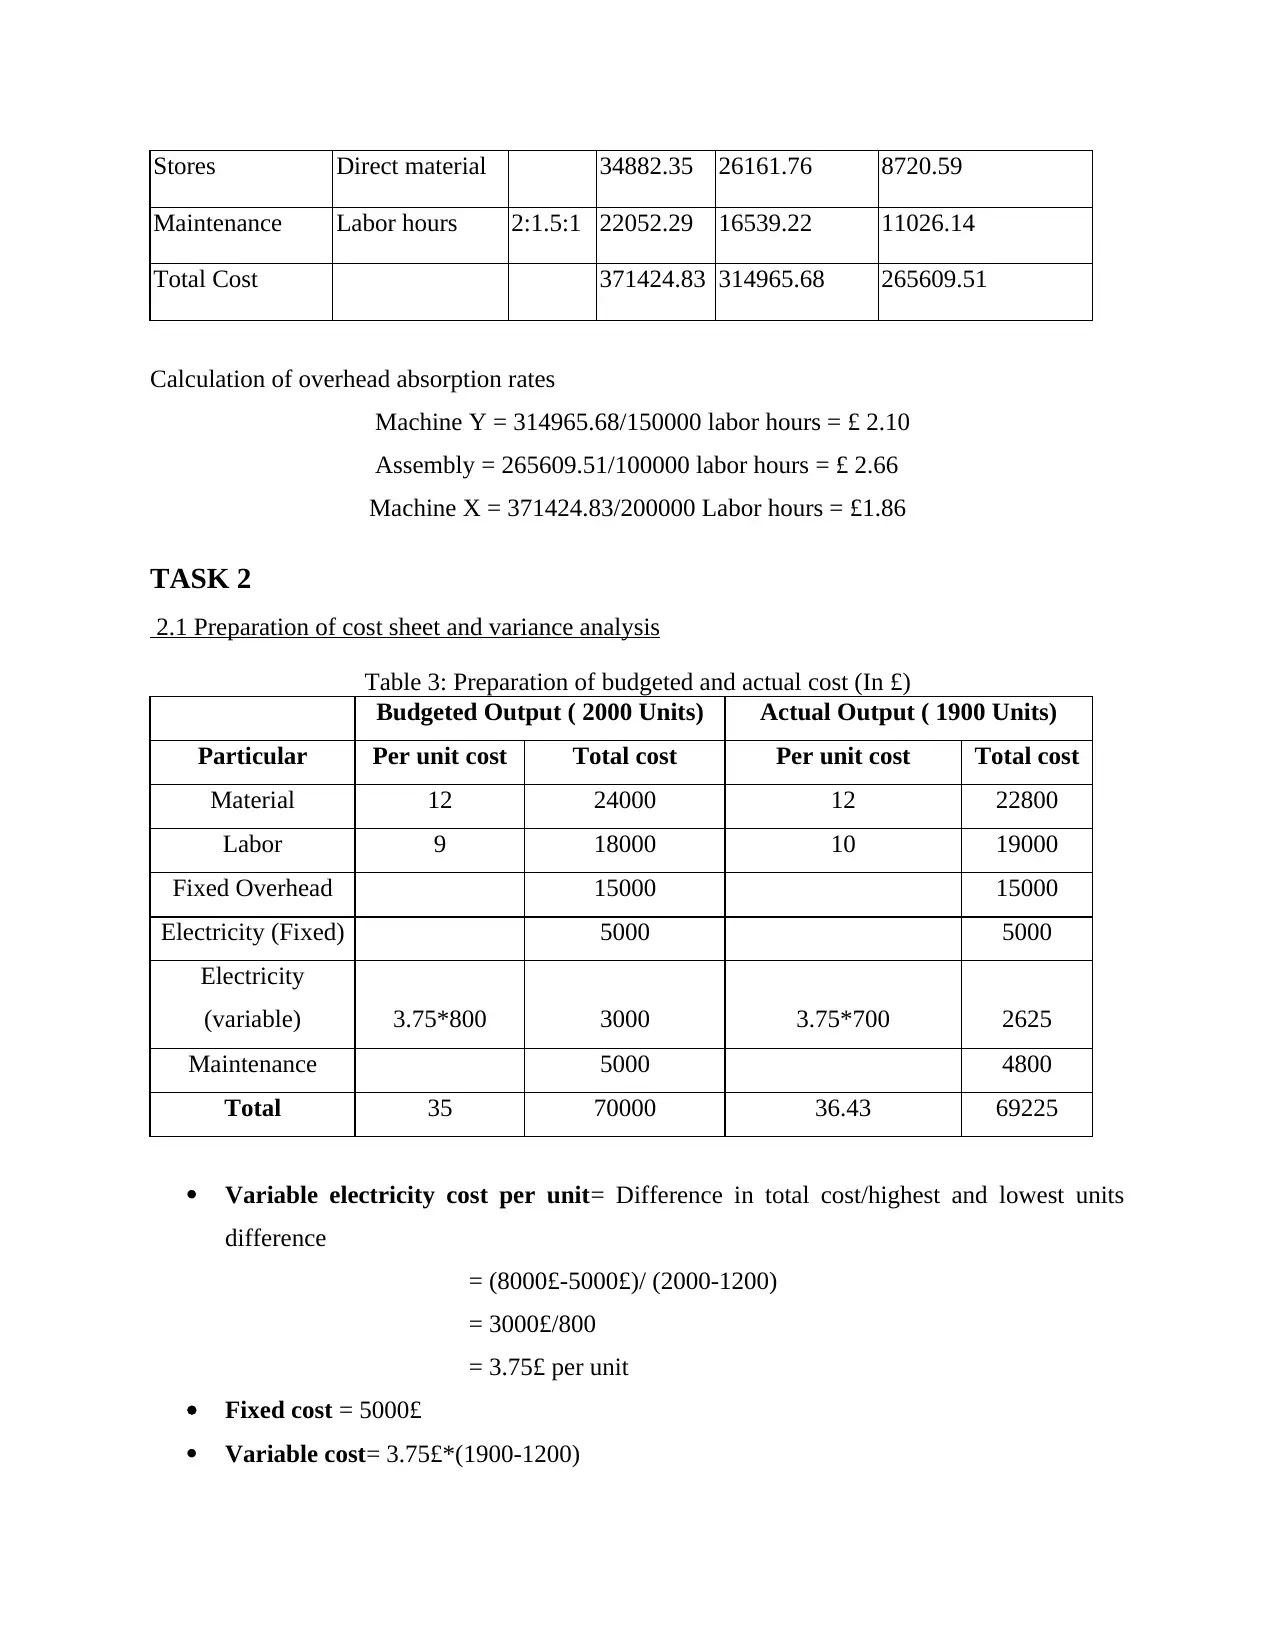
Stores Direct material 34882.35 26161.76 8720.59
Maintenance Labor hours 2:1.5:1 22052.29 16539.22 11026.14
Total Cost 371424.83 314965.68 265609.51
Calculation of overhead absorption rates
Machine Y = 314965.68/150000 labor hours = £ 2.10
Assembly = 265609.51/100000 labor hours = £ 2.66
Machine X = 371424.83/200000 Labor hours = £1.86
TASK 2
2.1 Preparation of cost sheet and variance analysis
Table 3: Preparation of budgeted and actual cost (In £)
Budgeted Output ( 2000 Units) Actual Output ( 1900 Units)
Particular Per unit cost Total cost Per unit cost Total cost
Material 12 24000 12 22800
Labor 9 18000 10 19000
Fixed Overhead 15000 15000
Electricity (Fixed) 5000 5000
Electricity
(variable) 3.75*800 3000 3.75*700 2625
Maintenance 5000 4800
Total 35 70000 36.43 69225
Variable electricity cost per unit= Difference in total cost/highest and lowest units
difference
= (8000£-5000£)/ (2000-1200)
= 3000£/800
= 3.75£ per unit
Fixed cost = 5000£
Variable cost= 3.75£*(1900-1200)
Paraphrase This Document
Need a fresh take? Get an instant paraphrase of this document with our AI Paraphraser
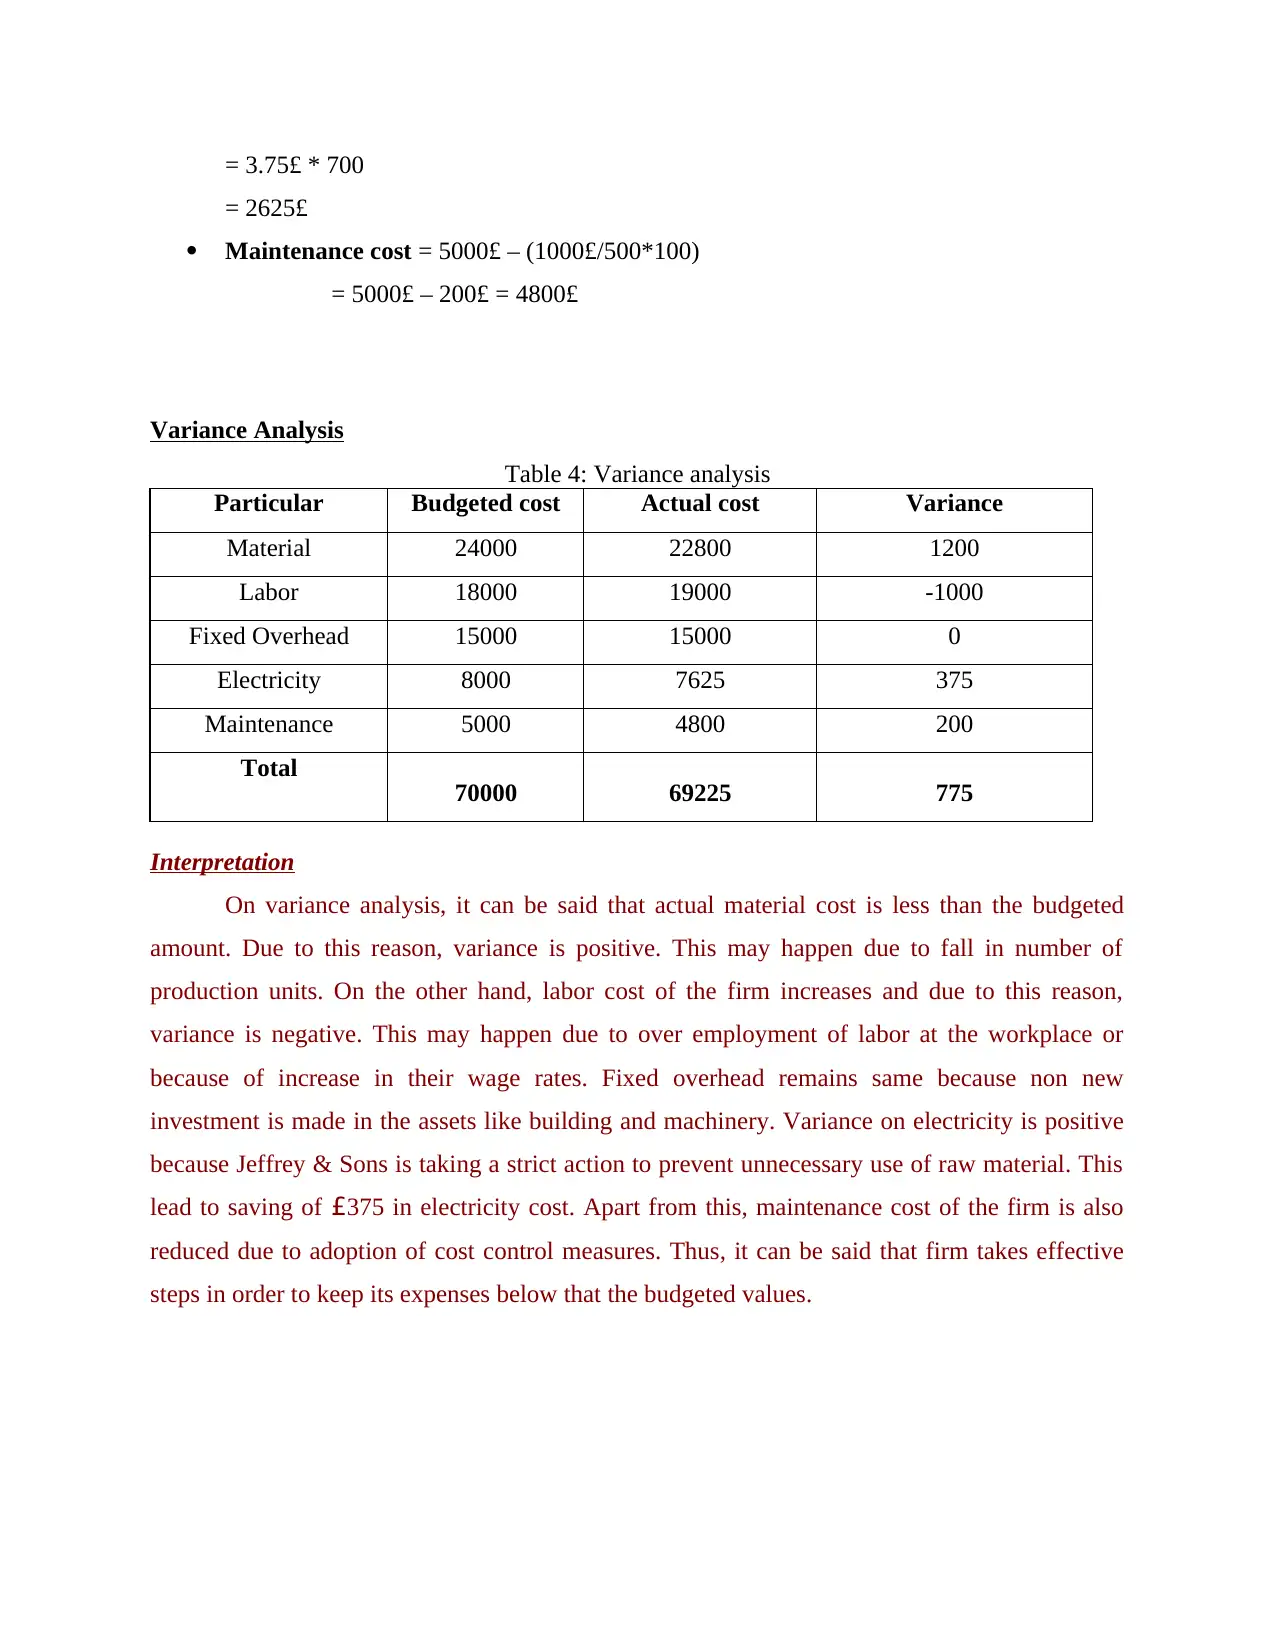
= 3.75£ * 700
= 2625£
Maintenance cost = 5000£ – (1000£/500*100)
= 5000£ – 200£ = 4800£
Variance Analysis
Table 4: Variance analysis
Particular Budgeted cost Actual cost Variance
Material 24000 22800 1200
Labor 18000 19000 -1000
Fixed Overhead 15000 15000 0
Electricity 8000 7625 375
Maintenance 5000 4800 200
Total 70000 69225 775
Interpretation
On variance analysis, it can be said that actual material cost is less than the budgeted
amount. Due to this reason, variance is positive. This may happen due to fall in number of
production units. On the other hand, labor cost of the firm increases and due to this reason,
variance is negative. This may happen due to over employment of labor at the workplace or
because of increase in their wage rates. Fixed overhead remains same because non new
investment is made in the assets like building and machinery. Variance on electricity is positive
because Jeffrey & Sons is taking a strict action to prevent unnecessary use of raw material. This
lead to saving of £375 in electricity cost. Apart from this, maintenance cost of the firm is also
reduced due to adoption of cost control measures. Thus, it can be said that firm takes effective
steps in order to keep its expenses below that the budgeted values.
2.2 Various performance indicators used to identify the areas of potential improvements
In order to measure the company’s performance on various platforms, performance
indicators are prepared by the managers. Some of the performance indicators that Jeffrey & Sons
can use are given as below: Profit- Profit is a point in company’s performance which gets changed with the change in
the firm’s way of management of activities. It means that in an organization, many
operations are performed like logistics, administration and cash management, etc. With
the change in all these things, firm’s turnover gets changed. Jeffery & Sons is in a
manufacturing sector and it is producing as well as selling goods in the market. For this,
it needs to transport the goods for which it pays a particular cost (Gunny, 2010). If it uses
transportation technique then it can identify a short route through which it can transport
its goods. The result of this effort will be that transportation cost will be reduced by some
percentage. Hence, it can be said that reduction in transportation cost will increase the
firm’s turnover to some extent. Due to this reason, turnover is taken as performance
indicator by most of the firms. Turnover- Turnover is another parameter that is used by the firms as a performance
indicator. In a year, firm makes many efforts that lead to increase in sales of the
organization (Greenwood and Suddaby, 2006). Jeffery & Sons can use social media in
order to increase the sale of its product. Along with this, it can also increase its sales
force size and can increase contact with the end users. This may also elevate the sales of
firm’s product. Hence, if these efforts will be made in a proper manner then it can be said
that sales of the firm will increase. Hence, it can be said that turnover is an important
performance indicator that can be used by the firm in order to measure its performance.
Customer satisfaction- This is another parameter that is commonly used by the firm
specially those who sale products to the general public. Many times, firms use some
different promotional techniques or introduce some features on the product (Francis and
Yu, 2009). In order to measure the effectiveness of newly made efforts, customer
satisfaction is used as an important parameter by the firm. Due to this reason, customer
satisfaction is commonly used by the firms in order to measure the effectiveness of
improvements that are newly made in the product.
⊘ This is a preview!⊘
Do you want full access?
Subscribe today to unlock all pages.
Trusted by 1+ million students worldwide
2.3 Ways to reduce cost, enhance value and quality
In order to reduce the cost, Jefferey & Sons can take many steps. It can make an effort
that will lead to generation of economies of scale. In respect to this, it can analyze its production
operations. On analysis of these operations, lots of unnecessary activities will be identified that
are increasing the cost of the firm and also elevating the completion time of task. After
identification of these unproductive tasks, firm will be in position to speed up its production cost
at a reduced production cost (Hillier, Grinblatt and Titman, 2011). This will lead to the
generation of economies of scale for the firm. In order to enhance the value of product, firm
needs to compare itself with other company’s products. By doing comparison, firm will be in
position to identify the areas where it can make improvement in its product. Thus, by making
necessary changes in the product, value can be improved Jeffery & sons. Quality is another area
where firm needs to give special attention and to improve the quality of product. It can carry out
research and development program (Francis, Reichelt and Wang, 2005). Under such kind of
activity, heavy investment will be made. But by organizing such kind of programs in the
organization, innovative changes can be made in the product. This will differentiate company’s
product from the same of competitor and will boost the sale of it as well.
Paraphrase This Document
Need a fresh take? Get an instant paraphrase of this document with our AI Paraphraser
TASK 3
3.1 Nature and purpose of budgeting process
Budget is a statement that covers targets or predictions done by the management.
Management makes an attempt to keep its performance nearby to the budgeted figures.
Budgeting process that most of the firms are following is given below. Determination of standard- In this stage a standard is determined against which actual
values of the budget is compared. These standards are determined by considering lots of
factors like past budget and performance regarding same as well as economic data. In
case of past budget firm evaluate figures that were determined in the budget and after that
it check the extent to which firm gives better performance. Performance on that budget
gives lot of inputs to the firm that can be used to prepare a budget (Hennes, Leone and
Miller, 2008). Firm must also evaluate economic conditions of the time period with
which budget is related. By doing all this work manager will come to know that in
specific economic condition to what level of performance it delivered in earlier stage.
Thus, on the basis of evaluation of current economic environment managers will be able
to predict changes that can take place in the components of the budget. Hence, entire
result of this effort will be that management will be able to prepare budget targets that are
possible to achieve in the specific economic environment. Measurement of the company performance- In this stage performance of the firm is
measured in terms of units or specific value (Henri, 2006). For example, performance of
Jefferey & sons can be measured in terms of sales in form of units that are sold in the
market. With due care managers must measure company performance because it is very
important stage of the budget control process. Comparison with standard- In this stage actual performance figures are compared with
the budgeted figures. By making comparison variance is identified which may be positive
of negative in nature. If variance is positive then there is no problem. But if variance is
negative then there is a matter of concern (Ogneva, Subramanyam and Raghunandan,
2007). In such kind of case, managers operating at middle level of management need to
identify possible causes of variance. By identifying variance managers further go in next
stage which is a final stage of budget process.
Taking corrective action- In this stage corrective actions are taken against that variance
which is negative in nature. These actions are taken in order to make sure that such kind
of mistakes due to which negative variance come in existence will not be committed
again at the workplace.
Process for preparing a budget Gather information- This is the first step in preparing a budget under which all relevant
information's are gathered related to income and expenditures that a firm may earn and
incur in upcoming time period. This information's can be gathered from company internal
sources like past income statements etc. Recording all sources of income- After collection of data all sources of income are
determined from which firm can earn revenue. These sources may be sales and income
from investments. Creating a list of monthly income- In this stage a list of monthly income is prepared
which can be earned in upcoming months. This estimate is made on the basis of past data
and growth rate of sales. By taking average growth rate projections for upcoming months
are prepared. Estimating expenses- In this stage all expenses are estimated on the basis of past growth
rate of expenses. Like income in case of expenses also projections are made. Hence, it
can be said that, method of projection is same in case of income and expenses. Preparing a final budget- In this last stage a budget is prepared in which all incomes and
expenses are placed in a budget in proper manner. In this regard firstly, all incomes are
shown in the budget and after that all expenses are shown in the budget. Hence, in this
way budget is prepared by the managers.
Purpose of budget
The main purpose of the budget is to ensure that expenses of the firm will remain in
control of the management. In other words, it can be said that the main objective of the budget is
to manage activities in a proper manner within predetermined standard. This budget is also used
to motivate employees to work hard for welfare of an organization (Easterby-Smith, Thorpe, and
Jackson, 2012). These standards acts as target for the employees and due to this reason they get
motivated to make efforts that helps an organization to achieve its objective. Hence, it can be
said that budget helps organization in achieving its objective.
⊘ This is a preview!⊘
Do you want full access?
Subscribe today to unlock all pages.
Trusted by 1+ million students worldwide
1 out of 21
Related Documents


Your All-in-One AI-Powered Toolkit for Academic Success.
+13062052269
info@desklib.com
Available 24*7 on WhatsApp / Email
![[object Object]](/_next/static/media/star-bottom.7253800d.svg)
Unlock your academic potential
Copyright © 2020–2026 A2Z Services. All Rights Reserved. Developed and managed by ZUCOL.