University Data Analysis and Numeracy Assignment: Rome Humidity Study
VerifiedAdded on 2023/01/16
|9
|1455
|32
Homework Assignment
AI Summary
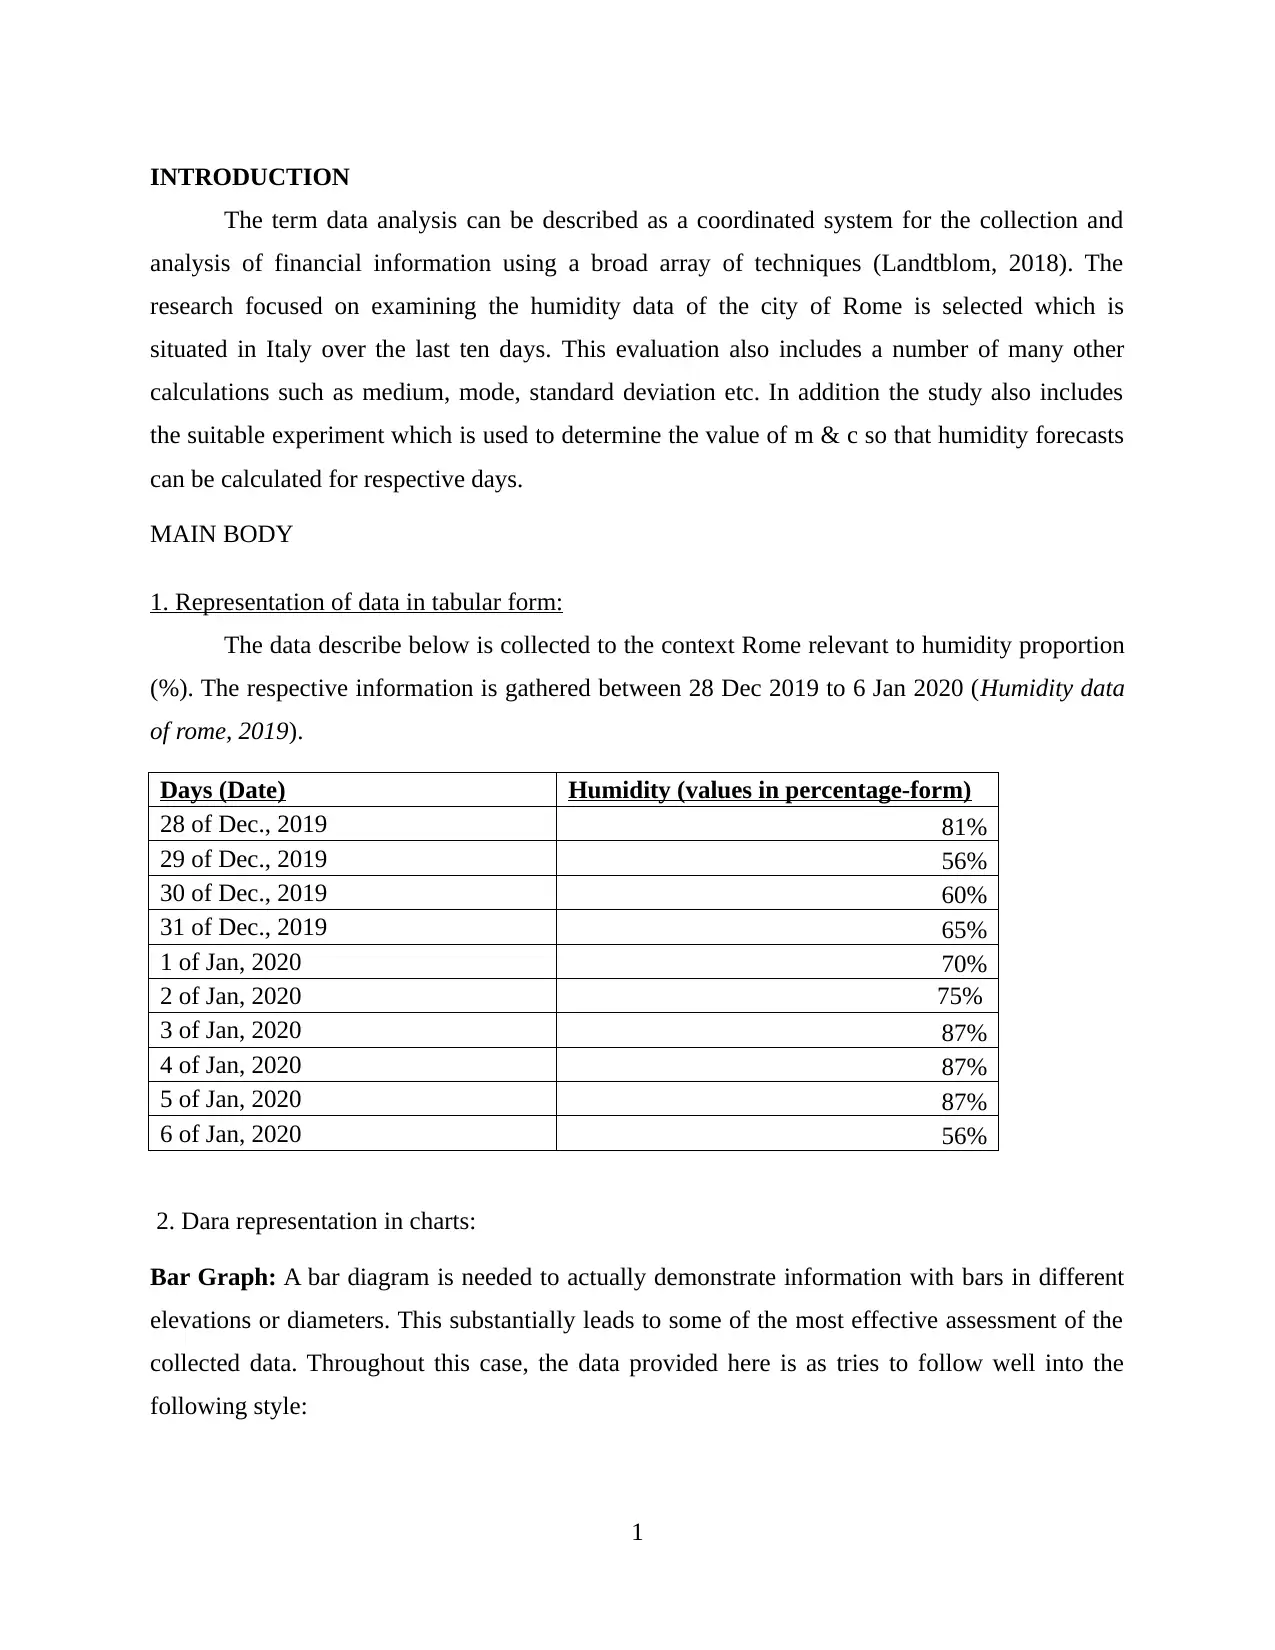
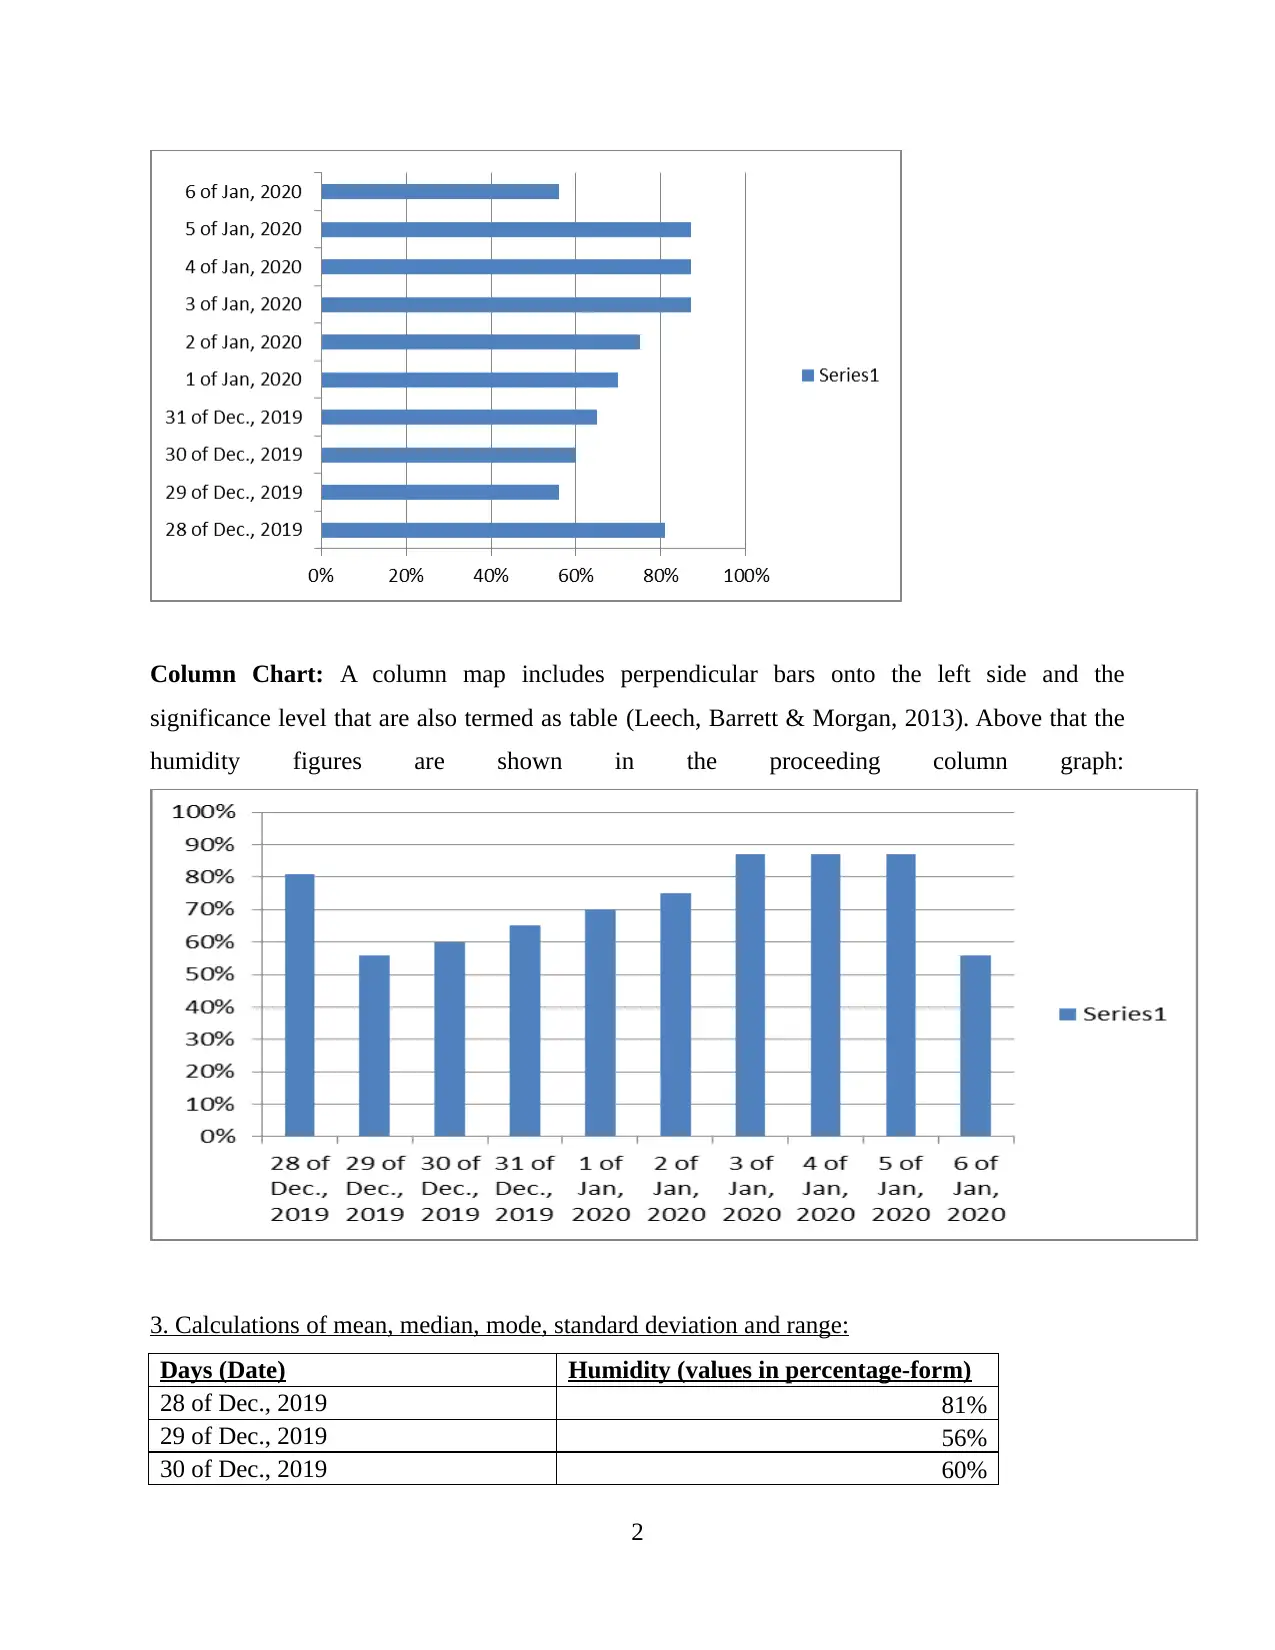
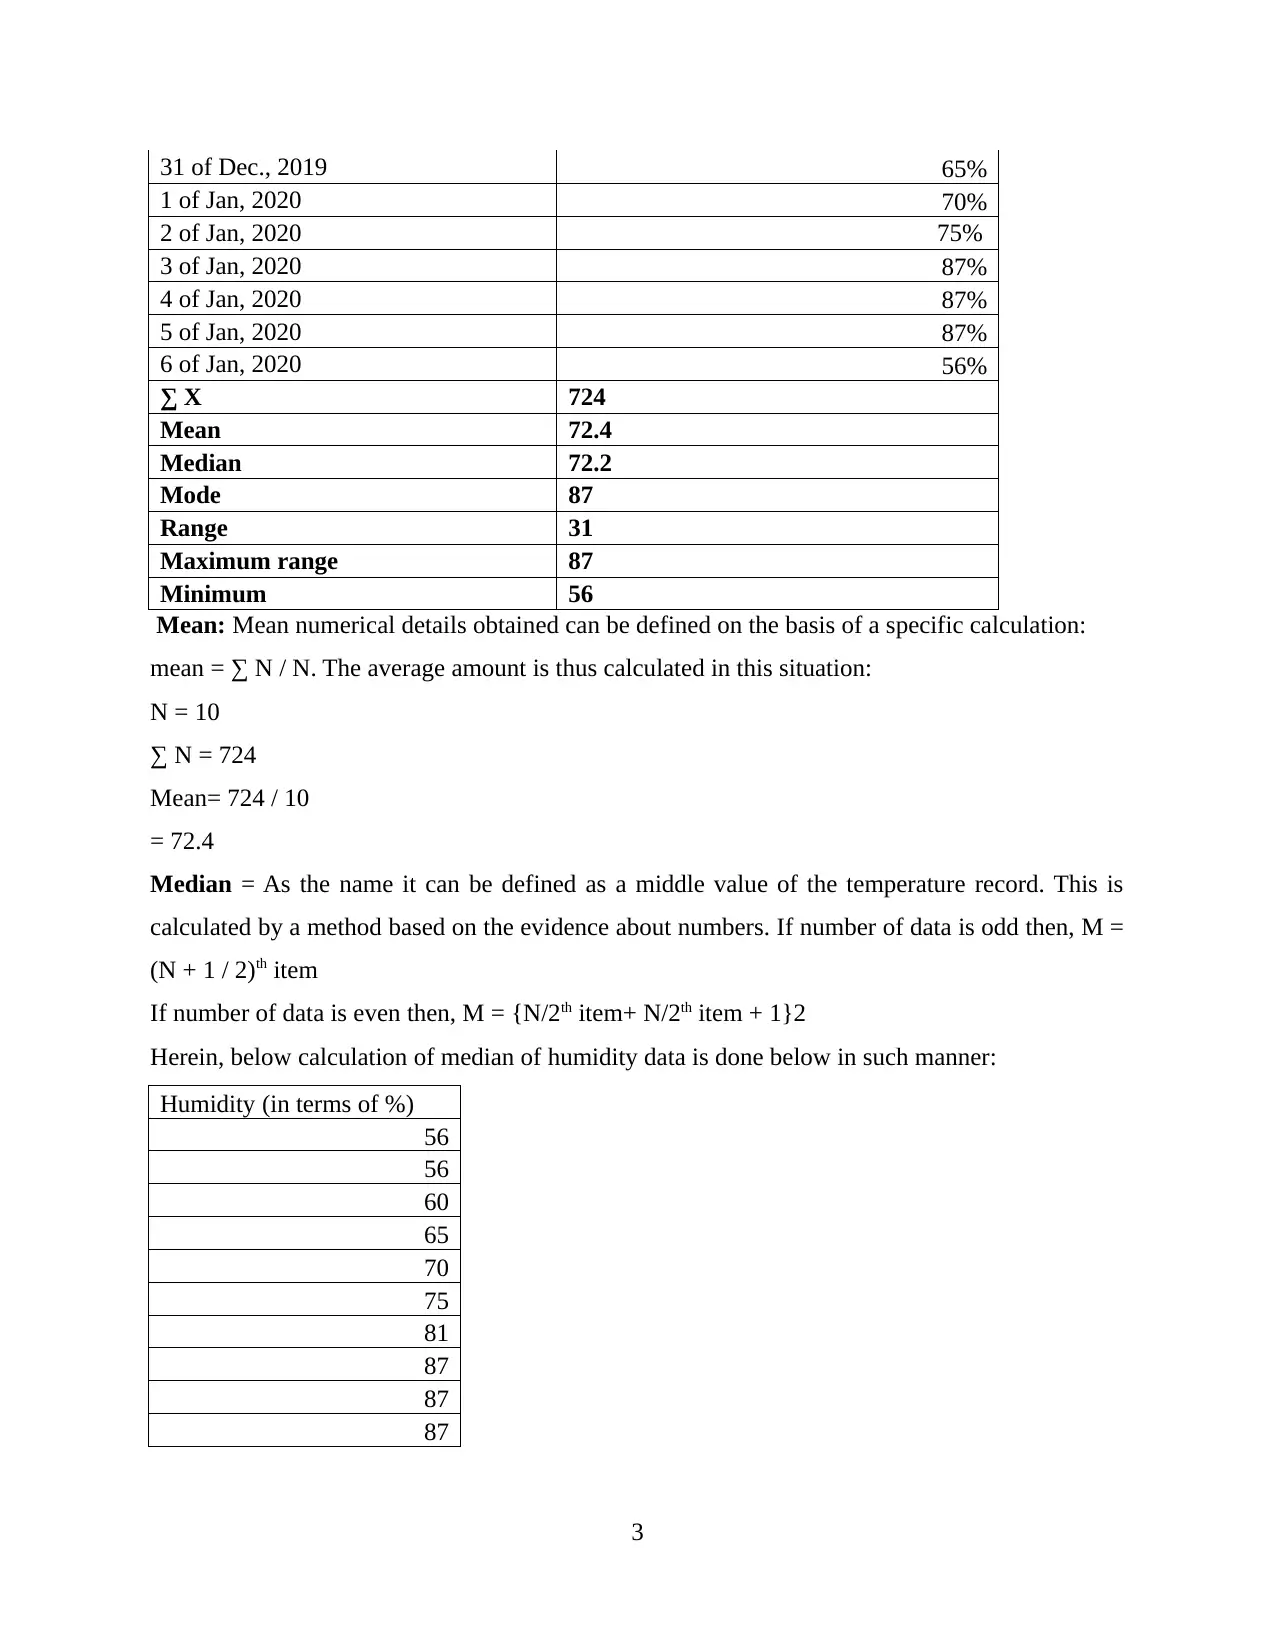
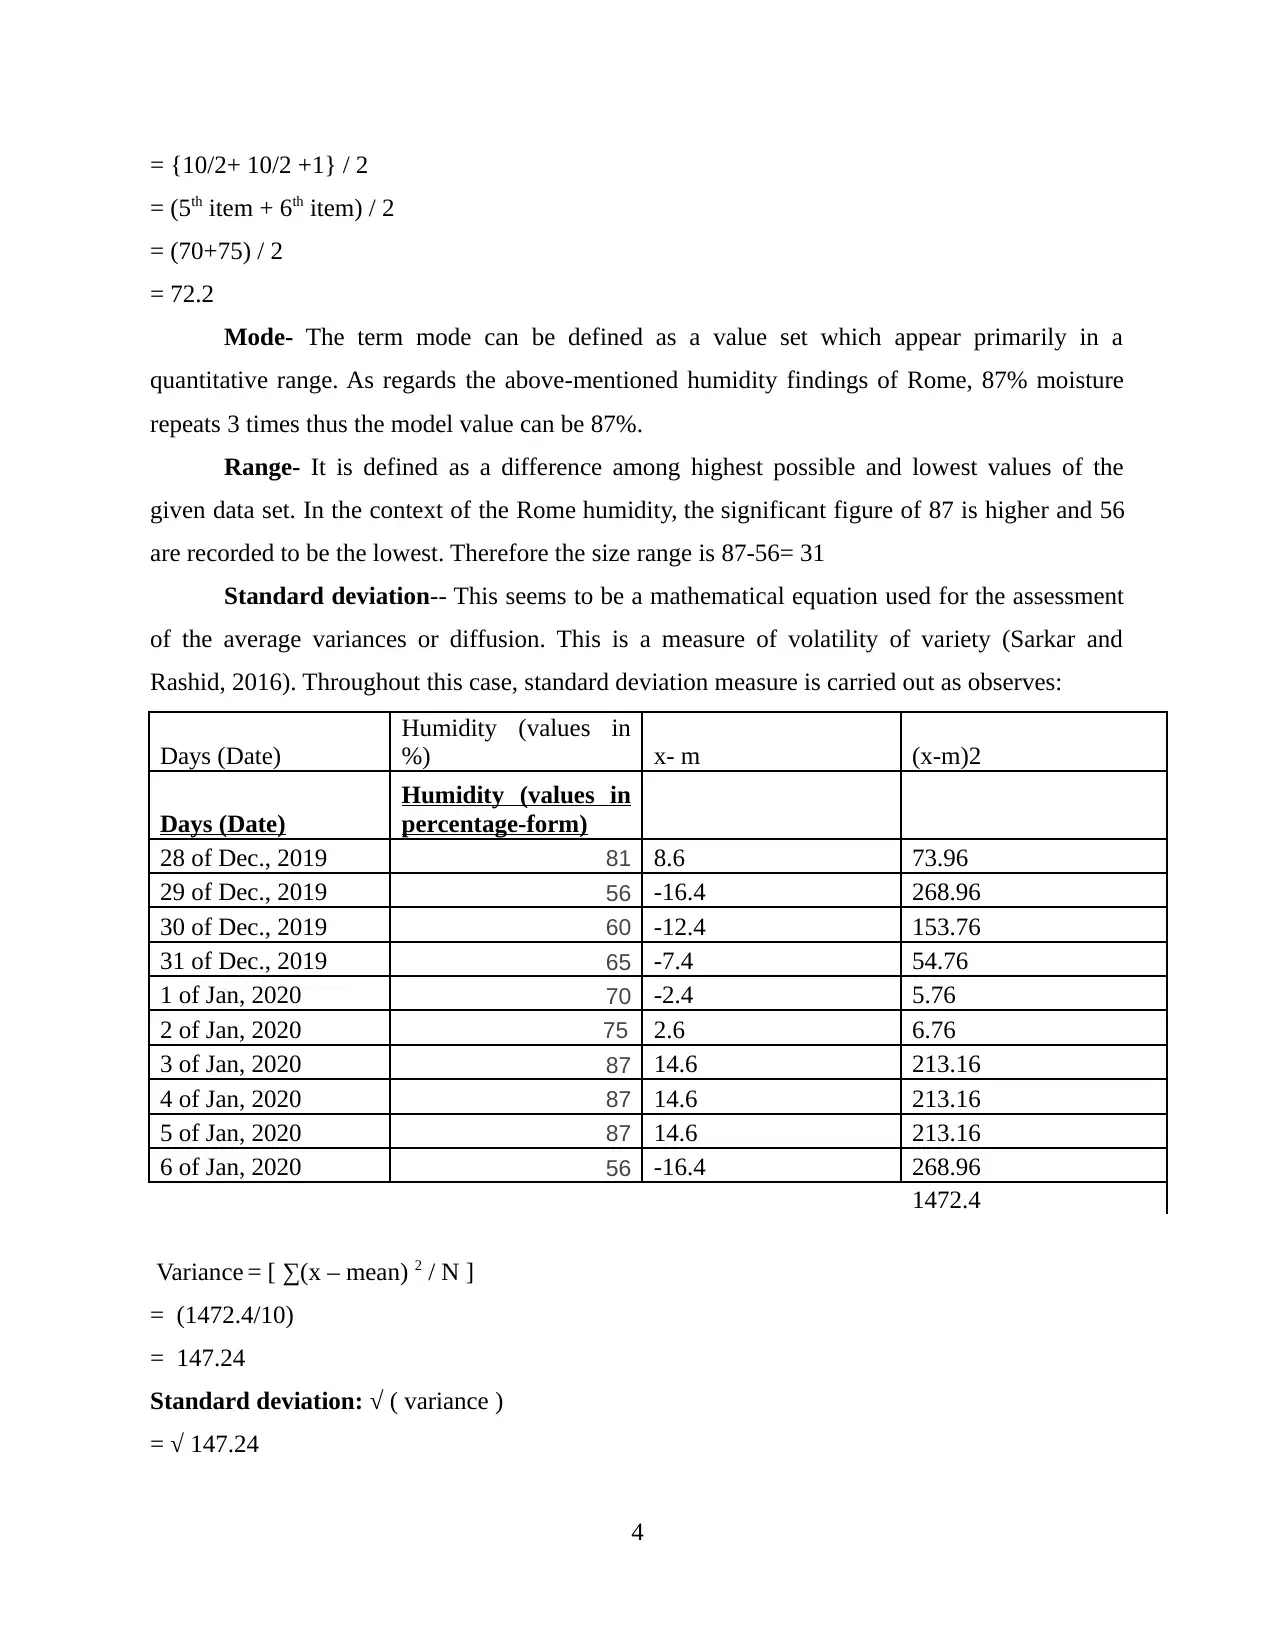
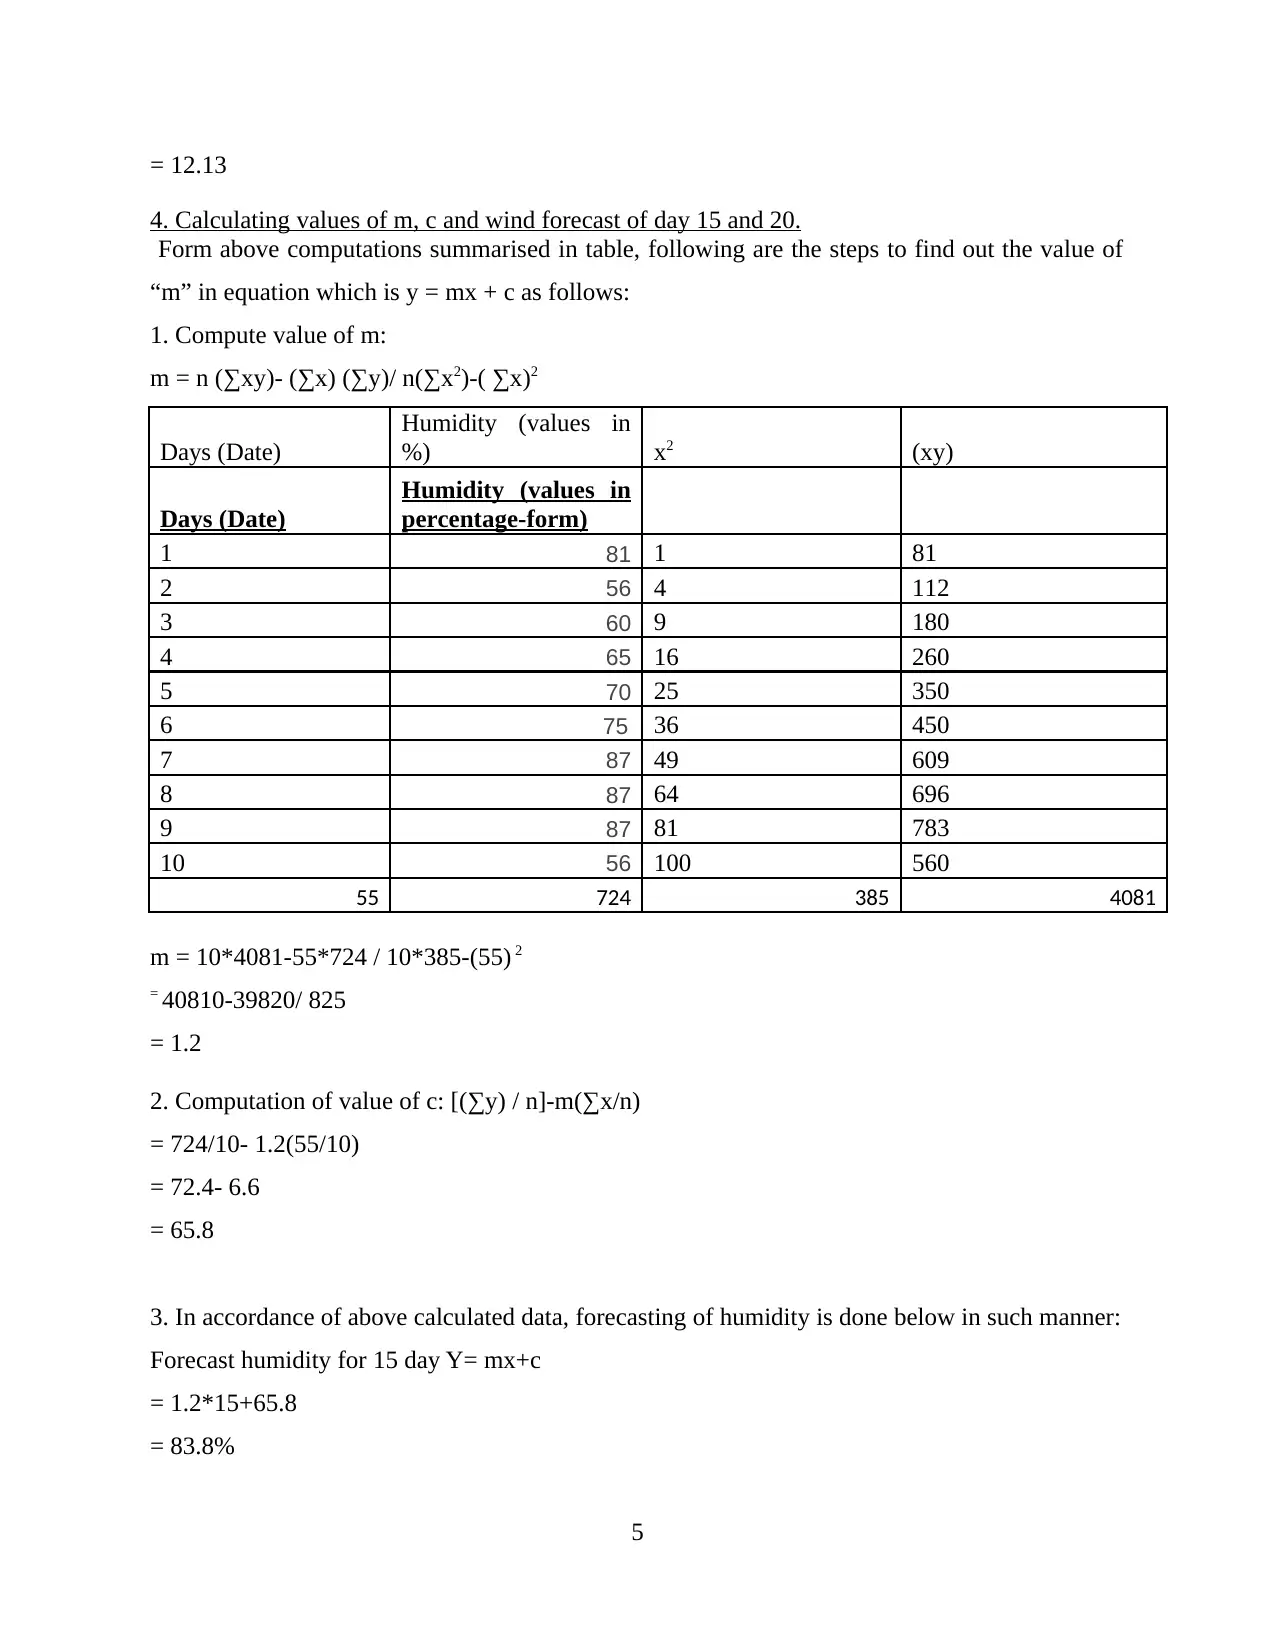
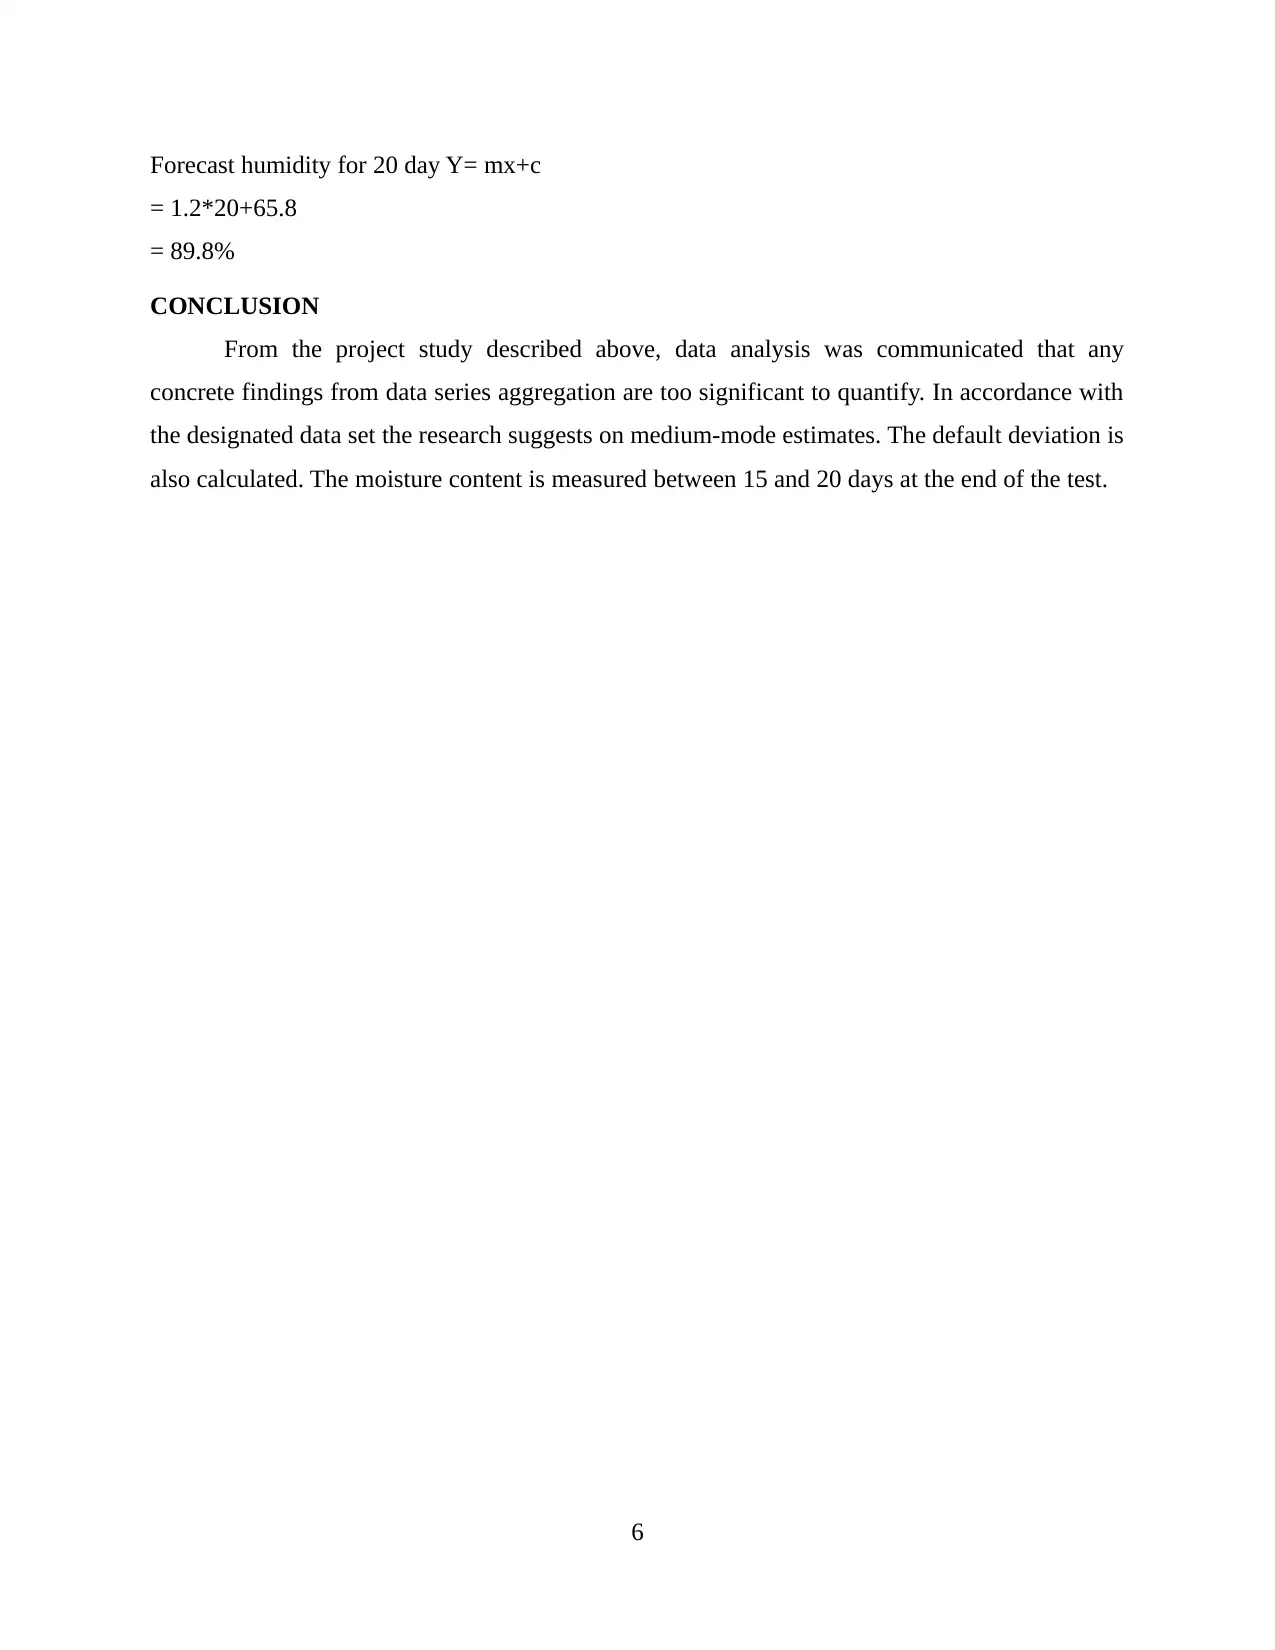
This assignment provides a detailed analysis of humidity data in Rome, Italy, collected over a ten-day period. It begins with representing the data in tabular form and then visualizes it using bar and column charts. The core of the assignment involves calculating key statistical measures including the mean, median, mode, range, and standard deviation of the humidity data. Furthermore, the assignment explores the relationship between the days and humidity to determine the values of 'm' and 'c' in a linear equation, enabling the forecasting of humidity levels for days 15 and 20. The solution demonstrates the application of these statistical methods to real-world data and concludes with a summary of the findings.
1 out of 9
Related Documents


Your All-in-One AI-Powered Toolkit for Academic Success.
+13062052269
info@desklib.com
Available 24*7 on WhatsApp / Email
![[object Object]](/_next/static/media/star-bottom.7253800d.svg)
Copyright © 2020–2026 A2Z Services. All Rights Reserved. Developed and managed by ZUCOL.