logo

Business decision making table of contents introduction 3 TASK 13

Understand the regulatory framework for financial reporting and be able to prepare financial statements from complete or incomplete records

22 Pages4215 Words491 Views
   

Added on  2020-01-28

About This Document

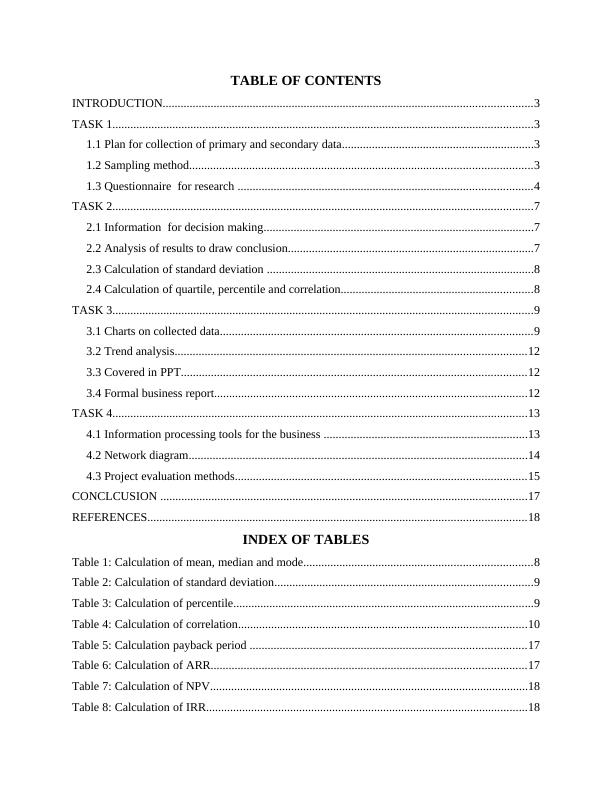
BUSINESS DECISION MAKING TABLE OF CONTENTS INTRODUCTION 3 TASK 13 1.1 Plan for collection of primary and secondary data 3 1.2 Sampling method 3 1.3 Questionnaire for research4 TASK 27 2.1 Information for decision making 7 2.2 Analysis of results to draw conclusion7 2.3 Calculation of standard deviation8 2.4 Calculation of quartile, percentile and correlation 8 TASK 39 3.1 Charts on collected data 9 3.2 Trend analysis 12 3.3 Covered in PPT 12 3.4 Formal business report12 TASK 413 4.1 Information processing tools for the

Business decision making table of contents introduction 3 TASK 13

Understand the regulatory framework for financial reporting and be able to prepare financial statements from complete or incomplete records

   Added on 2020-01-28

ShareRelated Documents
BUSINESS DECISIONMAKING
Business decision making table of contents introduction 3 TASK 13_1
TABLE OF CONTENTSINTRODUCTION...........................................................................................................................3TASK 1............................................................................................................................................31.1 Plan for collection of primary and secondary data................................................................31.2 Sampling method..................................................................................................................31.3 Questionnaire for research ..................................................................................................4TASK 2............................................................................................................................................72.1 Information for decision making..........................................................................................72.2 Analysis of results to draw conclusion..................................................................................72.3 Calculation of standard deviation .........................................................................................82.4 Calculation of quartile, percentile and correlation................................................................8TASK 3............................................................................................................................................93.1 Charts on collected data........................................................................................................93.2 Trend analysis.....................................................................................................................123.3 Covered in PPT...................................................................................................................123.4 Formal business report........................................................................................................12TASK 4..........................................................................................................................................134.1 Information processing tools for the business ....................................................................134.2 Network diagram.................................................................................................................144.3 Project evaluation methods.................................................................................................15CONCLCUSION ..........................................................................................................................17REFERENCES..............................................................................................................................18INDEX OF TABLESTable 1: Calculation of mean, median and mode............................................................................8Table 2: Calculation of standard deviation......................................................................................9Table 3: Calculation of percentile....................................................................................................9Table 4: Calculation of correlation................................................................................................10Table 5: Calculation payback period ............................................................................................17Table 6: Calculation of ARR.........................................................................................................17Table 7: Calculation of NPV..........................................................................................................18Table 8: Calculation of IRR...........................................................................................................18
Business decision making table of contents introduction 3 TASK 13_2
ILLUSTRATION INDEXIllustration 1: People preferences on dishes...................................................................................11Illustration 2: People response on factors they often consider while making pricing decisions...12Illustration 3: Trend analysis chart................................................................................................13Illustration 4: GANTT chart..........................................................................................................15Illustration 5: Network diagram.....................................................................................................16
Business decision making table of contents introduction 3 TASK 13_3
INTRODUCTIONIn today business world managers are giving great importance to the use of statistical toolas it help in analyzing business conditions in legitimate way. They usually apply statistical toolslike correlation, standard deviation and percentile on available data and make business decisions.In this report these mentioned tools are applied practically on the data. Apart from this, methodslike NPV and IRR are used to identify best viable project for the firm which is taken in the reportunderstanding broad application of the mentioned tools. At end CPM diagram is also enclosedand sequence for performance of activities is determined.TASK 11.1 Plan for collection of primary and secondary dataIt is inevitable to collect both sort of data because both help in understanding researchtopic in much better way. Primary data refers to data that is gathered by one at his own level. Onother hand, secondary data indicate the facts and figures that are already collected by some oneand are printed in books and journals. There is significance of both type of data in relation toperformance of research. It has been find out that researchers often collect secondary data beforeconducting a research because be evaluating various literature's they comes to know aboutvarious things that happened in past related to research topic (Blake and Isard, 2012). Such kindof knowledge of research topic help an individual in determining a direction in which researchmust be conducted. Hence, it can be said that understanding of secondary data help an individualin drafting a questionnaire for the research. Hence, it can be said that there is great significanceof primary and secondary data in research. As per plan prepared from sources like books andmagazines relevant facts and figures will be collected by the researcher. On other hand, forcollecting new facts and figures questionnaire will be circulated between 50 people that live inthe London. These ways will be followed to collect data for the research.1.2 Sampling methodThere are many sampling methods and some of them are described below.Simple random sampling- This is widely used methods of sampling and under this allsampling units are taken on random basis from population. This method can be easilyused by any person. Simple random sampling method is used in any research when fordata collection specific type of respondents are not required.
Business decision making table of contents introduction 3 TASK 13_4
Stratified random sampling- Under this method all sampling units are taken by dividingpopulation in several parts. From these sub divisions of population sample units are takenby the researcher. Hence, this method is appropriate for research because by using samedata can be collected from different type of people in relation to present study.Convenience sampling- This is a method in which one according to his comfort takesample units from sample (Ackermann, 2012). This method is used by many researchersinstead of simple random sampling.Cluster sampling-In this technique specific area is separated in various parts. Allsample units are picked up from these divided areas. The mentioned technique can not beemployed in the research because for research specific type of respondents are requiredthat vary from each other in terms of demographic features. 1.3 Questionnaire for research Name : ___________________Age : ____________________Marital statusMarriedUnmarriedTransgenderGenderMaleFemaleTransgender1. In which of following category of income below given you fall.2000 - 30003100 - 40004100- 5000More than 5000 2. How many times you visit to Murano restaurant in a month?1- 2 3 - 4 5 - 6
Business decision making table of contents introduction 3 TASK 13_5
Greater than 6 times3. When you go to the Murano restaurant for lunch or dinner how many times you place orderfor food items?12 3 More than 3 time4. Which type of dishes given below you prefers for lunch or dinner?EuropeanItalianMexicanChinese5. Which of these factors you highly consider for taking lunch or dinner at restaurant?PriceTasteStaff serviceWaiting time6. Do you think that Murano restaurant is providing products at high price.Yes
Business decision making table of contents introduction 3 TASK 13_6

End of preview

Want to access all the pages? Upload your documents or become a member.

Related Documents
Unit 6 Business Decision Making Tools : Assignment
|20
|4335
|88

Research Design and Methodology - Report
|22
|4296
|82

Business Decision Making Assignment(pdf)
|27
|5399
|109

Business Decision Making Assignment TESCO
|26
|6333
|54

BUSINESS DECISION MAKING TABLE OF CONTENTS INTROUCTION 3 TASK 13
|21
|4914
|433

Statistical Tools Report - Morrison
|24
|4790
|51