Data Analysis and Visualization Techniques
VerifiedAdded on 2020/01/07
|23
|5221
|175
Homework Assignment
AI Summary
This assignment focuses on understanding and applying data analysis and visualization techniques. It involves analyzing provided datasets, calculating descriptive statistics (mean, median, mode, range), and creating different types of visualizations such as column graphs, line graphs, and bar graphs to represent the data effectively. The goal is to demonstrate the ability to interpret data trends and communicate insights through clear and informative visuals.
Contribute Materials
Your contribution can guide someone’s learning journey. Share your
documents today.
Business Decision
Making
Making
Secure Best Marks with AI Grader
Need help grading? Try our AI Grader for instant feedback on your assignments.
TABLE OF CONTENTS
INTRODUCTION...........................................................................................................................3
Task 1...............................................................................................................................................3
A...................................................................................................................................................3
B...................................................................................................................................................4
C...................................................................................................................................................5
TASK 2............................................................................................................................................6
A...................................................................................................................................................6
B...................................................................................................................................................7
C...................................................................................................................................................8
TASK 3............................................................................................................................................9
A...................................................................................................................................................9
B.................................................................................................................................................14
C.................................................................................................................................................15
D.................................................................................................................................................15
TASK 4 .........................................................................................................................................16
A.................................................................................................................................................16
B.................................................................................................................................................18
CONCLUSION .............................................................................................................................19
REFERENCES..............................................................................................................................20
INTRODUCTION
Business decision making plays important role in success of the business under which
corporation focuses upon determining long run growth. It includes different aspects such as
project management, statistical tools and survey as well as investment appraisal techniques for
drawing valid outcome. Present report is based on case scenario of Thomas cook which is
suffering from the issue of lower profitability. Owing to this, focus has been laid on
understanding the preferences of buyers to product appropriate product and services as per their
expectations. Furthermore, information related to sales and profit is assessed and then focusing is
done for future time span. In addition to this, project management techniques are applied along
with investment appraisal tools. It helps management of business to select the best proposal in a
cost effective manner so as to recovers cost of production and increase overall rate of return.
TASK 1
A
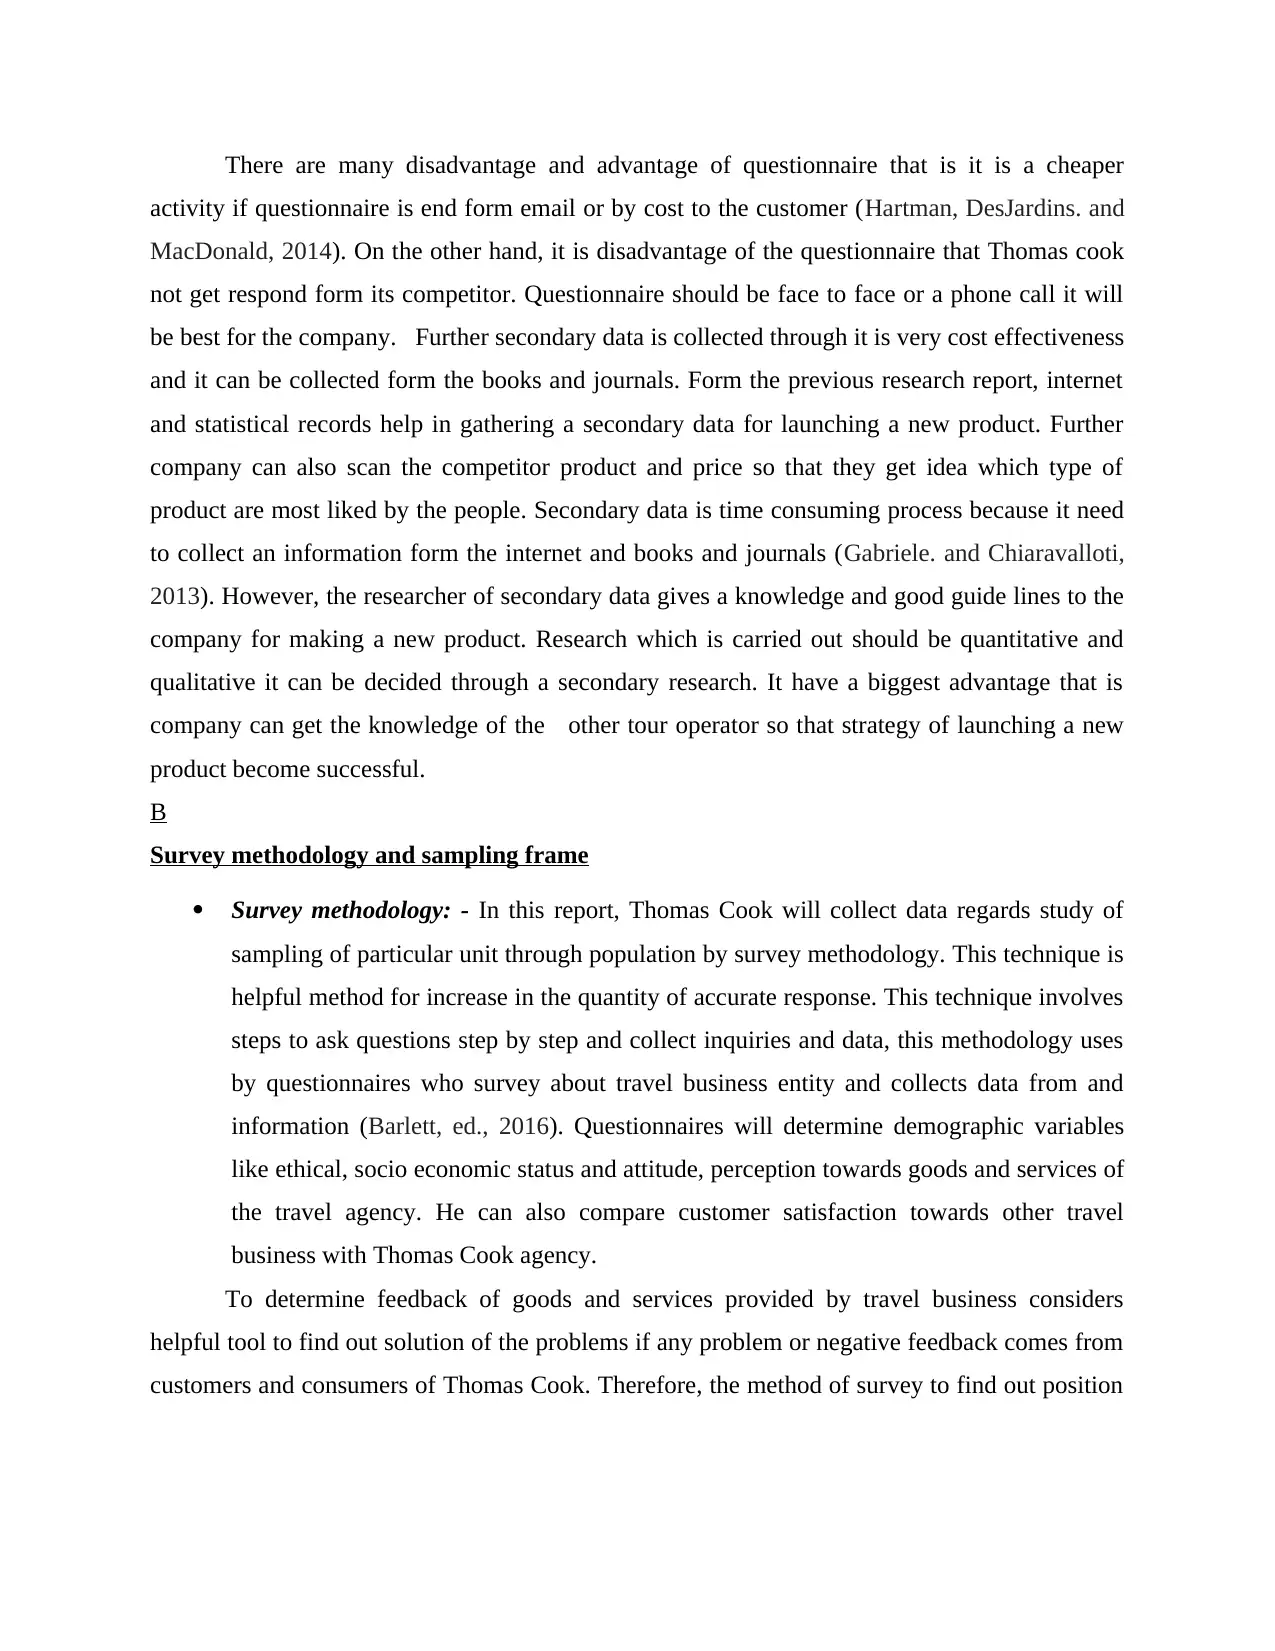
According to the given scenario, Thomas cook appointed a consultant to advice the
product development team. It want to launch a new product on the basis of emerging market
trends, customer preferences (Pettigrew, 2014). For this purpose, some primary data and
secondary data is collected on the basis of consumer profile, preferences, attitude, and buying
behavior as well as competitor products.
For gathering a primary data is normally in the form of survey, interview, questionnaire
etc. it can be in the form face to face by phone call, by internet and or through email. There is
also a form a data collection is a market research in this a sample product is placed in store for
determining the demand. These all methods are common and useful for the Thomas cook. For
launching a new product company will use questionnaire method for knowing the customer
preferences. Primary data is collected by observing a customer related to the products.
Questionnaire which was prepared is send to customer through email or by face to face contact
and by social networking websites. Company collect a primary data thorough its customer in this
question are asked related to buying behavior, competitor products and their attitudes. In a
sequestration to question are asked their consumer profile is also required so that it can be stated
that form which type of consumer question were asked.
Business decision making plays important role in success of the business under which
corporation focuses upon determining long run growth. It includes different aspects such as
project management, statistical tools and survey as well as investment appraisal techniques for
drawing valid outcome. Present report is based on case scenario of Thomas cook which is
suffering from the issue of lower profitability. Owing to this, focus has been laid on
understanding the preferences of buyers to product appropriate product and services as per their
expectations. Furthermore, information related to sales and profit is assessed and then focusing is
done for future time span. In addition to this, project management techniques are applied along
with investment appraisal tools. It helps management of business to select the best proposal in a
cost effective manner so as to recovers cost of production and increase overall rate of return.
TASK 1
A
According to the given scenario, Thomas cook appointed a consultant to advice the
product development team. It want to launch a new product on the basis of emerging market
trends, customer preferences (Pettigrew, 2014). For this purpose, some primary data and
secondary data is collected on the basis of consumer profile, preferences, attitude, and buying
behavior as well as competitor products.
For gathering a primary data is normally in the form of survey, interview, questionnaire
etc. it can be in the form face to face by phone call, by internet and or through email. There is
also a form a data collection is a market research in this a sample product is placed in store for
determining the demand. These all methods are common and useful for the Thomas cook. For
launching a new product company will use questionnaire method for knowing the customer
preferences. Primary data is collected by observing a customer related to the products.
Questionnaire which was prepared is send to customer through email or by face to face contact
and by social networking websites. Company collect a primary data thorough its customer in this
question are asked related to buying behavior, competitor products and their attitudes. In a
sequestration to question are asked their consumer profile is also required so that it can be stated
that form which type of consumer question were asked.
There are many disadvantage and advantage of questionnaire that is it is a cheaper
activity if questionnaire is end form email or by cost to the customer (Hartman, DesJardins. and
MacDonald, 2014). On the other hand, it is disadvantage of the questionnaire that Thomas cook
not get respond form its competitor. Questionnaire should be face to face or a phone call it will
be best for the company. Further secondary data is collected through it is very cost effectiveness
and it can be collected form the books and journals. Form the previous research report, internet
and statistical records help in gathering a secondary data for launching a new product. Further
company can also scan the competitor product and price so that they get idea which type of
product are most liked by the people. Secondary data is time consuming process because it need
to collect an information form the internet and books and journals (Gabriele. and Chiaravalloti,
2013). However, the researcher of secondary data gives a knowledge and good guide lines to the
company for making a new product. Research which is carried out should be quantitative and
qualitative it can be decided through a secondary research. It have a biggest advantage that is
company can get the knowledge of the other tour operator so that strategy of launching a new
product become successful.
B
Survey methodology and sampling frame
Survey methodology: - In this report, Thomas Cook will collect data regards study of
sampling of particular unit through population by survey methodology. This technique is
helpful method for increase in the quantity of accurate response. This technique involves
steps to ask questions step by step and collect inquiries and data, this methodology uses
by questionnaires who survey about travel business entity and collects data from and
information (Barlett, ed., 2016). Questionnaires will determine demographic variables
like ethical, socio economic status and attitude, perception towards goods and services of
the travel agency. He can also compare customer satisfaction towards other travel
business with Thomas Cook agency.
To determine feedback of goods and services provided by travel business considers
helpful tool to find out solution of the problems if any problem or negative feedback comes from
customers and consumers of Thomas Cook. Therefore, the method of survey to find out position
Secure Best Marks with AI Grader
Need help grading? Try our AI Grader for instant feedback on your assignments.
of the product in market and feedback of goods and services in positive and negative way will
helpful tool for travel business (Barake, 2011).
Sampling frame: - As Thomas Cook is global wide spread travel business in United
Kingdom. To determine feedback towards goods and services remains quite difficult with each
and every individual of UK. So, questionnaires will select 50 individuals and take feedback by
questioning. These 50 individuals remains as sample and to make structure on the basis of their
attitude, perception and interest towards goods and services of Thomas Cook. It will be helpful
to make a framework of customers' opinion in both ways positive as well as negative (García-
Peñalvo. and Conde, 2014). Therefore, to prepare sampling frame in proper way will useful for
travel agency to provide extra facilities and solutions to solve out negative feedback. It will also
able to compare Thomas Cook with other travel trades and useful technique to predict its
position in competitive market of UK regarding travel business.
C
Questionnaire to carry out the survey with relevant instruments to reflect the required data.
1. How do you rate the product of Thomas Cook?
Outstanding
Satisfactory
Dissatisfactory
Other
2. Are you satisfied with the quality of products offered by the Thomas Cook?
Satisfactory
Unsatisfactory
3. Product of Thomas cook is better than others competitor products available in the market
Yes
No
4. Would you recommend the product of Thomas cook to friend, family and in social circle?
Yes
No
5. Price charged by the Thomas Cook is affordable by all type of people?
Yes
No
6. Price of product is reasonable of Thomas cook as compared to other tour operator products
Yes
No
7. Any recommendation for the improvement of the
product_______________________________________________________________________
____________________________
TASK 2
A
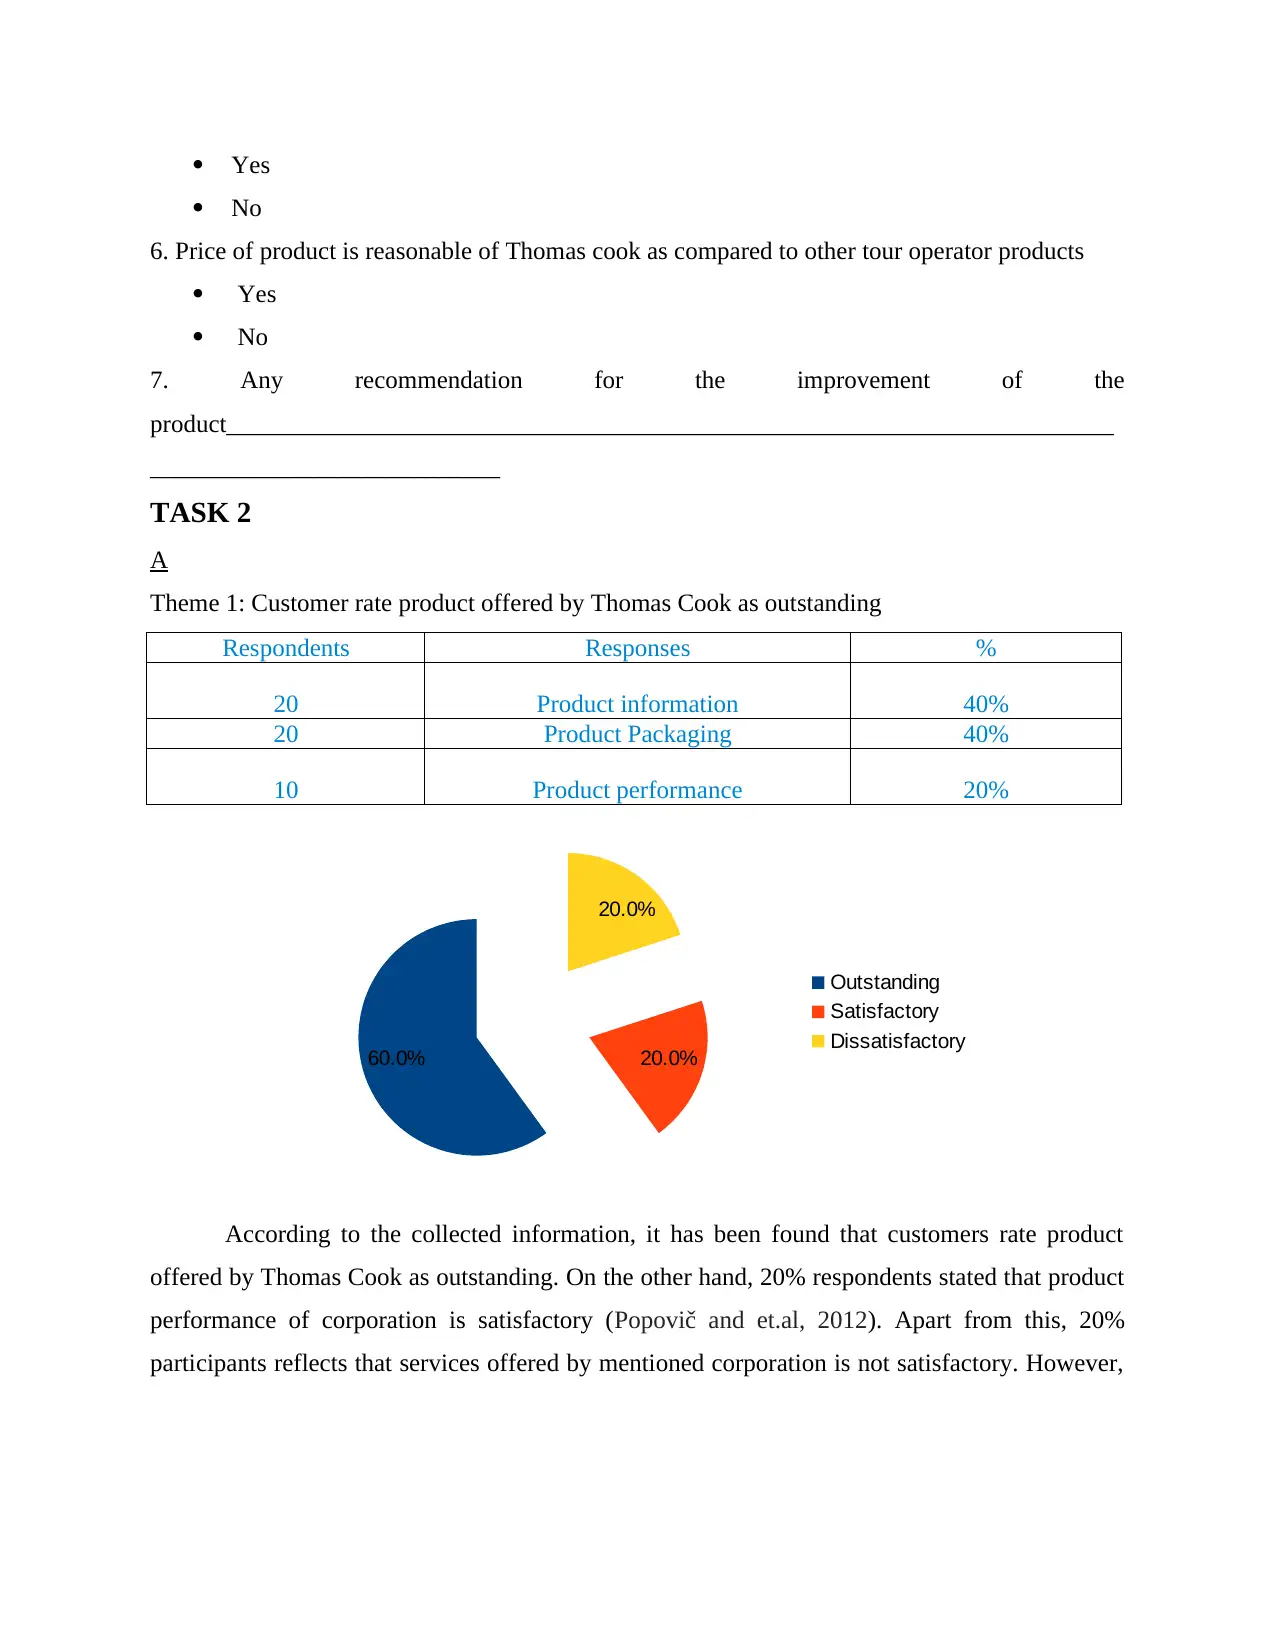
Theme 1: Customer rate product offered by Thomas Cook as outstanding
Respondents Responses %
20 Product information 40%
20 Product Packaging 40%
10 Product performance 20%
According to the collected information, it has been found that customers rate product
offered by Thomas Cook as outstanding. On the other hand, 20% respondents stated that product
performance of corporation is satisfactory (Popovič and et.al, 2012). Apart from this, 20%
participants reflects that services offered by mentioned corporation is not satisfactory. However,
60.0% 20.0%
20.0%
Outstanding
Satisfactory
Dissatisfactory
No
6. Price of product is reasonable of Thomas cook as compared to other tour operator products
Yes
No
7. Any recommendation for the improvement of the
product_______________________________________________________________________
____________________________
TASK 2
A
Theme 1: Customer rate product offered by Thomas Cook as outstanding
Respondents Responses %
20 Product information 40%
20 Product Packaging 40%
10 Product performance 20%
According to the collected information, it has been found that customers rate product
offered by Thomas Cook as outstanding. On the other hand, 20% respondents stated that product
performance of corporation is satisfactory (Popovič and et.al, 2012). Apart from this, 20%
participants reflects that services offered by mentioned corporation is not satisfactory. However,
60.0% 20.0%
20.0%
Outstanding
Satisfactory
Dissatisfactory
majority of respondents stated that services offered by corporation is good and meeting their
expectations.
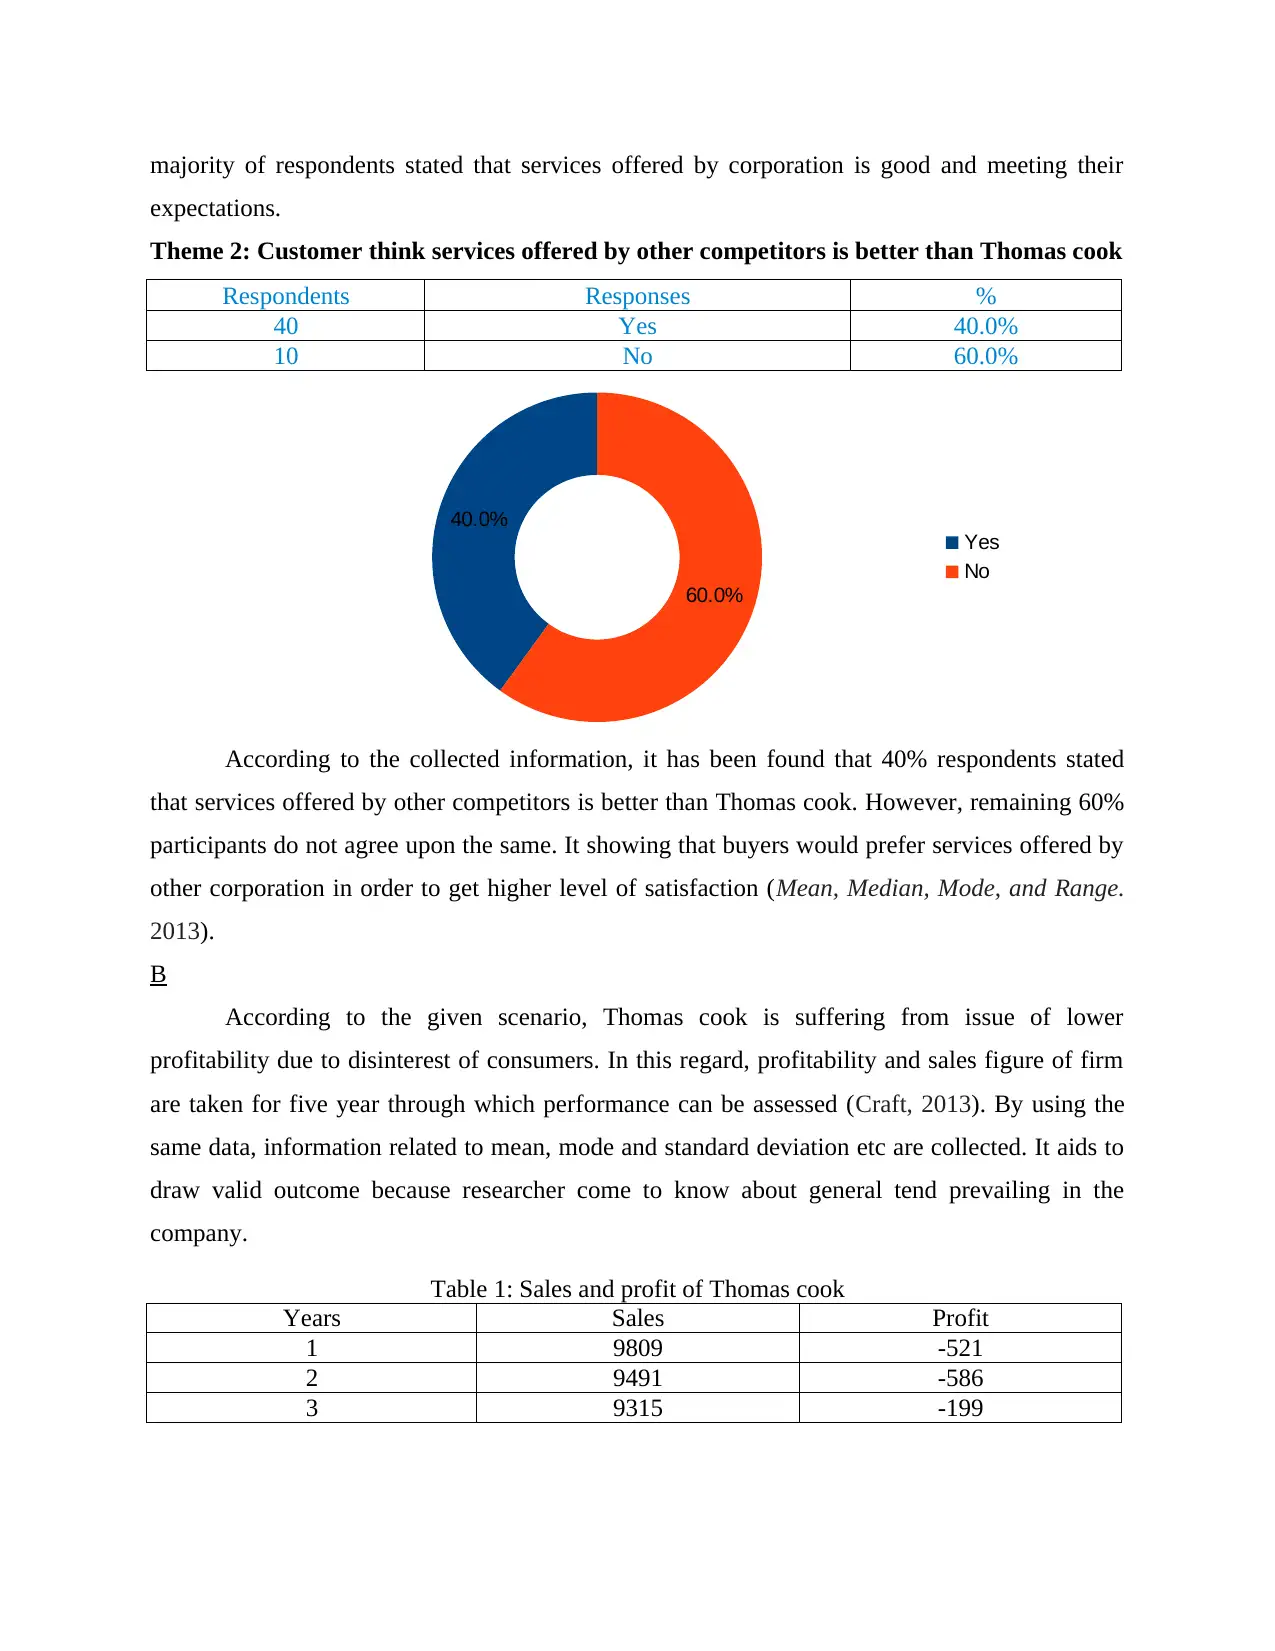
Theme 2: Customer think services offered by other competitors is better than Thomas cook
Respondents Responses %
40 Yes 40.0%
10 No 60.0%
According to the collected information, it has been found that 40% respondents stated
that services offered by other competitors is better than Thomas cook. However, remaining 60%
participants do not agree upon the same. It showing that buyers would prefer services offered by
other corporation in order to get higher level of satisfaction (Mean, Median, Mode, and Range.
2013).
B
According to the given scenario, Thomas cook is suffering from issue of lower
profitability due to disinterest of consumers. In this regard, profitability and sales figure of firm
are taken for five year through which performance can be assessed (Craft, 2013). By using the
same data, information related to mean, mode and standard deviation etc are collected. It aids to
draw valid outcome because researcher come to know about general tend prevailing in the
company.
Table 1: Sales and profit of Thomas cook
Years Sales Profit
1 9809 -521
2 9491 -586
3 9315 -199
40.0%
60.0%
Yes
No
expectations.
Theme 2: Customer think services offered by other competitors is better than Thomas cook
Respondents Responses %
40 Yes 40.0%
10 No 60.0%
According to the collected information, it has been found that 40% respondents stated
that services offered by other competitors is better than Thomas cook. However, remaining 60%
participants do not agree upon the same. It showing that buyers would prefer services offered by
other corporation in order to get higher level of satisfaction (Mean, Median, Mode, and Range.
2013).
B
According to the given scenario, Thomas cook is suffering from issue of lower
profitability due to disinterest of consumers. In this regard, profitability and sales figure of firm
are taken for five year through which performance can be assessed (Craft, 2013). By using the
same data, information related to mean, mode and standard deviation etc are collected. It aids to
draw valid outcome because researcher come to know about general tend prevailing in the
company.
Table 1: Sales and profit of Thomas cook
Years Sales Profit
1 9809 -521
2 9491 -586
3 9315 -199
40.0%
60.0%
Yes
No
Paraphrase This Document
Need a fresh take? Get an instant paraphrase of this document with our AI Paraphraser
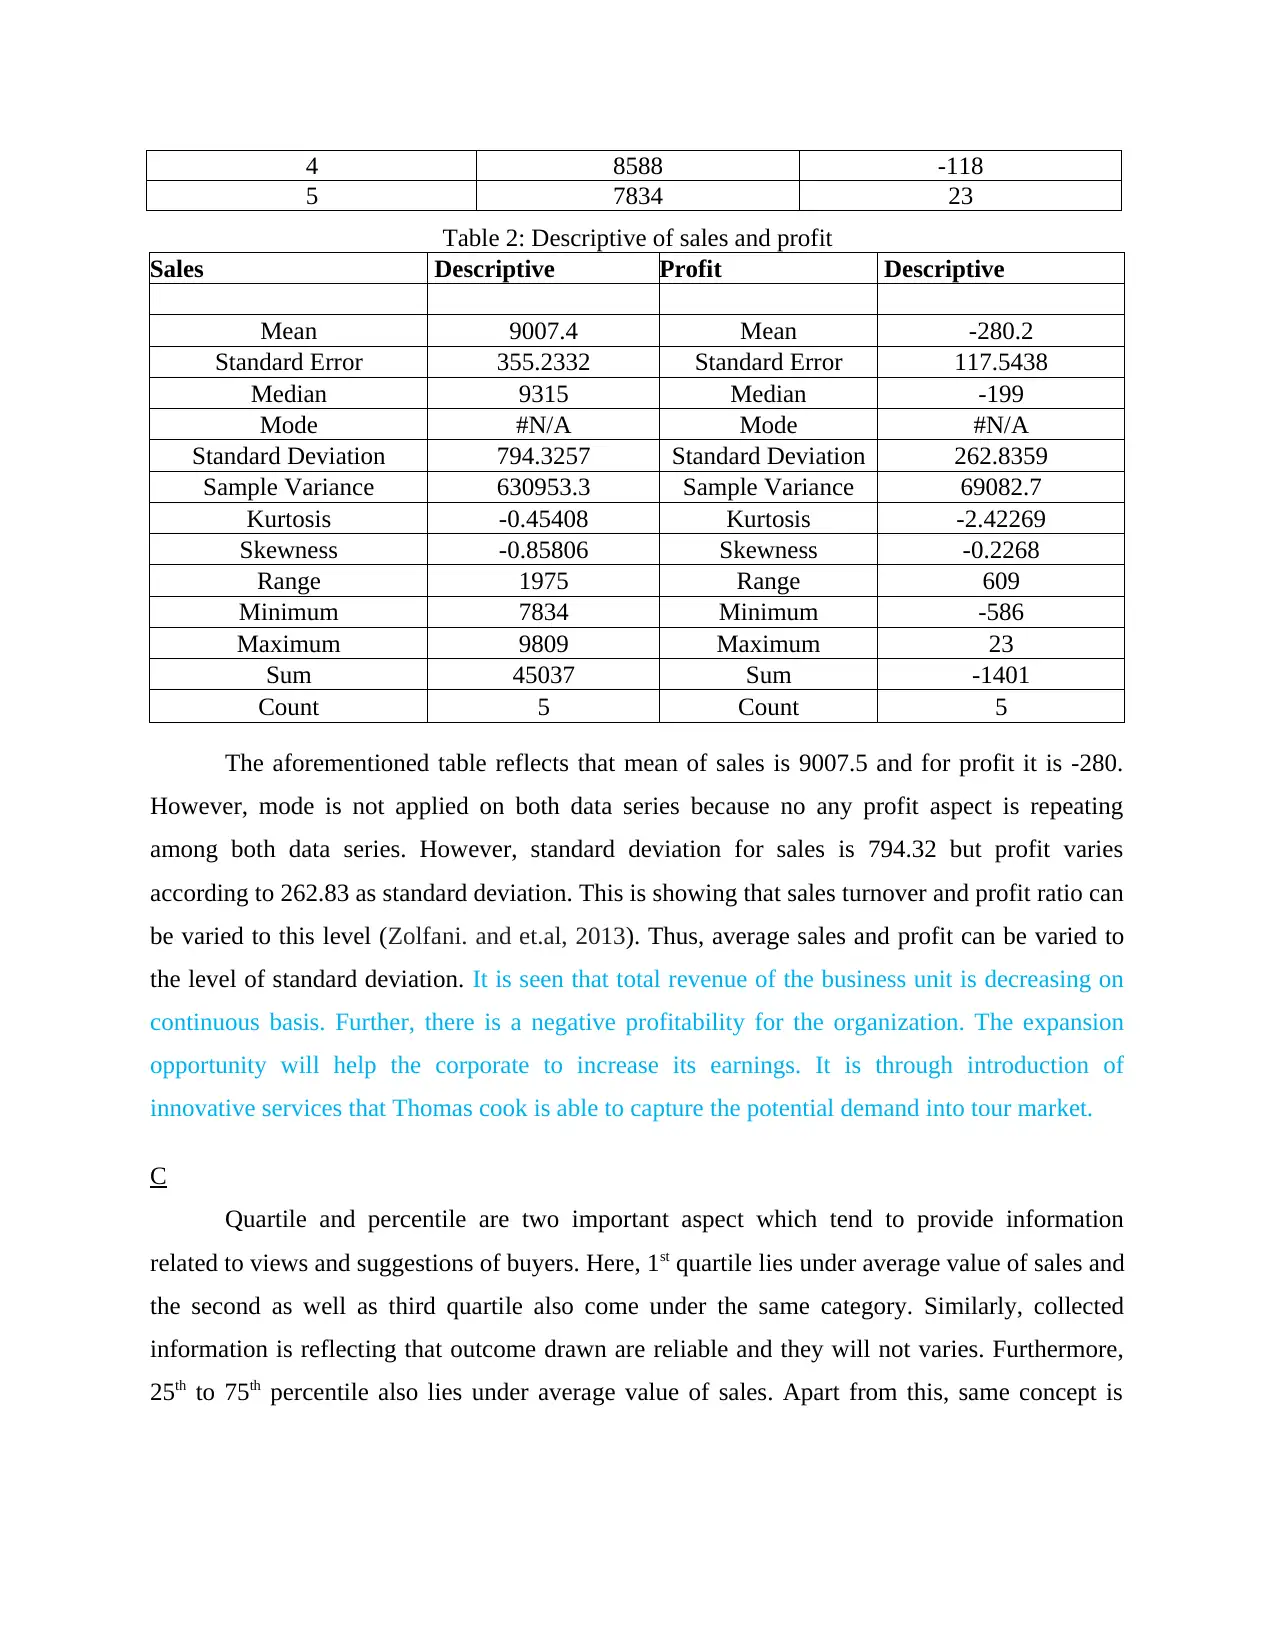
4 8588 -118
5 7834 23
Table 2: Descriptive of sales and profit
Sales Descriptive Profit Descriptive
Mean 9007.4 Mean -280.2
Standard Error 355.2332 Standard Error 117.5438
Median 9315 Median -199
Mode #N/A Mode #N/A
Standard Deviation 794.3257 Standard Deviation 262.8359
Sample Variance 630953.3 Sample Variance 69082.7
Kurtosis -0.45408 Kurtosis -2.42269
Skewness -0.85806 Skewness -0.2268
Range 1975 Range 609
Minimum 7834 Minimum -586
Maximum 9809 Maximum 23
Sum 45037 Sum -1401
Count 5 Count 5
The aforementioned table reflects that mean of sales is 9007.5 and for profit it is -280.
However, mode is not applied on both data series because no any profit aspect is repeating
among both data series. However, standard deviation for sales is 794.32 but profit varies
according to 262.83 as standard deviation. This is showing that sales turnover and profit ratio can
be varied to this level (Zolfani. and et.al, 2013). Thus, average sales and profit can be varied to
the level of standard deviation. It is seen that total revenue of the business unit is decreasing on
continuous basis. Further, there is a negative profitability for the organization. The expansion
opportunity will help the corporate to increase its earnings. It is through introduction of
innovative services that Thomas cook is able to capture the potential demand into tour market.
C
Quartile and percentile are two important aspect which tend to provide information
related to views and suggestions of buyers. Here, 1st quartile lies under average value of sales and
the second as well as third quartile also come under the same category. Similarly, collected
information is reflecting that outcome drawn are reliable and they will not varies. Furthermore,
25th to 75th percentile also lies under average value of sales. Apart from this, same concept is
applied over profitability (Isik, Jones and Sidorova, 2013). It is showing that company can
implement its potential strategies by referring the collected information.
Table 3: Quartile
1st Quartile 8588 -521
2nd Quartile 8951.5 -158.5
3rd Quartile 8951.5 -47.5
Table 4: Percentile
25th Percentile 8588 -521
50th Percentile 8951.5 -158.5
75th Percentile 8951.5 -47.5
Table 5: Correlation between profit and sales
Years Sales Profit
1 9809 -521
2 9491 -586
3 9315 -199
4 8588 -118
5 7834 23
Correlation
-0.88579
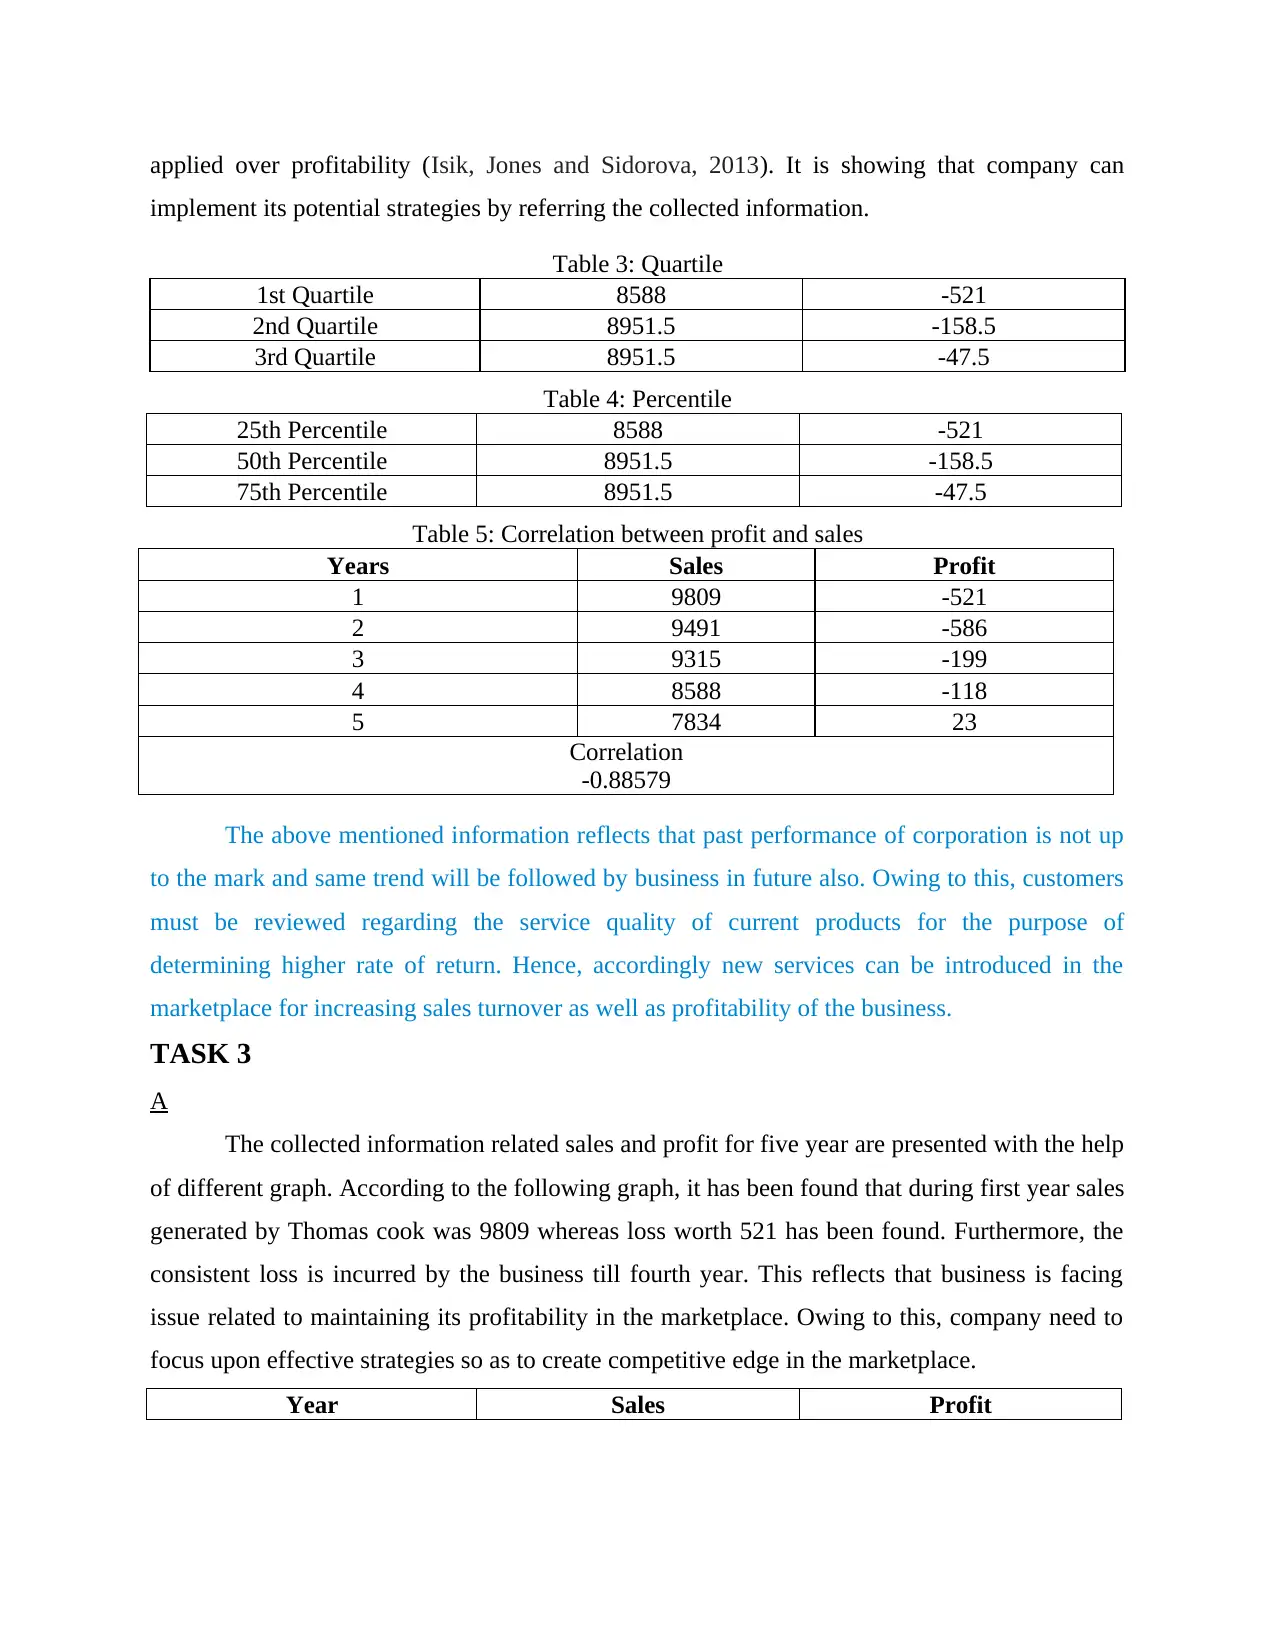
The above mentioned information reflects that past performance of corporation is not up
to the mark and same trend will be followed by business in future also. Owing to this, customers
must be reviewed regarding the service quality of current products for the purpose of
determining higher rate of return. Hence, accordingly new services can be introduced in the
marketplace for increasing sales turnover as well as profitability of the business.
TASK 3
A
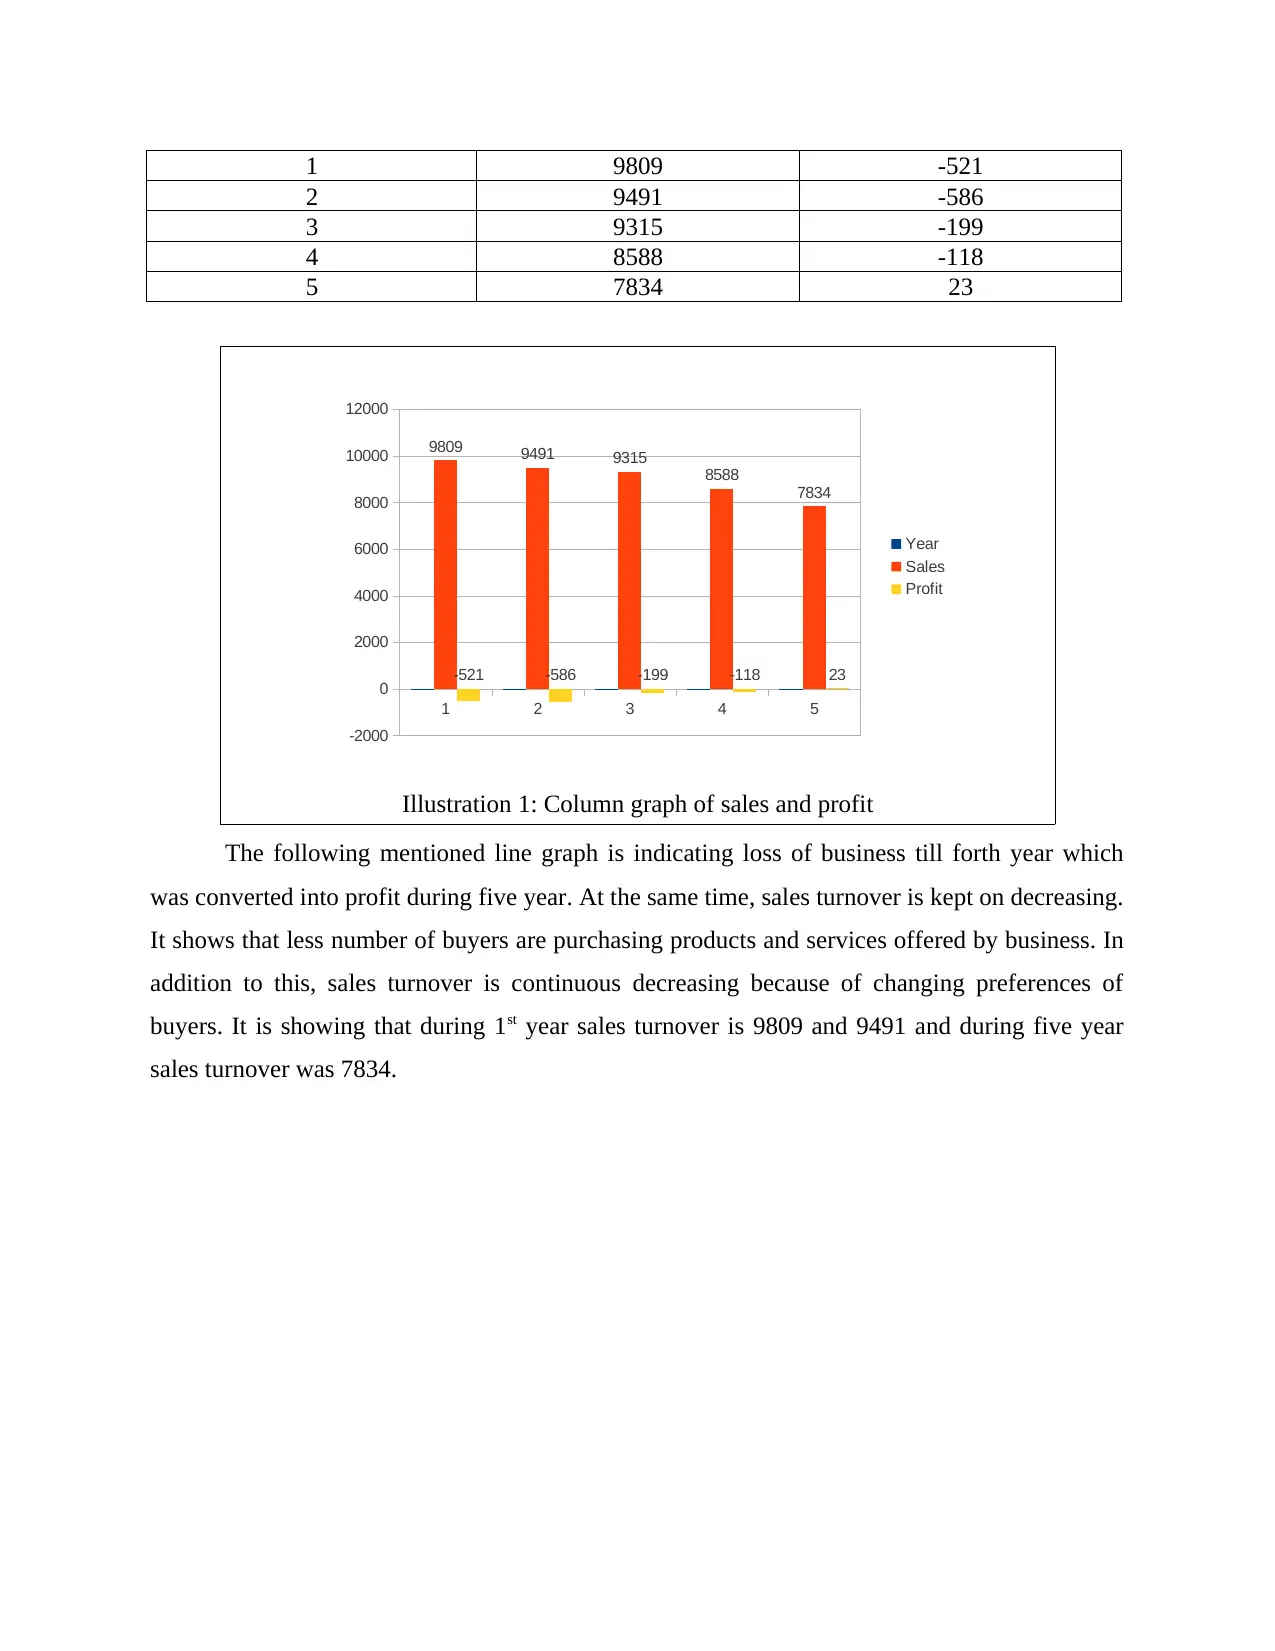
The collected information related sales and profit for five year are presented with the help
of different graph. According to the following graph, it has been found that during first year sales
generated by Thomas cook was 9809 whereas loss worth 521 has been found. Furthermore, the
consistent loss is incurred by the business till fourth year. This reflects that business is facing
issue related to maintaining its profitability in the marketplace. Owing to this, company need to
focus upon effective strategies so as to create competitive edge in the marketplace.
Year Sales Profit
implement its potential strategies by referring the collected information.
Table 3: Quartile
1st Quartile 8588 -521
2nd Quartile 8951.5 -158.5
3rd Quartile 8951.5 -47.5
Table 4: Percentile
25th Percentile 8588 -521
50th Percentile 8951.5 -158.5
75th Percentile 8951.5 -47.5
Table 5: Correlation between profit and sales
Years Sales Profit
1 9809 -521
2 9491 -586
3 9315 -199
4 8588 -118
5 7834 23
Correlation
-0.88579
The above mentioned information reflects that past performance of corporation is not up
to the mark and same trend will be followed by business in future also. Owing to this, customers
must be reviewed regarding the service quality of current products for the purpose of
determining higher rate of return. Hence, accordingly new services can be introduced in the
marketplace for increasing sales turnover as well as profitability of the business.
TASK 3
A
The collected information related sales and profit for five year are presented with the help
of different graph. According to the following graph, it has been found that during first year sales
generated by Thomas cook was 9809 whereas loss worth 521 has been found. Furthermore, the
consistent loss is incurred by the business till fourth year. This reflects that business is facing
issue related to maintaining its profitability in the marketplace. Owing to this, company need to
focus upon effective strategies so as to create competitive edge in the marketplace.
Year Sales Profit
1 9809 -521
2 9491 -586
3 9315 -199
4 8588 -118
5 7834 23
The following mentioned line graph is indicating loss of business till forth year which
was converted into profit during five year. At the same time, sales turnover is kept on decreasing.
It shows that less number of buyers are purchasing products and services offered by business. In
addition to this, sales turnover is continuous decreasing because of changing preferences of
buyers. It is showing that during 1st year sales turnover is 9809 and 9491 and during five year
sales turnover was 7834.
1 2 3 4 5
-2000
0
2000
4000
6000
8000
10000
12000
9809 9491 9315
8588
7834
-521 -586 -199 -118 23
Year
Sales
Profit
Illustration 1: Column graph of sales and profit
Secure Best Marks with AI Grader
Need help grading? Try our AI Grader for instant feedback on your assignments.
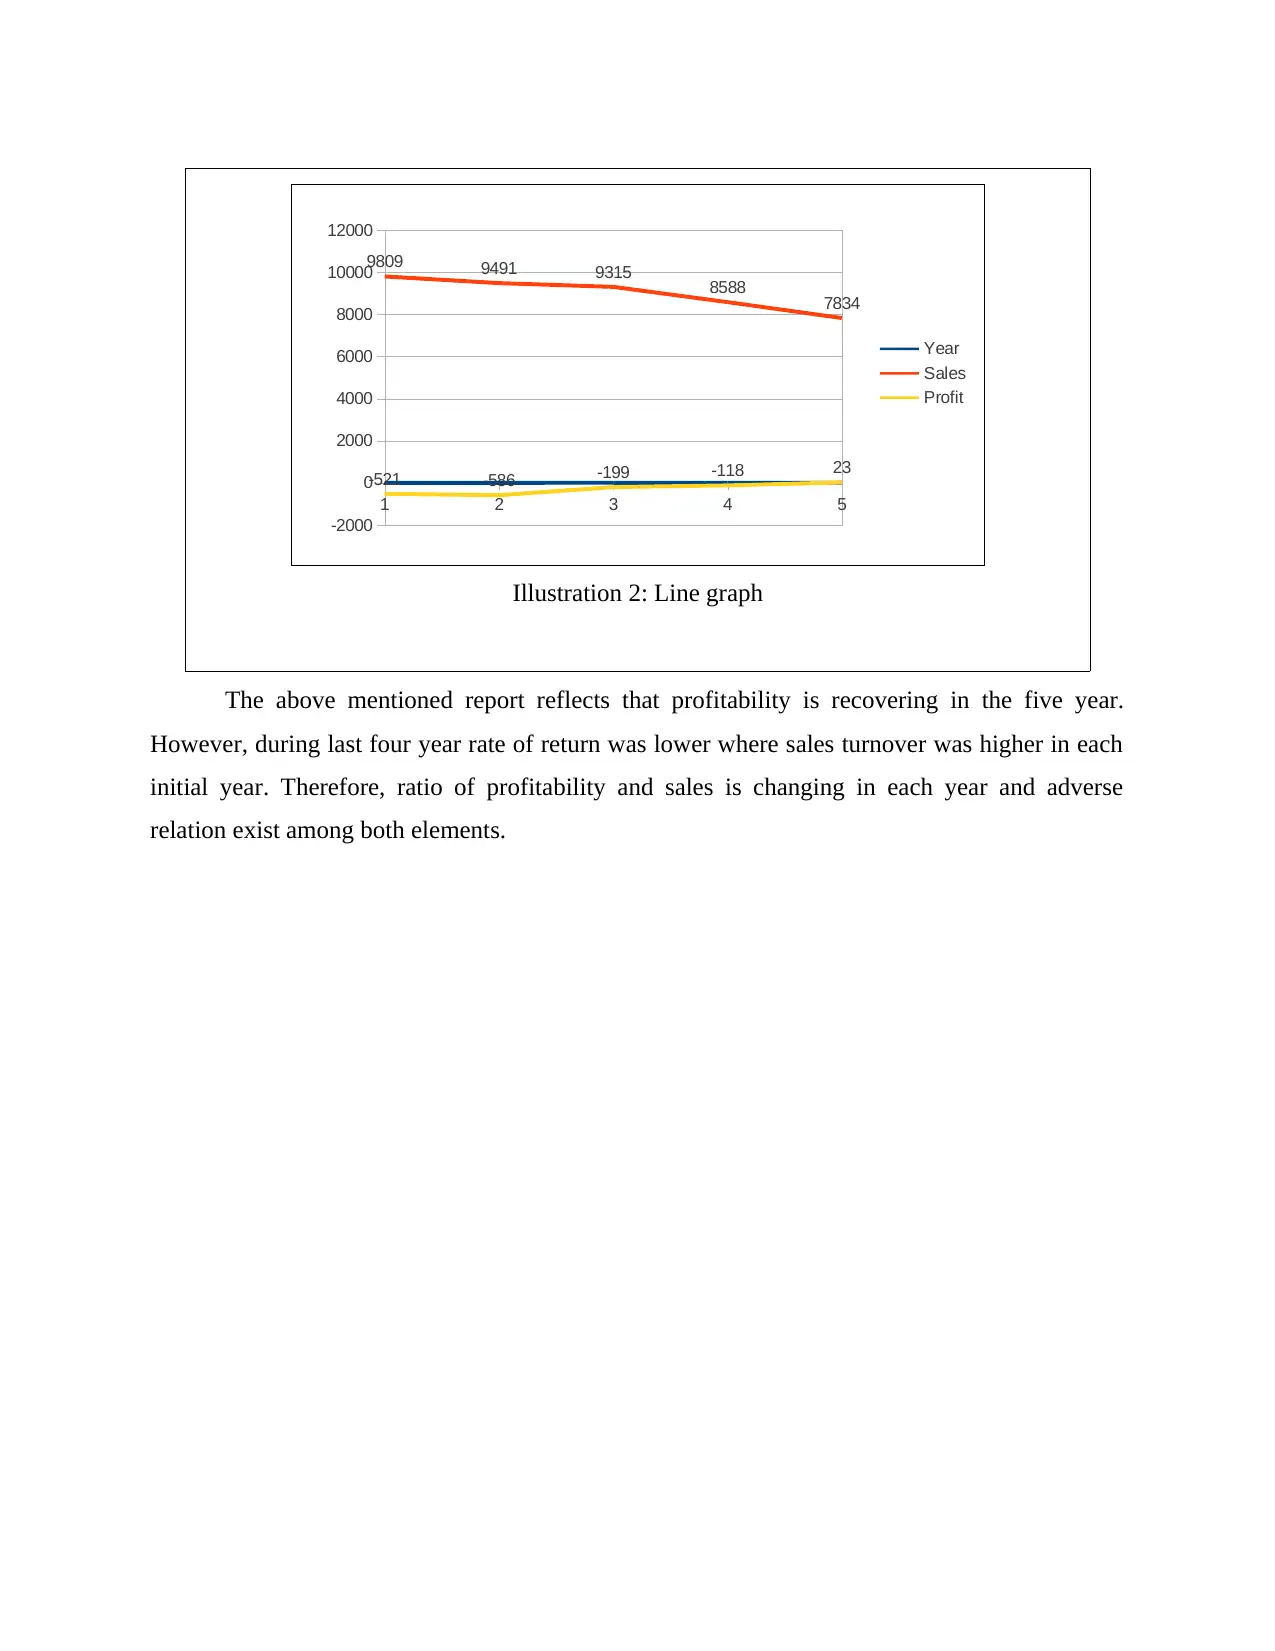
The above mentioned report reflects that profitability is recovering in the five year.
However, during last four year rate of return was lower where sales turnover was higher in each
initial year. Therefore, ratio of profitability and sales is changing in each year and adverse
relation exist among both elements.
1 2 3 4 5
-2000
0
2000
4000
6000
8000
10000
12000
9809 9491 9315 8588 7834
-521 -586 -199 -118 23
Year
Sales
Profit
Illustration 2: Line graph
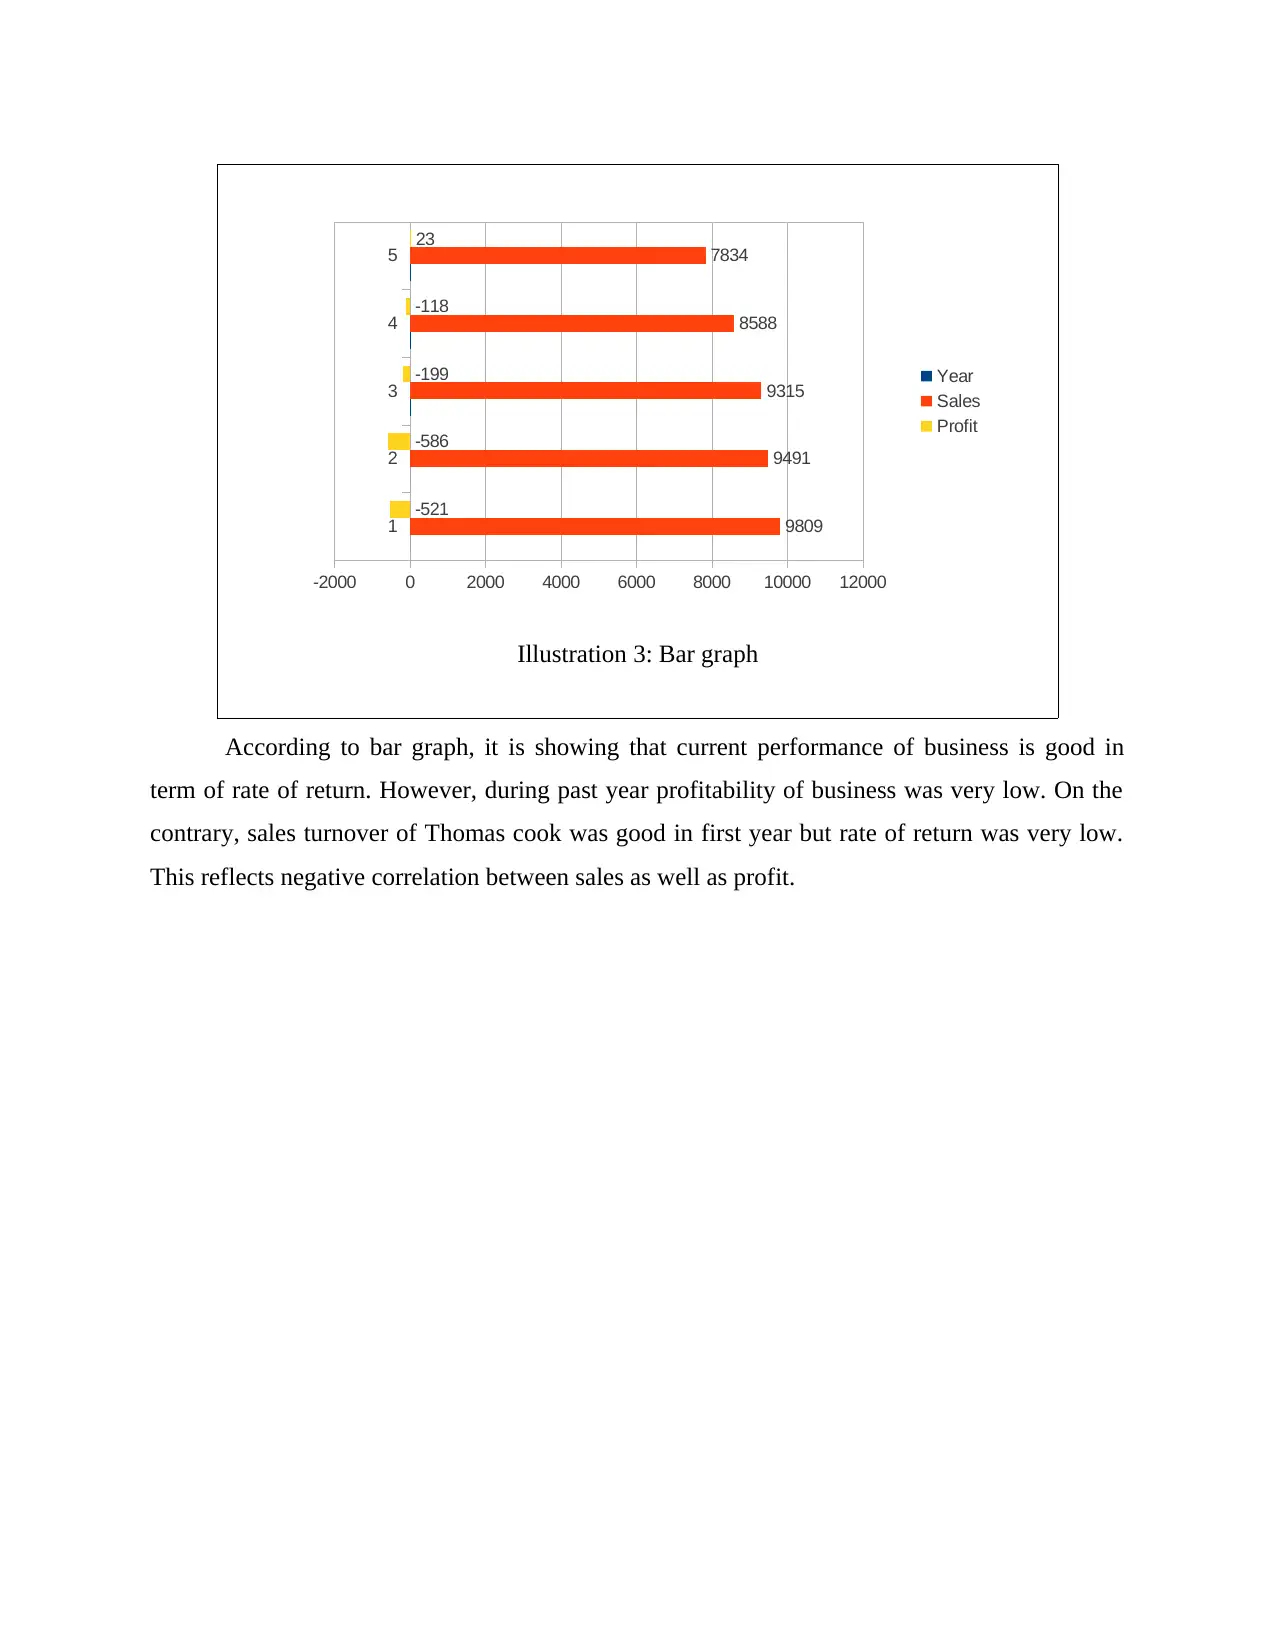
According to bar graph, it is showing that current performance of business is good in
term of rate of return. However, during past year profitability of business was very low. On the
contrary, sales turnover of Thomas cook was good in first year but rate of return was very low.
This reflects negative correlation between sales as well as profit.
1
2
3
4
5
-2000 0 2000 4000 6000 8000 10000 12000
9809
9491
9315
8588
7834
-521
-586
-199
-118
23
Year
Sales
Profit
Illustration 3: Bar graph
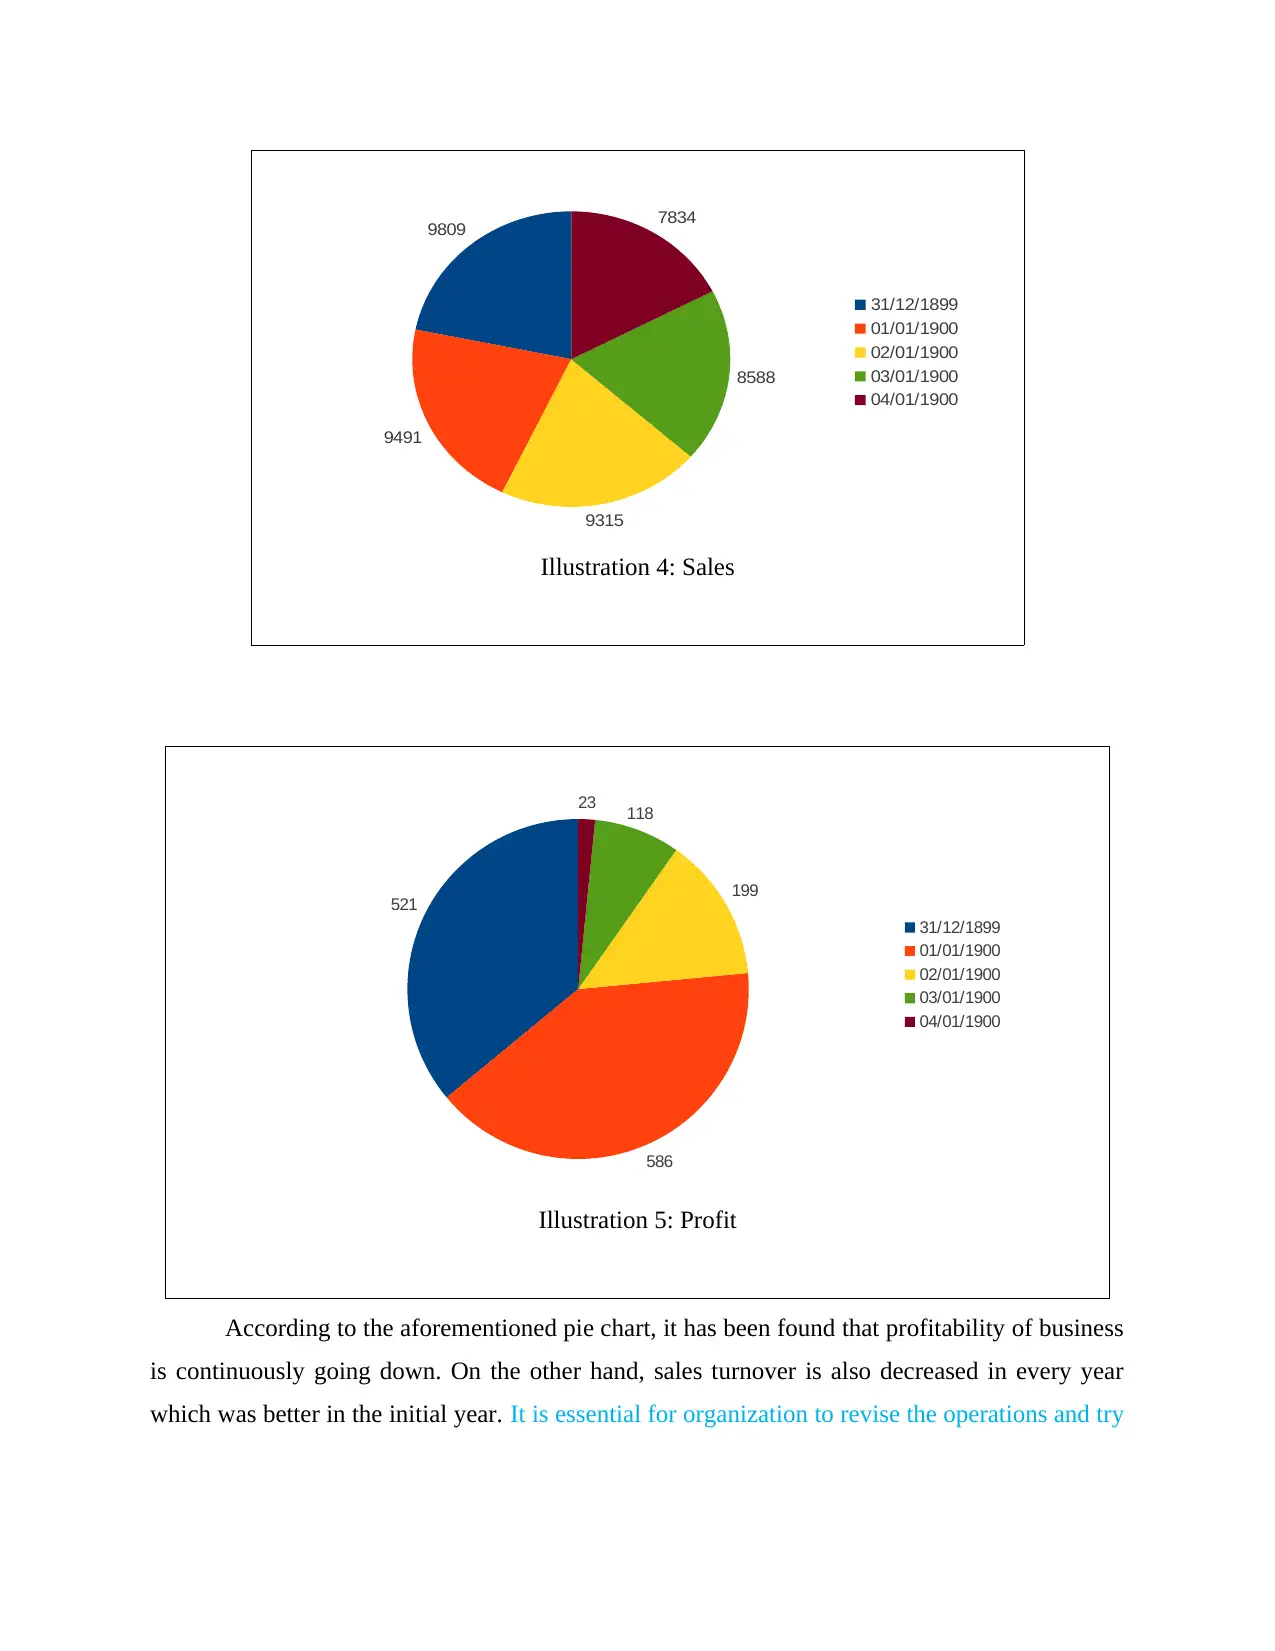
According to the aforementioned pie chart, it has been found that profitability of business
is continuously going down. On the other hand, sales turnover is also decreased in every year
which was better in the initial year. It is essential for organization to revise the operations and try
521
586
199
118
23
31/12/1899
01/01/1900
02/01/1900
03/01/1900
04/01/1900
Illustration 5: Profit
9809
9491
9315
8588
7834
31/12/1899
01/01/1900
02/01/1900
03/01/1900
04/01/1900
Illustration 4: Sales
Paraphrase This Document
Need a fresh take? Get an instant paraphrase of this document with our AI Paraphraser
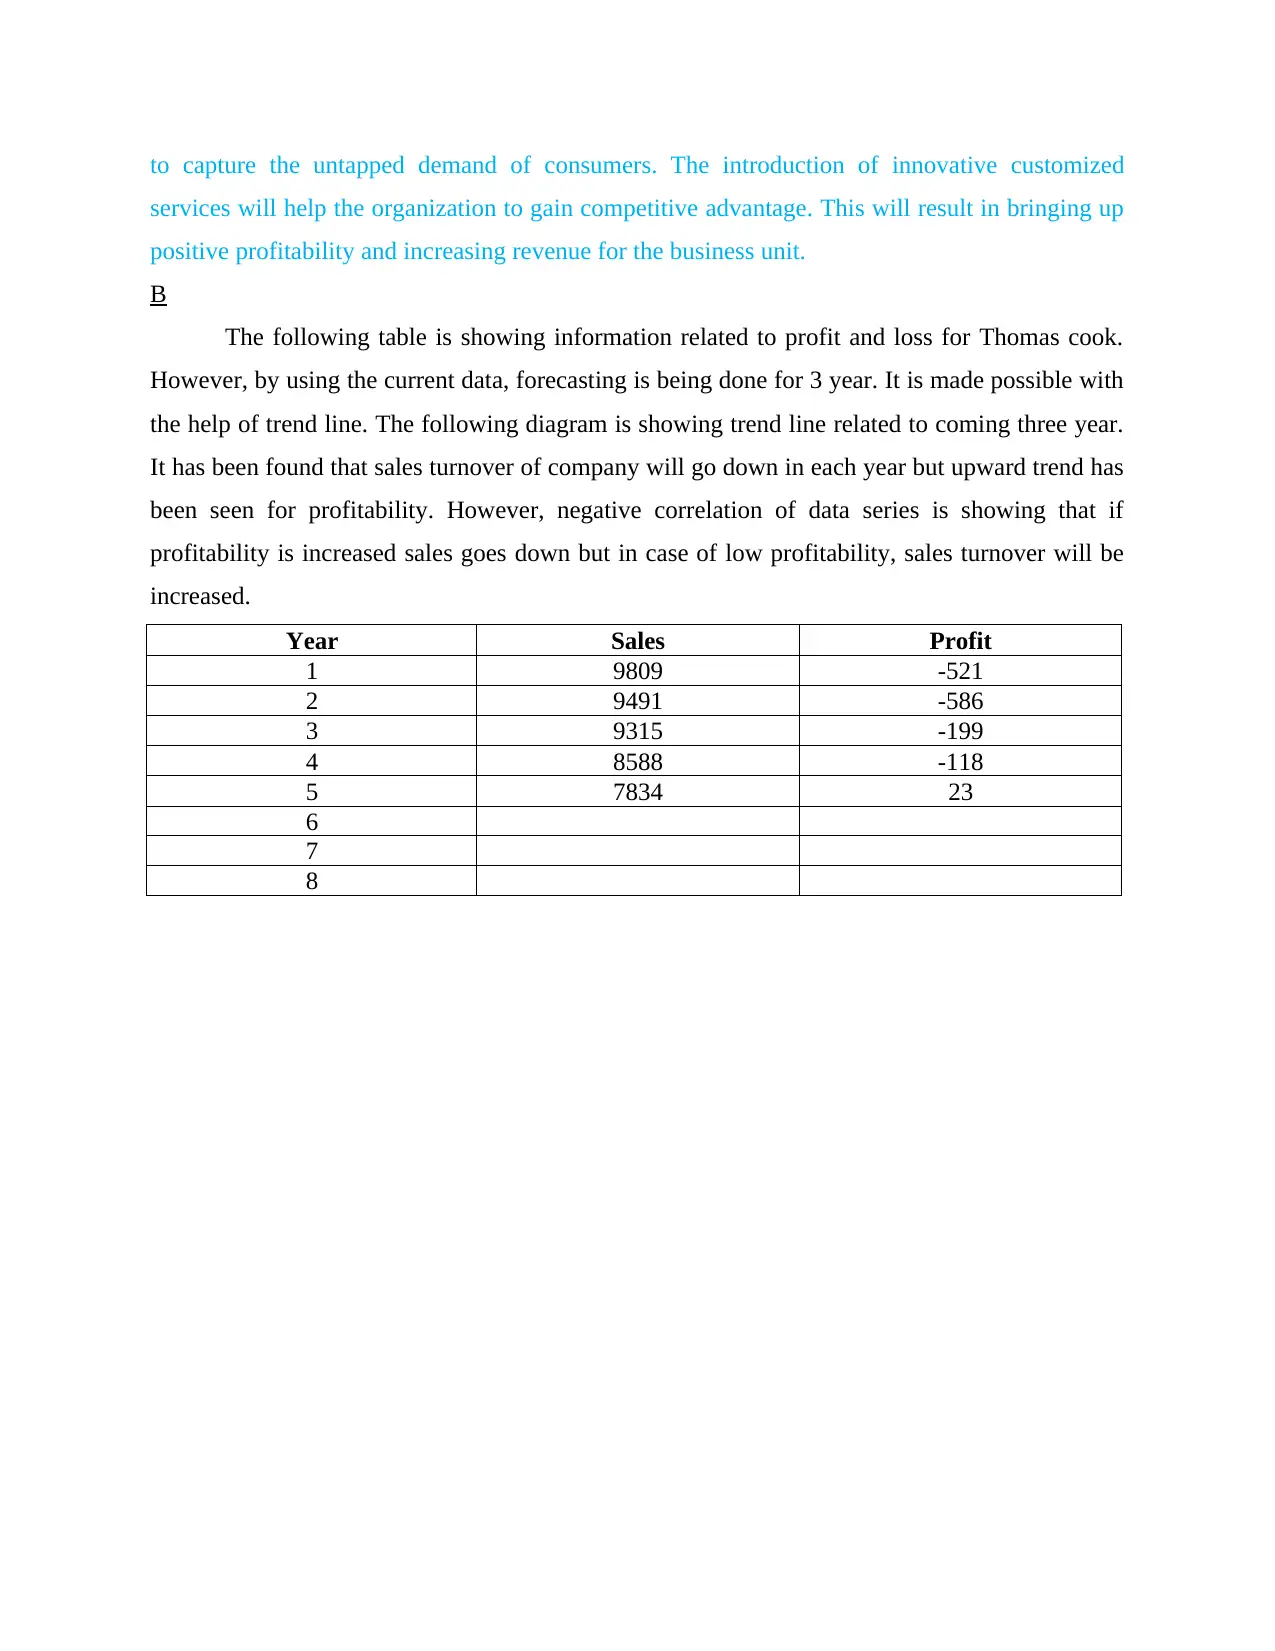
to capture the untapped demand of consumers. The introduction of innovative customized
services will help the organization to gain competitive advantage. This will result in bringing up
positive profitability and increasing revenue for the business unit.
B
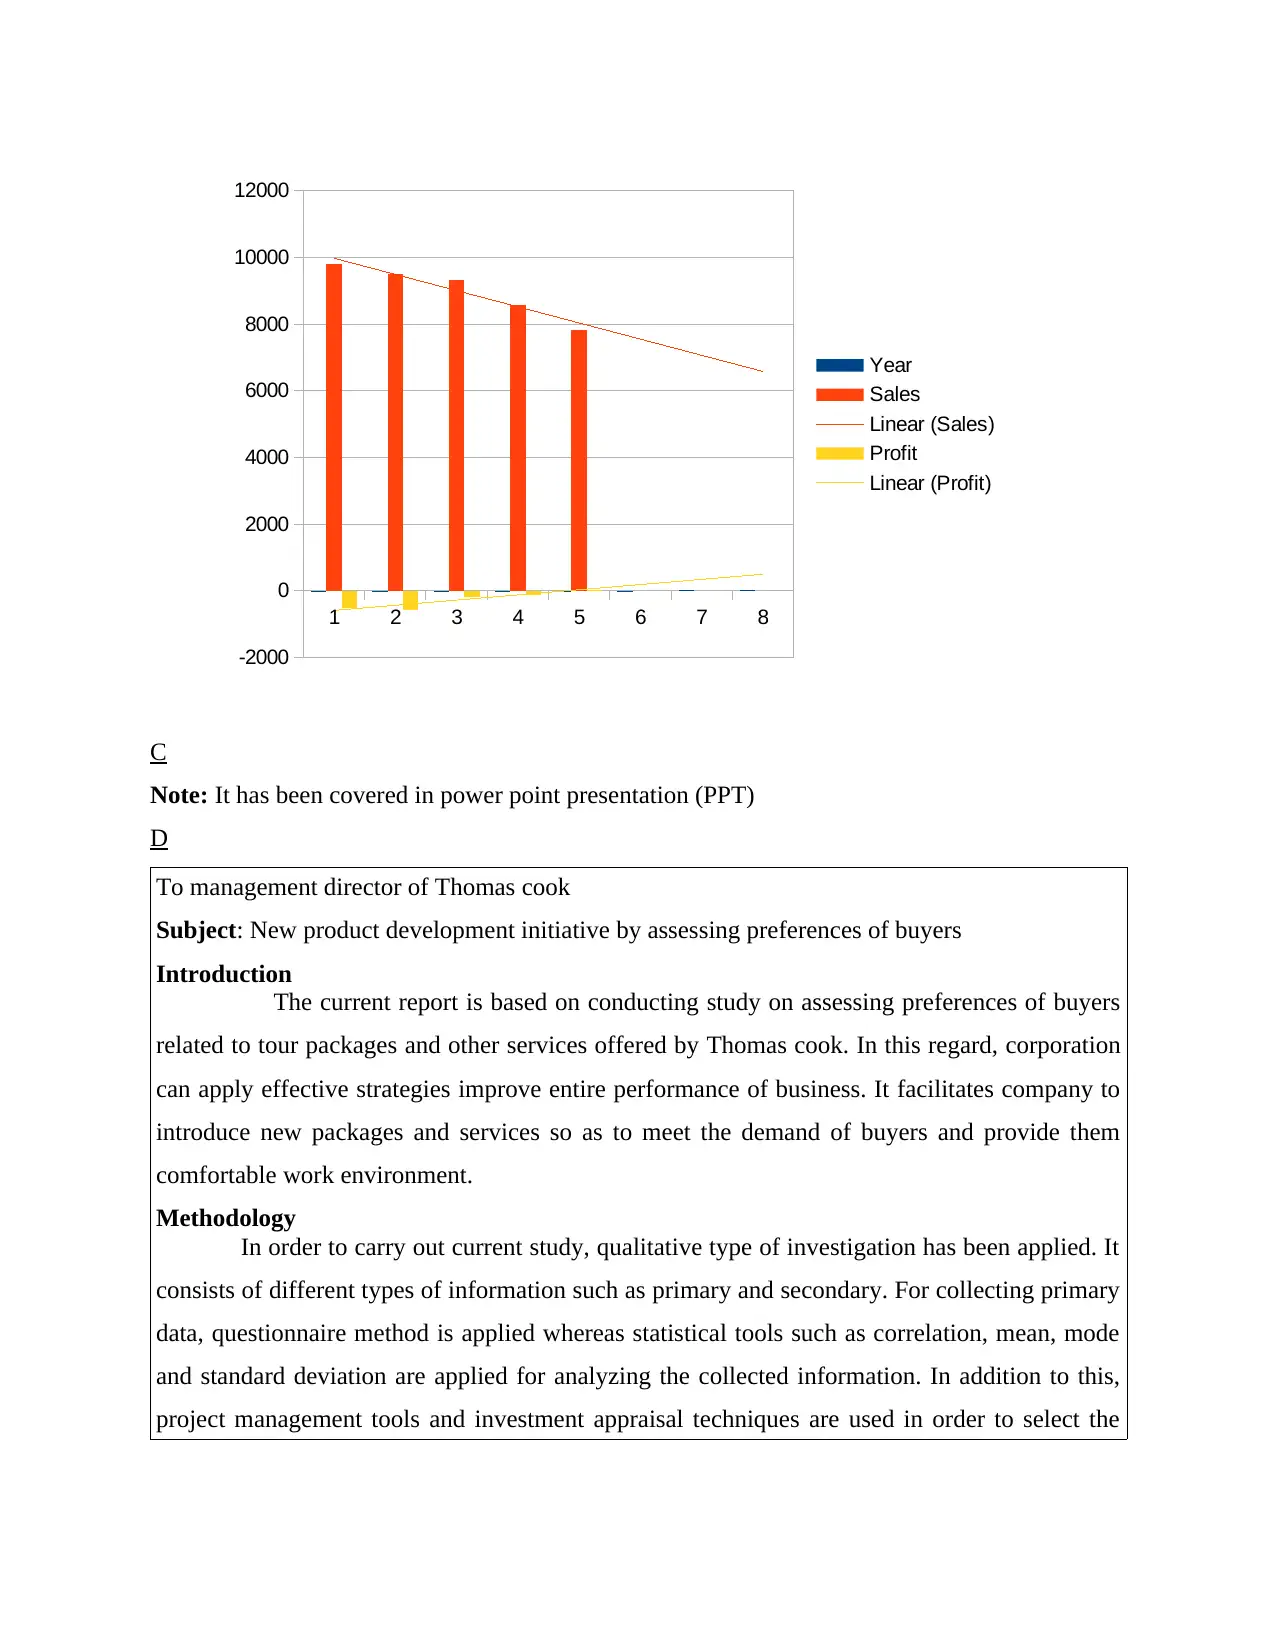
The following table is showing information related to profit and loss for Thomas cook.
However, by using the current data, forecasting is being done for 3 year. It is made possible with
the help of trend line. The following diagram is showing trend line related to coming three year.
It has been found that sales turnover of company will go down in each year but upward trend has
been seen for profitability. However, negative correlation of data series is showing that if
profitability is increased sales goes down but in case of low profitability, sales turnover will be
increased.
Year Sales Profit
1 9809 -521
2 9491 -586
3 9315 -199
4 8588 -118
5 7834 23
6
7
8
services will help the organization to gain competitive advantage. This will result in bringing up
positive profitability and increasing revenue for the business unit.
B
The following table is showing information related to profit and loss for Thomas cook.
However, by using the current data, forecasting is being done for 3 year. It is made possible with
the help of trend line. The following diagram is showing trend line related to coming three year.
It has been found that sales turnover of company will go down in each year but upward trend has
been seen for profitability. However, negative correlation of data series is showing that if
profitability is increased sales goes down but in case of low profitability, sales turnover will be
increased.
Year Sales Profit
1 9809 -521
2 9491 -586
3 9315 -199
4 8588 -118
5 7834 23
6
7
8
C
Note: It has been covered in power point presentation (PPT)
D
To management director of Thomas cook
Subject: New product development initiative by assessing preferences of buyers
Introduction
The current report is based on conducting study on assessing preferences of buyers
related to tour packages and other services offered by Thomas cook. In this regard, corporation
can apply effective strategies improve entire performance of business. It facilitates company to
introduce new packages and services so as to meet the demand of buyers and provide them
comfortable work environment.
Methodology
In order to carry out current study, qualitative type of investigation has been applied. It
consists of different types of information such as primary and secondary. For collecting primary
data, questionnaire method is applied whereas statistical tools such as correlation, mean, mode
and standard deviation are applied for analyzing the collected information. In addition to this,
project management tools and investment appraisal techniques are used in order to select the
1 2 3 4 5 6 7 8
-2000
0
2000
4000
6000
8000
10000
12000
Year
Sales
Linear (Sales)
Profit
Linear (Profit)
best project.
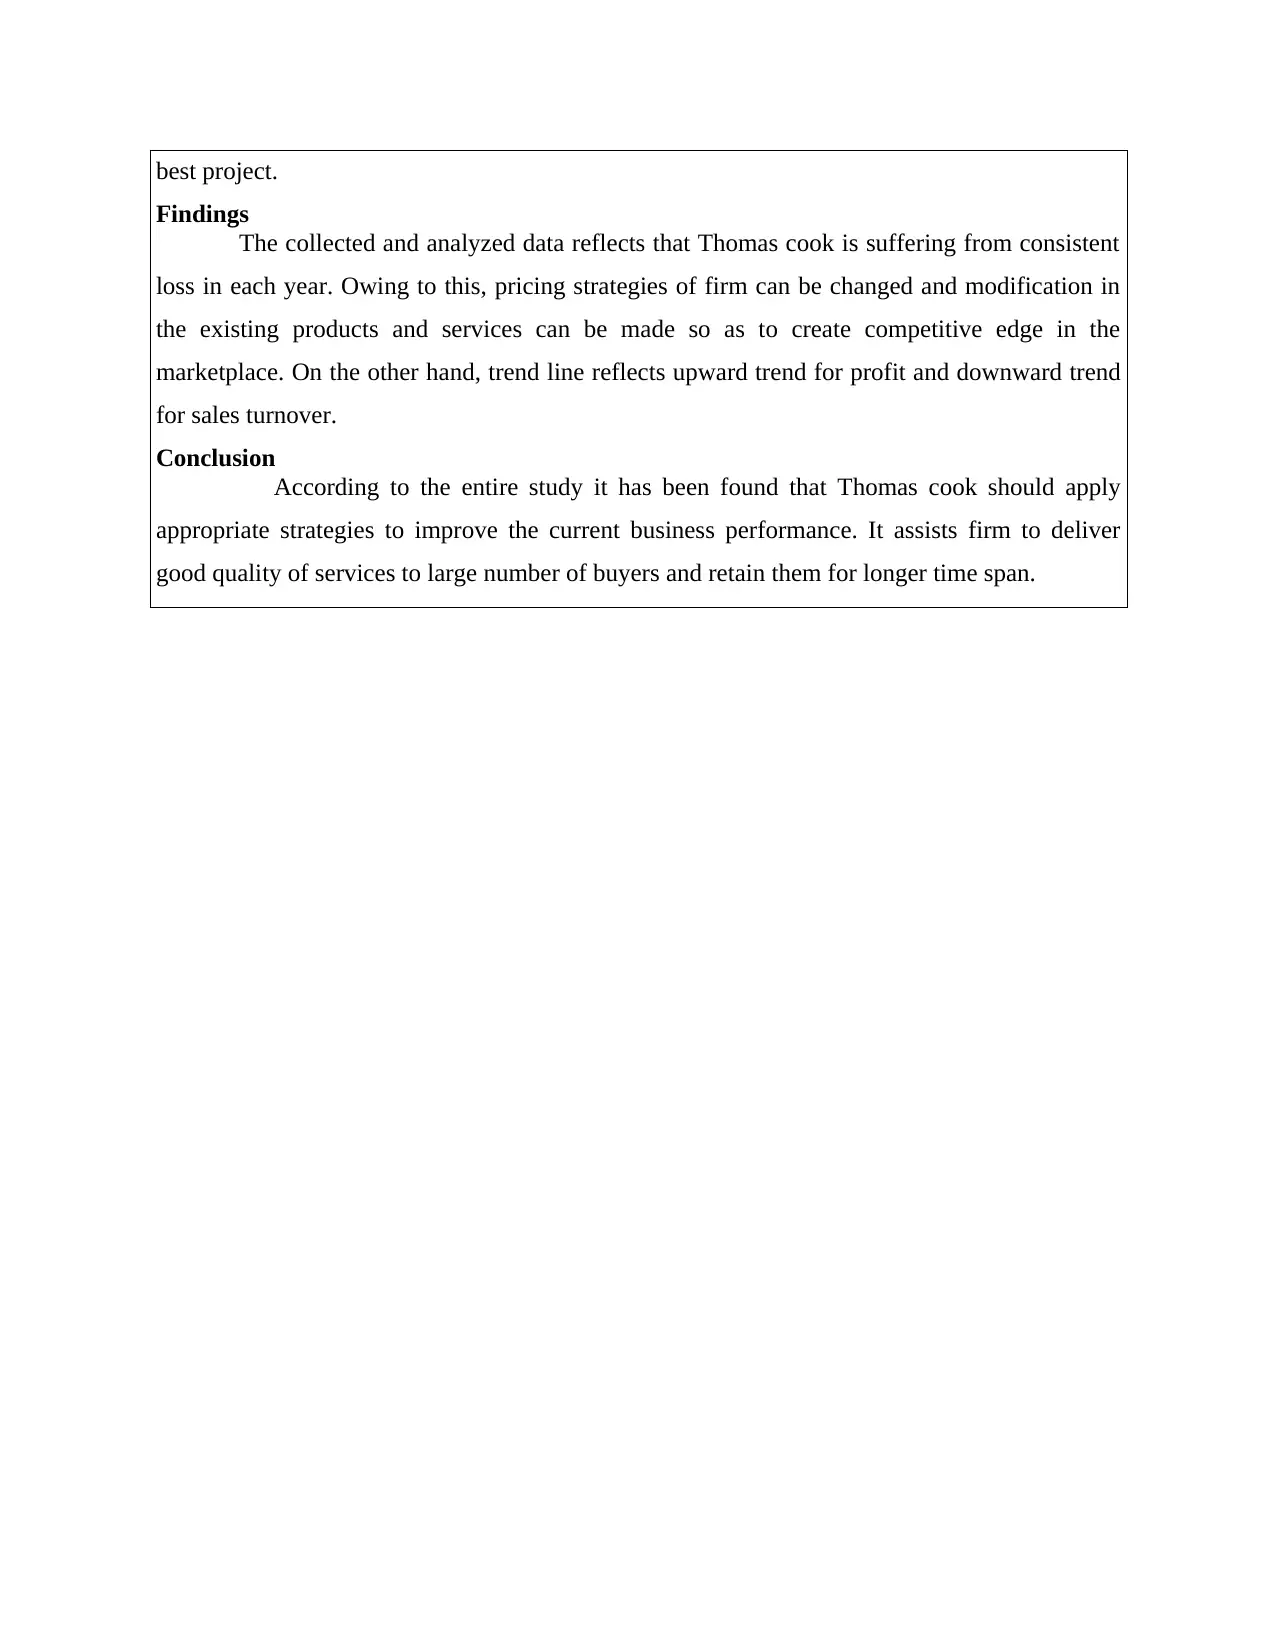
Findings
The collected and analyzed data reflects that Thomas cook is suffering from consistent
loss in each year. Owing to this, pricing strategies of firm can be changed and modification in
the existing products and services can be made so as to create competitive edge in the
marketplace. On the other hand, trend line reflects upward trend for profit and downward trend
for sales turnover.
Conclusion
According to the entire study it has been found that Thomas cook should apply
appropriate strategies to improve the current business performance. It assists firm to deliver
good quality of services to large number of buyers and retain them for longer time span.
Secure Best Marks with AI Grader
Need help grading? Try our AI Grader for instant feedback on your assignments.
TASK 4
A.
Information processing tools
Thomas Cook, a global travel company can use tools to exchange data and information
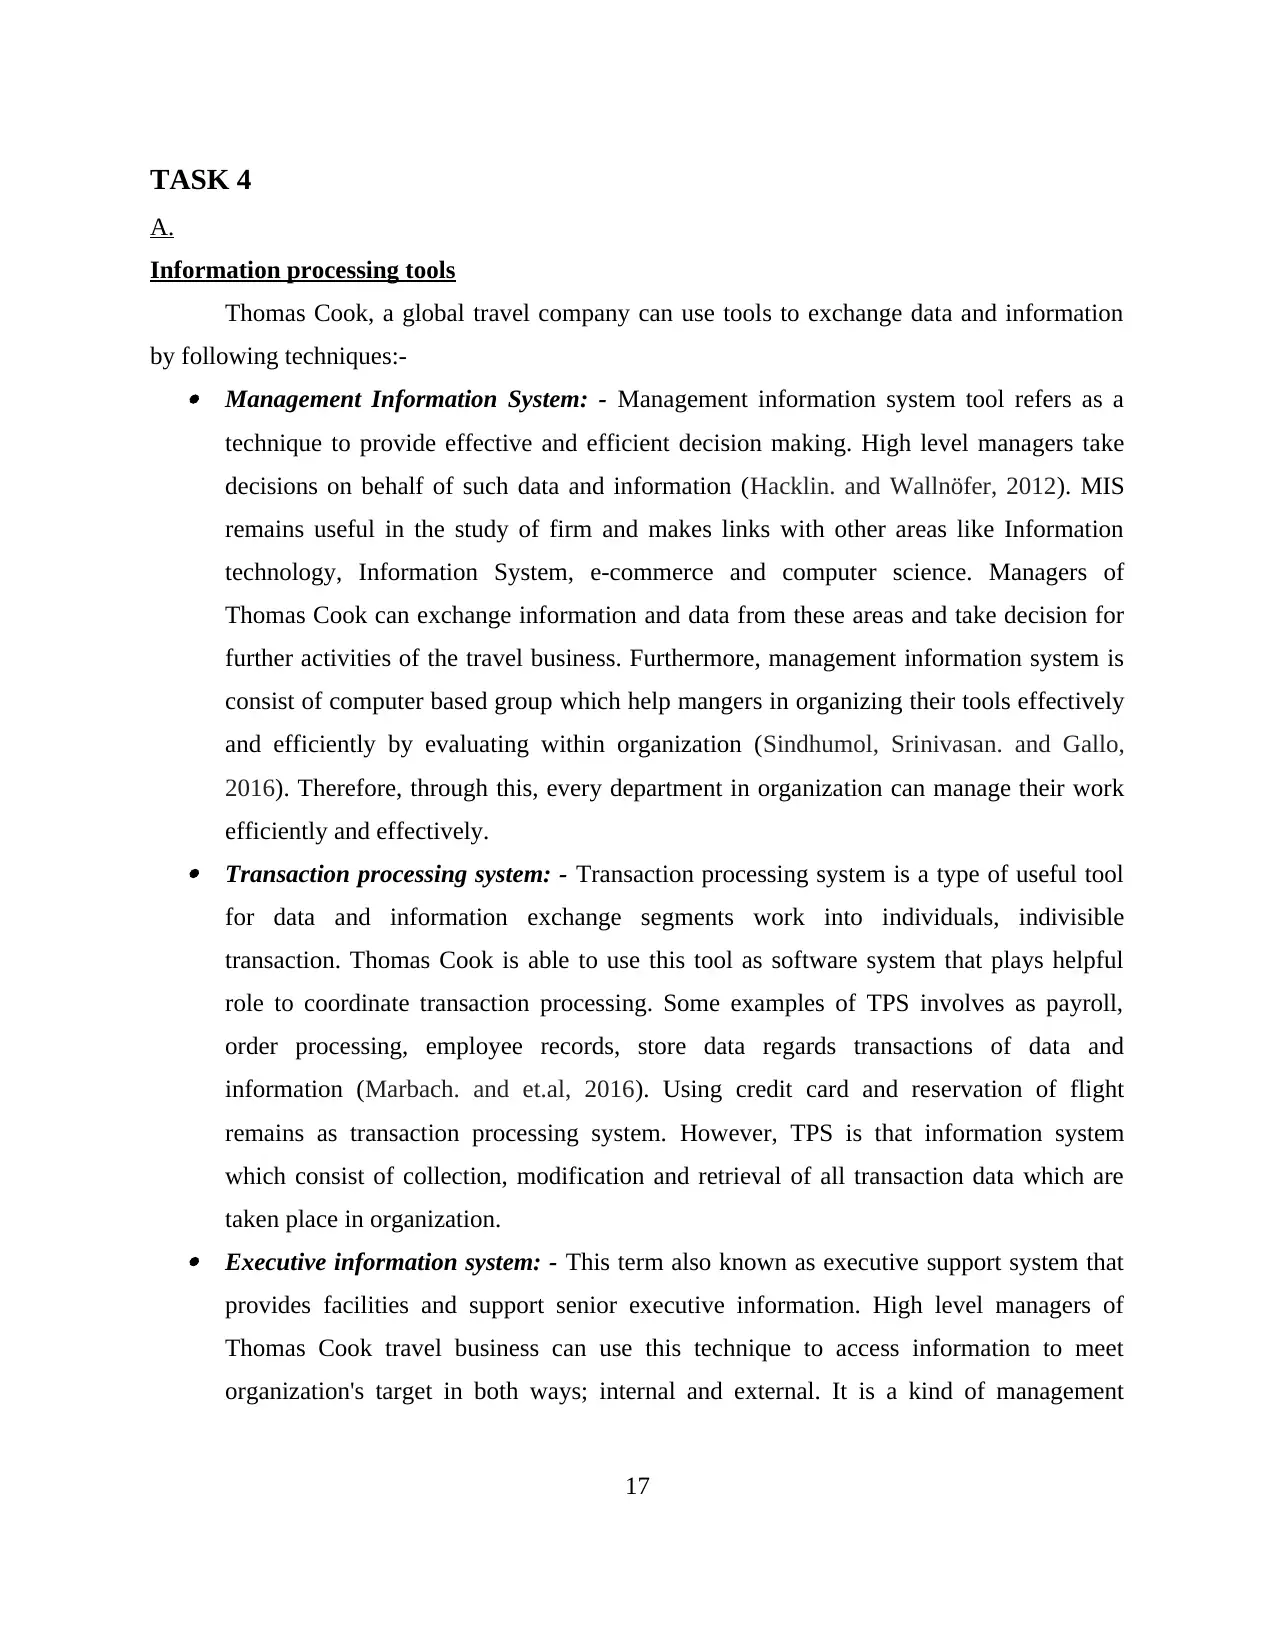
by following techniques:- Management Information System: - Management information system tool refers as a
technique to provide effective and efficient decision making. High level managers take
decisions on behalf of such data and information (Hacklin. and Wallnöfer, 2012). MIS
remains useful in the study of firm and makes links with other areas like Information
technology, Information System, e-commerce and computer science. Managers of
Thomas Cook can exchange information and data from these areas and take decision for
further activities of the travel business. Furthermore, management information system is
consist of computer based group which help mangers in organizing their tools effectively
and efficiently by evaluating within organization (Sindhumol, Srinivasan. and Gallo,
2016). Therefore, through this, every department in organization can manage their work
efficiently and effectively. Transaction processing system: - Transaction processing system is a type of useful tool
for data and information exchange segments work into individuals, indivisible
transaction. Thomas Cook is able to use this tool as software system that plays helpful
role to coordinate transaction processing. Some examples of TPS involves as payroll,
order processing, employee records, store data regards transactions of data and
information (Marbach. and et.al, 2016). Using credit card and reservation of flight
remains as transaction processing system. However, TPS is that information system
which consist of collection, modification and retrieval of all transaction data which are
taken place in organization. Executive information system: - This term also known as executive support system that
provides facilities and support senior executive information. High level managers of
Thomas Cook travel business can use this technique to access information to meet
organization's target in both ways; internal and external. It is a kind of management
17
A.
Information processing tools
Thomas Cook, a global travel company can use tools to exchange data and information
by following techniques:- Management Information System: - Management information system tool refers as a
technique to provide effective and efficient decision making. High level managers take
decisions on behalf of such data and information (Hacklin. and Wallnöfer, 2012). MIS
remains useful in the study of firm and makes links with other areas like Information
technology, Information System, e-commerce and computer science. Managers of
Thomas Cook can exchange information and data from these areas and take decision for
further activities of the travel business. Furthermore, management information system is
consist of computer based group which help mangers in organizing their tools effectively
and efficiently by evaluating within organization (Sindhumol, Srinivasan. and Gallo,
2016). Therefore, through this, every department in organization can manage their work
efficiently and effectively. Transaction processing system: - Transaction processing system is a type of useful tool
for data and information exchange segments work into individuals, indivisible
transaction. Thomas Cook is able to use this tool as software system that plays helpful
role to coordinate transaction processing. Some examples of TPS involves as payroll,
order processing, employee records, store data regards transactions of data and
information (Marbach. and et.al, 2016). Using credit card and reservation of flight
remains as transaction processing system. However, TPS is that information system
which consist of collection, modification and retrieval of all transaction data which are
taken place in organization. Executive information system: - This term also known as executive support system that
provides facilities and support senior executive information. High level managers of
Thomas Cook travel business can use this technique to access information to meet
organization's target in both ways; internal and external. It is a kind of management
17
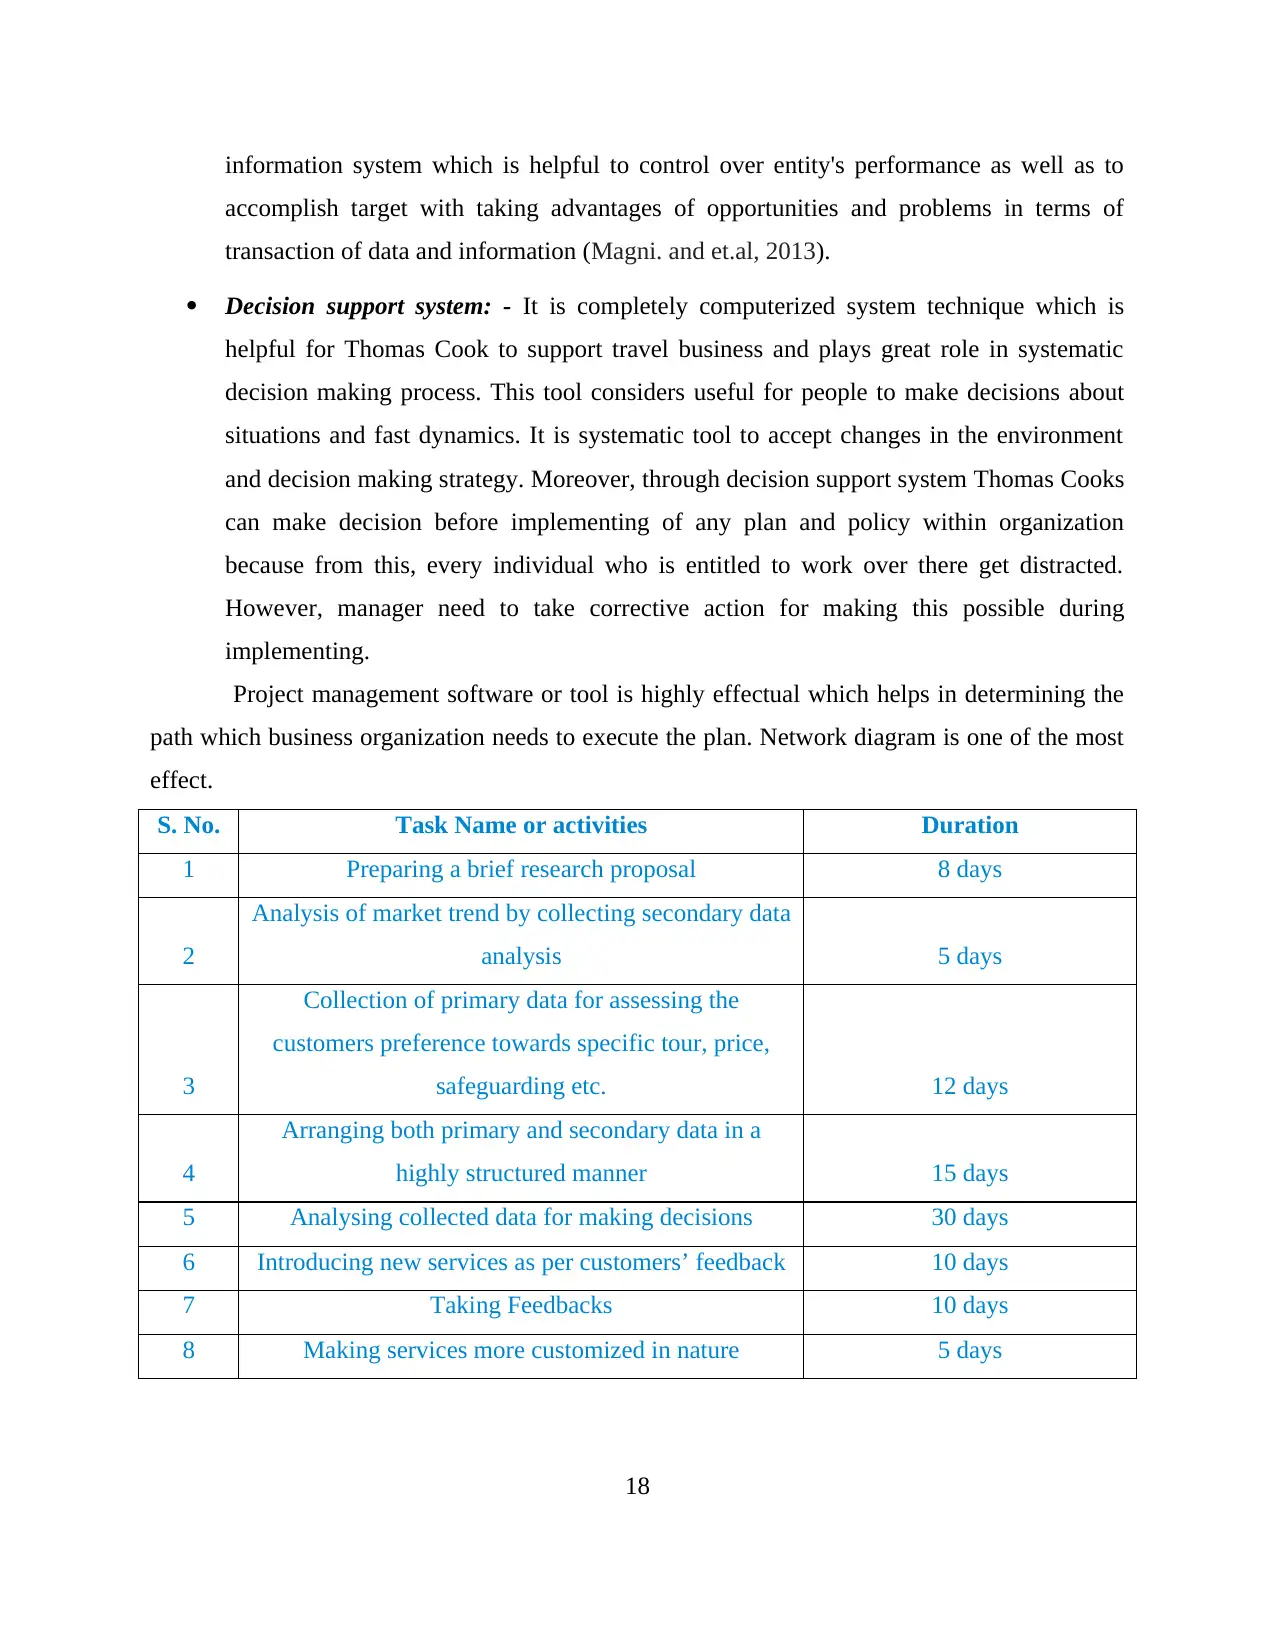
information system which is helpful to control over entity's performance as well as to
accomplish target with taking advantages of opportunities and problems in terms of
transaction of data and information (Magni. and et.al, 2013).
Decision support system: - It is completely computerized system technique which is
helpful for Thomas Cook to support travel business and plays great role in systematic
decision making process. This tool considers useful for people to make decisions about
situations and fast dynamics. It is systematic tool to accept changes in the environment
and decision making strategy. Moreover, through decision support system Thomas Cooks
can make decision before implementing of any plan and policy within organization
because from this, every individual who is entitled to work over there get distracted.
However, manager need to take corrective action for making this possible during
implementing.
Project management software or tool is highly effectual which helps in determining the
path which business organization needs to execute the plan. Network diagram is one of the most
effect.
S. No. Task Name or activities Duration
1 Preparing a brief research proposal 8 days
2
Analysis of market trend by collecting secondary data
analysis 5 days
3
Collection of primary data for assessing the
customers preference towards specific tour, price,
safeguarding etc. 12 days
4
Arranging both primary and secondary data in a
highly structured manner 15 days
5 Analysing collected data for making decisions 30 days
6 Introducing new services as per customers’ feedback 10 days
7 Taking Feedbacks 10 days
8 Making services more customized in nature 5 days
18
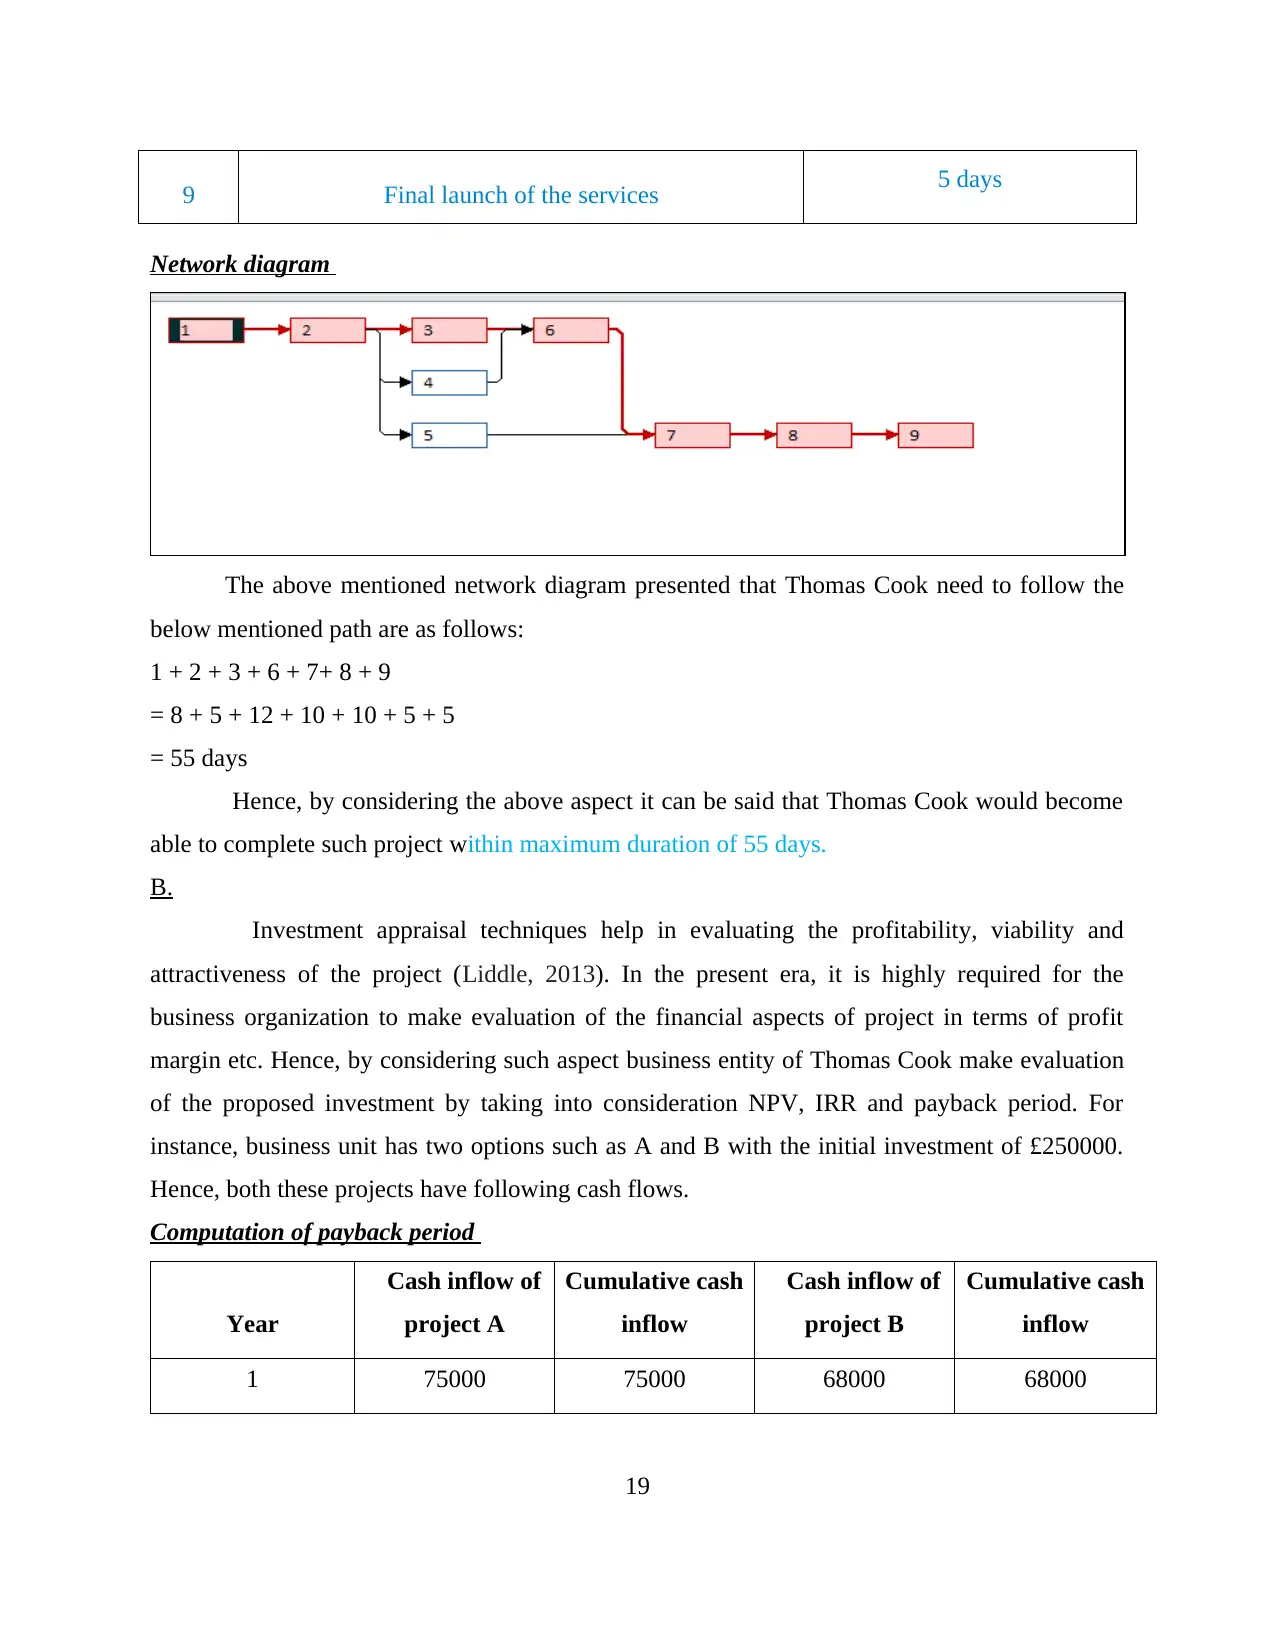
9 Final launch of the services 5 days
Network diagram
The above mentioned network diagram presented that Thomas Cook need to follow the
below mentioned path are as follows:
1 + 2 + 3 + 6 + 7+ 8 + 9
= 8 + 5 + 12 + 10 + 10 + 5 + 5
= 55 days
Hence, by considering the above aspect it can be said that Thomas Cook would become
able to complete such project within maximum duration of 55 days.
B.
Investment appraisal techniques help in evaluating the profitability, viability and
attractiveness of the project (Liddle, 2013). In the present era, it is highly required for the
business organization to make evaluation of the financial aspects of project in terms of profit
margin etc. Hence, by considering such aspect business entity of Thomas Cook make evaluation
of the proposed investment by taking into consideration NPV, IRR and payback period. For
instance, business unit has two options such as A and B with the initial investment of £250000.
Hence, both these projects have following cash flows.
Computation of payback period
Year
Cash inflow of
project A
Cumulative cash
inflow
Cash inflow of
project B
Cumulative cash
inflow
1 75000 75000 68000 68000
19
Paraphrase This Document
Need a fresh take? Get an instant paraphrase of this document with our AI Paraphraser
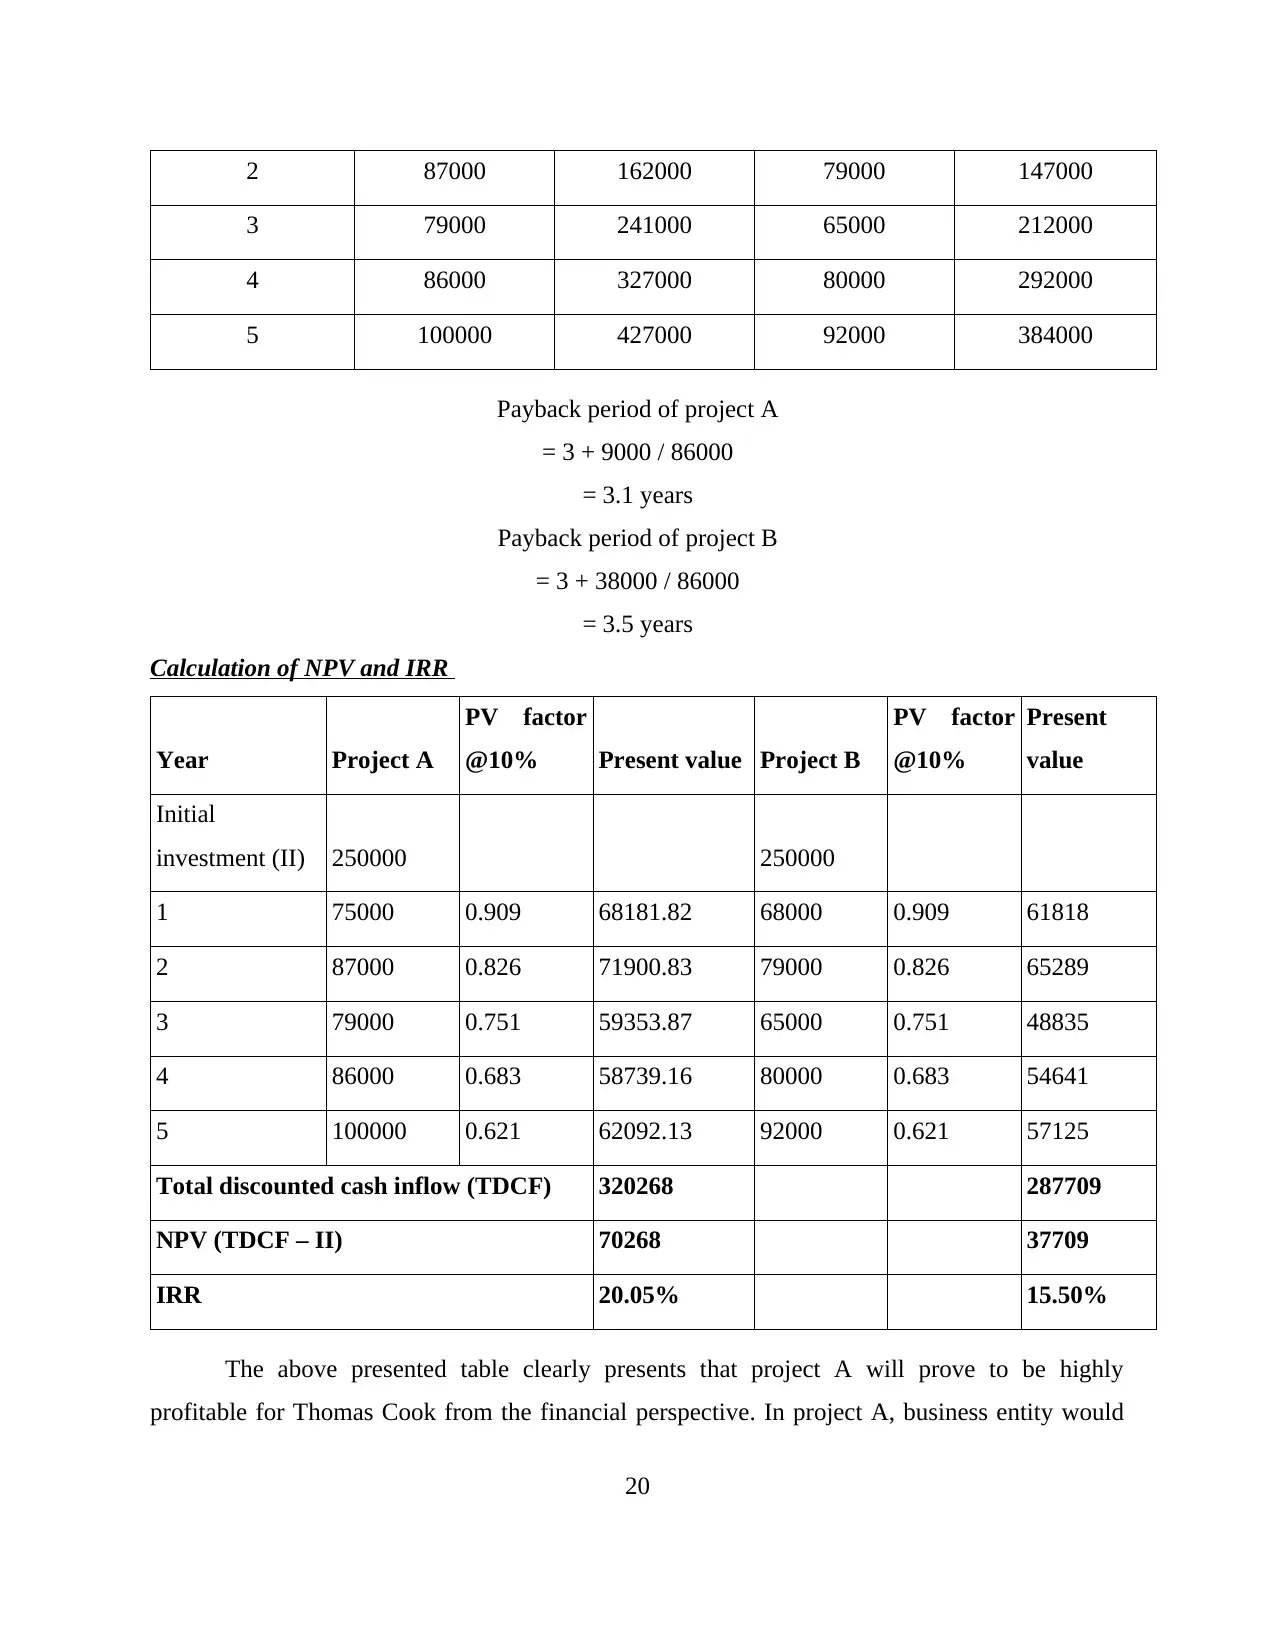
2 87000 162000 79000 147000
3 79000 241000 65000 212000
4 86000 327000 80000 292000
5 100000 427000 92000 384000
Payback period of project A
= 3 + 9000 / 86000
= 3.1 years
Payback period of project B
= 3 + 38000 / 86000
= 3.5 years
Calculation of NPV and IRR
Year Project A
PV factor
@10% Present value Project B
PV factor
@10%
Present
value
Initial
investment (II) 250000 250000
1 75000 0.909 68181.82 68000 0.909 61818
2 87000 0.826 71900.83 79000 0.826 65289
3 79000 0.751 59353.87 65000 0.751 48835
4 86000 0.683 58739.16 80000 0.683 54641
5 100000 0.621 62092.13 92000 0.621 57125
Total discounted cash inflow (TDCF) 320268 287709
NPV (TDCF – II) 70268 37709
IRR 20.05% 15.50%
The above presented table clearly presents that project A will prove to be highly
profitable for Thomas Cook from the financial perspective. In project A, business entity would
20
become able to recoup the initial investment within the period of 3 years and 1 month. On the
other side, business entity has to wait for 3 years and 5 months to recover the amount invested by
them on initial level (Clark. and Leiter, 2014). Further, company will earn higher return from
project A after the period of five years in comparison to proposal B. Besides this, IRR associated
with project A (20.05%) also greater than B (15.5%). Hence, according to the discounted
methods of investment appraisal Thomas Cook needs to invest money in proposal A. The
rationale behind this discounted method offers solution by taking into account the time value of
money concept. Hence, project B will aid in the profit margin and growth aspect of the tour
company to the large extent.
CONCLUSION
From the above report, it has been concluded that customers have positive attitude and
preferences towards the tour packages designed and offered by Thomas Cook to the customers.
However, still the sales of the business unit is decreased over the years. Thus, it is advised to the
product development team of Thomas Cook to add more destination and services in the tour
packages. Along with this, it has been articulated from the statistical analysis that company failed
to gene rate enough amount of profit and sales over the years. Besides this, it can be revealed
from the report that sales aspect of Thomas Cook will decrease in the near future. Further, it can
be inferred that by using the several information system business unit can analyze the data in an
effectual way. It can be seen in the report that investment appraisal techniques help in evaluating
the viability and effectiveness of the proposed investment to the large extent.
21
REFERENCES
Books and Journals
Barlett, P.F. ed., 2016. Agricultural decision making: Anthropological contributions to rural
development. Academic Press.
Clark, M. and Leiter, D., 2014. Does the ideological dispersion of parties mediate the electoral
impact of valence? A cross-national study of party support in nine western European
democracies. Comparative Political Studies. 47(2). pp. 171-202.
Craft, J.L., 2013. A review of the empirical ethical decision-making literature: 2004–2011.
Journal of Business Ethics. 117(2). pp. 221-259.
Gabriele, S. and Chiaravalloti, F., 2013. Using the meteorological information for the regional
rainfall frequency analysis: An application to Sicily. Water resources management. 27(6).
pp. 1721-1735.
García-Peñalvo, F.J. and Conde, M.Á., 2014. Using informal learning for business decision
making and knowledge management. Journal of Business Research. 67(5). pp. 686-691.
Hacklin, F. and Wallnöfer, M., 2012. The business model in the practice of strategic decision
making: insights from a case study. Management Decision. 50(2). pp. 166-188.
Hartman, L.P., DesJardins, J.R. and MacDonald, C., 2014. Business ethics: Decision making for
personal integrity and social responsibility. McGraw-Hill.
Isik, Ö., Jones, M.C. and Sidorova, A., 2013. Business intelligence success: The roles of BI
capabilities and decision environments. Information & Management. 50(1). pp. 13-23.
Liddle, B., 2013. The energy, economic growth, urbanization nexus across development:
Evidence from heterogeneous panel estimates robust to cross-sectional dependence. The
Energy Journal. 34(2). pp. 223-244.
Magni, M. and et.al., 2013. Managing the unexpected across space: Improvisation, dispersion,
and performance in NPD teams. Journal of Product Innovation Management. 30(5). pp.
1009-1026.
Marbach, S. and et.al., 2016. Pruning to increase Taylor dispersion in Physarum polycephalum
networks.Physical Review Letters. 117(17). p. 178103.
Pettigrew, A.M., 2014. The politics of organizational decision-making. Routledge.
22
Secure Best Marks with AI Grader
Need help grading? Try our AI Grader for instant feedback on your assignments.
Popovič, A. and et.al., 2012. Towards business intelligence systems success: Effects of maturity
and culture on analytical decision making. Decision Support Systems. 54(1). pp. 729-739.
Sindhumol, M.R., Srinivasan, M.R. and Gallo, M., 2016. A robust dispersion control chart based
on modified trimmed standard deviation. Electronic Journal of Applied Statistical Analysis.
9(1). pp. 111-121.
Zolfani, S.H. and et.al., 2013. Decision making on business issues with foresight perspective; an
application of new hybrid MCDM model in shopping mall locating. Expert systems with
applications. 40(17). pp. 7111-7121.
Online
Barake, T., 2011. A generalized analysis of multiple-Clad optical fibers with arbitratry Step-
index profiles and applications. [Online]. Accessed
Through:<https://theses.lib.vt.edu/theses/available/etd-3034112939721181/unrestricted/
etd.pdf>: [Accessed on 28th November 2016].
Mean, Median, Mode, and Range. 2013. [Online]. Accessed
Through:<http://mathed.net/files/2013-04-
18_NCTM_Stats_Reasoning_MS_handouts.pdf>: [Accessed on 28th November 2016].
23
1 out of 23
Related Documents


Your All-in-One AI-Powered Toolkit for Academic Success.
+13062052269
info@desklib.com
Available 24*7 on WhatsApp / Email
![[object Object]](/_next/static/media/star-bottom.7253800d.svg)
Unlock your academic potential
© 2024 | Zucol Services PVT LTD | All rights reserved.