Economic Growth in Australia: Factors, Obstacles, and Policies
VerifiedAdded on 2020/03/28
|23
|4200
|147
Report
AI Summary
This report provides a comprehensive analysis of Australia's economic growth from 2012 to 2017. It begins with an overview of Australia's economic landscape, highlighting its open economy, diverse resources, and role in international trade. The report then delves into key economic indicators such as real GDP and its growth rate, examining the factors driving growth, including exports, the housing boom, household consumption, and low inflation. A detailed breakdown of export composition, particularly the contribution of minerals and the visitor economy, is included. The report also identifies obstacles to economic progress, such as slow wage growth and falling business investments, and explores government plans to boost growth through tax reductions, tourism improvements, infrastructure development, and enhanced education. The analysis incorporates relevant data and graphs from sources like The World Bank and the Australian Bureau of Statistics to support its findings. Overall, the report offers a valuable insight into the economic performance of Australia, providing a perspective on its strengths, challenges, and future prospects.
AUSTRALIA’S ECONOMIC GROWTH 1
AUSTRALIA’S ECONOMIC GROWTH
By (Name)
Name of the class (course)
The Course instructor (Professor)
The Institution
The City and State location
The Date
AUSTRALIA’S ECONOMIC GROWTH
By (Name)
Name of the class (course)
The Course instructor (Professor)
The Institution
The City and State location
The Date
Paraphrase This Document
Need a fresh take? Get an instant paraphrase of this document with our AI Paraphraser
AUSTRALIA’S ECONOMIC GROWTH 2
Table of Contents
1.0. Introduction.....................................................................................................................................3
1.1. Brief overview of Australia.........................................................................................................3
1.2. Real Gross Domestic Product......................................................................................................3
1.3. Real GDP Growth Rate................................................................................................................4
2.0. Australia’s Economic Growth..........................................................................................................4
2.1. Sources of Economic Growth Rate in Australia...........................................................................5
2.1.1. Growth in exports................................................................................................................5
2.1.1.1. Export composition 2015-2016 financial years............................................................6
2.1.1.2. Strong Performance of Visitor Economy Exports........................................................6
2.1.1.3. Export of Minerals........................................................................................................7
2.1.2. Housing Boom.....................................................................................................................9
2.1.3. Rise in Household Consumption........................................................................................10
2.1.4. Low and Relatively Stable Inflation...................................................................................12
2.2. Obstacles to Australian Economic Progress...............................................................................14
2.2.1. Slow Wage Growth............................................................................................................14
2.2.2. Business Investments are falling........................................................................................14
2.2.3. Lagging Business Confidence.............................................................................................16
2.3. Government Plans to Boost Economic Growth and Development.............................................16
2.3.1. Reduction of Taxes............................................................................................................17
2.3.2. Improving Tourism Industry..............................................................................................17
2.3.3. Infrastructure Development...............................................................................................18
2.3.4. Enhancing Education and Training....................................................................................19
Conclusion.................................................................................................................................................19
Bibliography..............................................................................................................................................21
AUSTRALIA’S ECONOMIC GROWTH 3
1.0. Introduction
1.1. Brief overview of Australia
Australia has experienced a remarkable economic growth untouched by the recession
since 1991. This country has an open economy characterized by minimal restrictions on goods
and services from the international market. Australia’s diverse and plenteous natural resources
have attracted high number of foreign direct investments. This country is a net exporter of food,
energy and other natural resources like iron ore. The services are essential to economic progress
as they contribute approximately 75% of the employment and 70% of the Gross Domestic
Product (Central Intelligence Agency, 2017). The government of this country allows
considerable autonomy in the economy and thus Australia is ranked fifth when it comes to
economic freedom. Moreover, Australia undertakes a crucial role in the G-20, Pacific Economic
Cooperation (APEC), World Trade Organization (WTO), and other trade agreements. The top
trading partners of this economy incorporate China, Japan, South Korea, United States and India
(Globaledge, 2017). Therefore, this report assesses economic growth in Australia from 2012 to
2017. The paper analyzes trends in the real GDP growth rate, factors causing economic growth,
headwinds to economic progress and government measures to attain potential Gross Domestic
Product.
1.2. Real Gross Domestic Product
Real Gross Domestic Product refers to an economic instrument that appraises the
inflation-adjusted market prices of the overall goods and services manufactured in an economy
during a particular period. This measure avails a broad estimation of economic expansion, and it
is also an important gauge of the health of an economy (Arnold, 2013, p.65). Therefore, the
⊘ This is a preview!⊘
Do you want full access?
Subscribe today to unlock all pages.
Trusted by 1+ million students worldwide
AUSTRALIA’S ECONOMIC GROWTH 4
government and other policymakers make use of the real GDP to determine if an economy needs
a boost or restraint.
1.3. Real GDP Growth Rate
Real GDP growth rate entails the annual percentage variations in the real Gross Domestic
Product. By assessing the real GDP growth rate, we can tell if an economy is contracting or
expanding. Furthermore, the investors usually make use of this measure to make adjustments in
their investment portfolios (Boyes & Melvin, 2012, p.72). Those economies with high GDP
growth rate are known to attract a large number of investors for their corporate bonds and stocks.
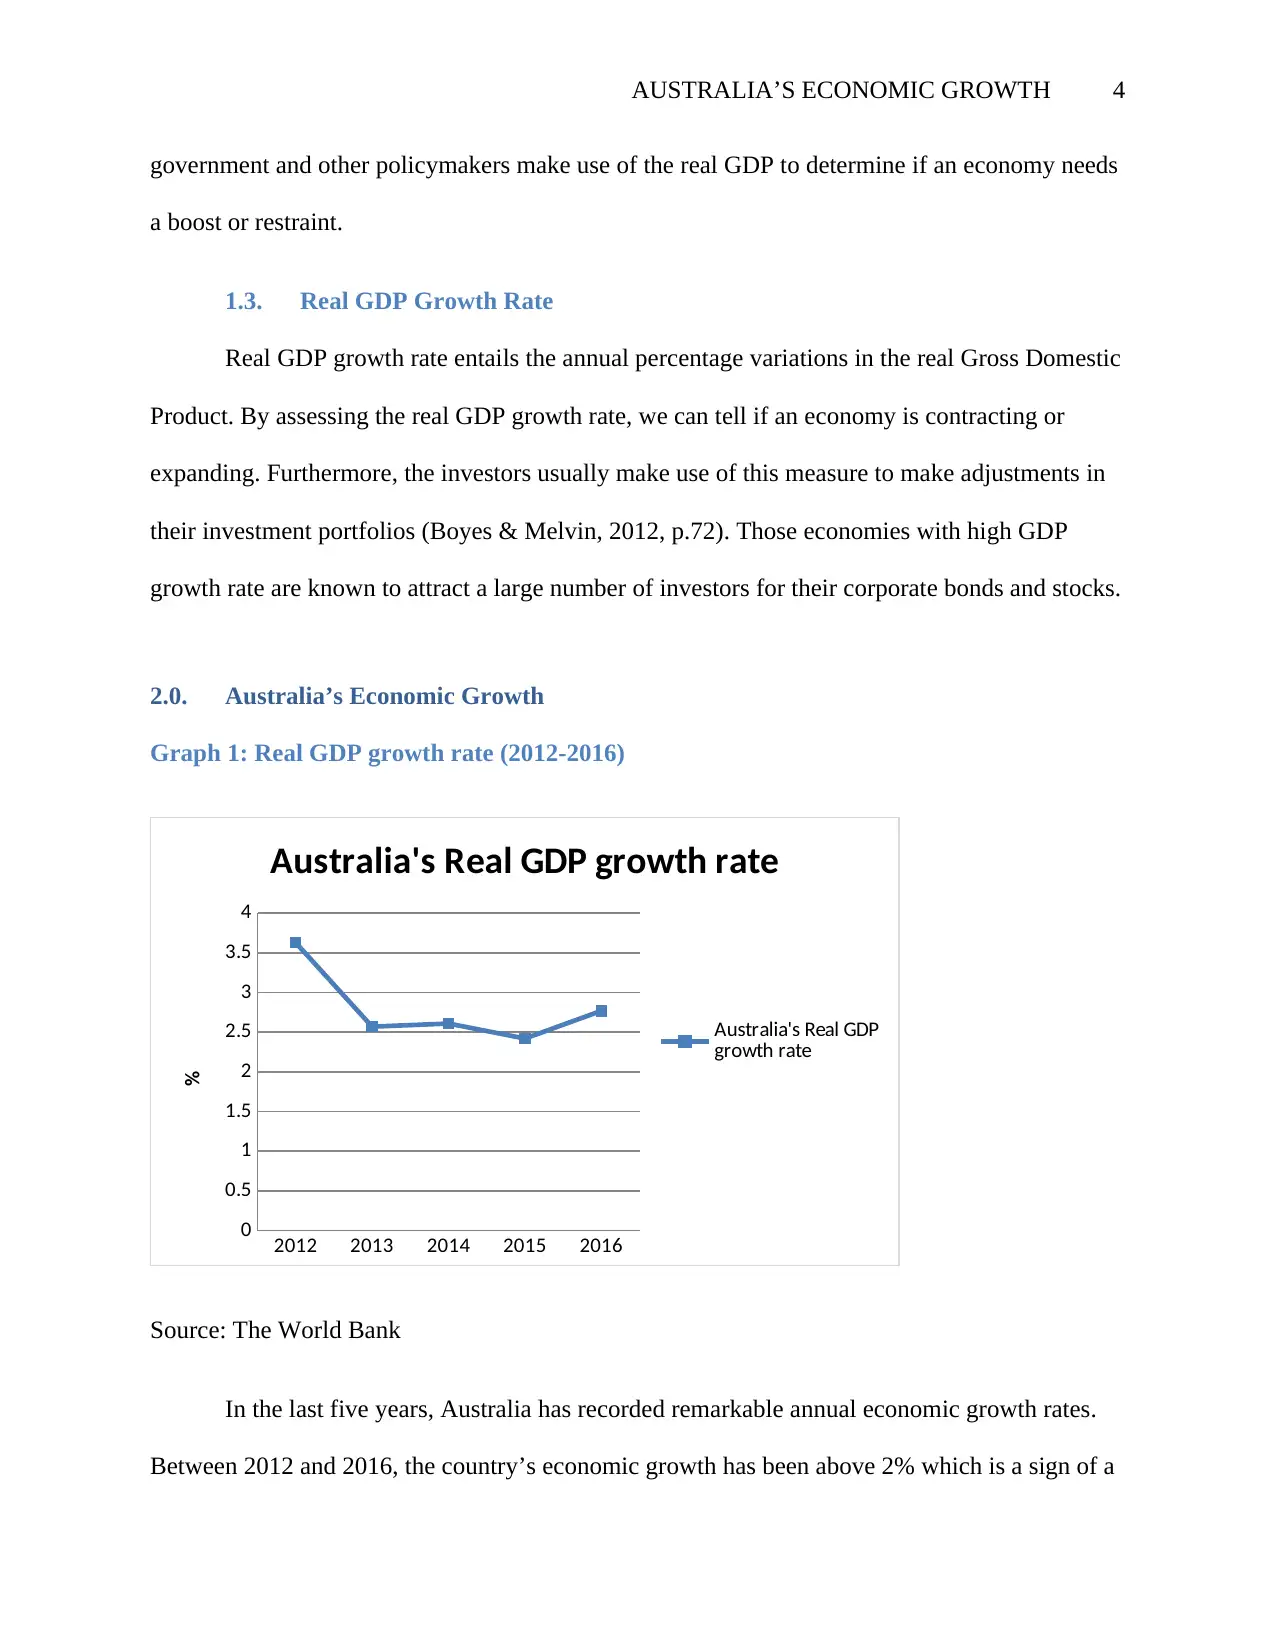
2.0. Australia’s Economic Growth
Graph 1: Real GDP growth rate (2012-2016)
2012 2013 2014 2015 2016
0
0.5
1
1.5
2
2.5
3
3.5
4
Australia's Real GDP growth rate
Australia's Real GDP
growth rate
%
Source: The World Bank
In the last five years, Australia has recorded remarkable annual economic growth rates.
Between 2012 and 2016, the country’s economic growth has been above 2% which is a sign of a
government and other policymakers make use of the real GDP to determine if an economy needs
a boost or restraint.
1.3. Real GDP Growth Rate
Real GDP growth rate entails the annual percentage variations in the real Gross Domestic
Product. By assessing the real GDP growth rate, we can tell if an economy is contracting or
expanding. Furthermore, the investors usually make use of this measure to make adjustments in
their investment portfolios (Boyes & Melvin, 2012, p.72). Those economies with high GDP
growth rate are known to attract a large number of investors for their corporate bonds and stocks.
2.0. Australia’s Economic Growth
Graph 1: Real GDP growth rate (2012-2016)
2012 2013 2014 2015 2016
0
0.5
1
1.5
2
2.5
3
3.5
4
Australia's Real GDP growth rate
Australia's Real GDP
growth rate
%
Source: The World Bank
In the last five years, Australia has recorded remarkable annual economic growth rates.
Between 2012 and 2016, the country’s economic growth has been above 2% which is a sign of a
Paraphrase This Document
Need a fresh take? Get an instant paraphrase of this document with our AI Paraphraser
AUSTRALIA’S ECONOMIC GROWTH 5
healthy economy. However, it is evident that the economic expansion registered in 2012 was
higher than that of the four successive years. In 2012, the country’s economic growth rate was
3.63% while in 2016 the growth rate stood at 2.77% (The World Bank, 2017).
2.1. Sources of Economic Growth Rate in Australia
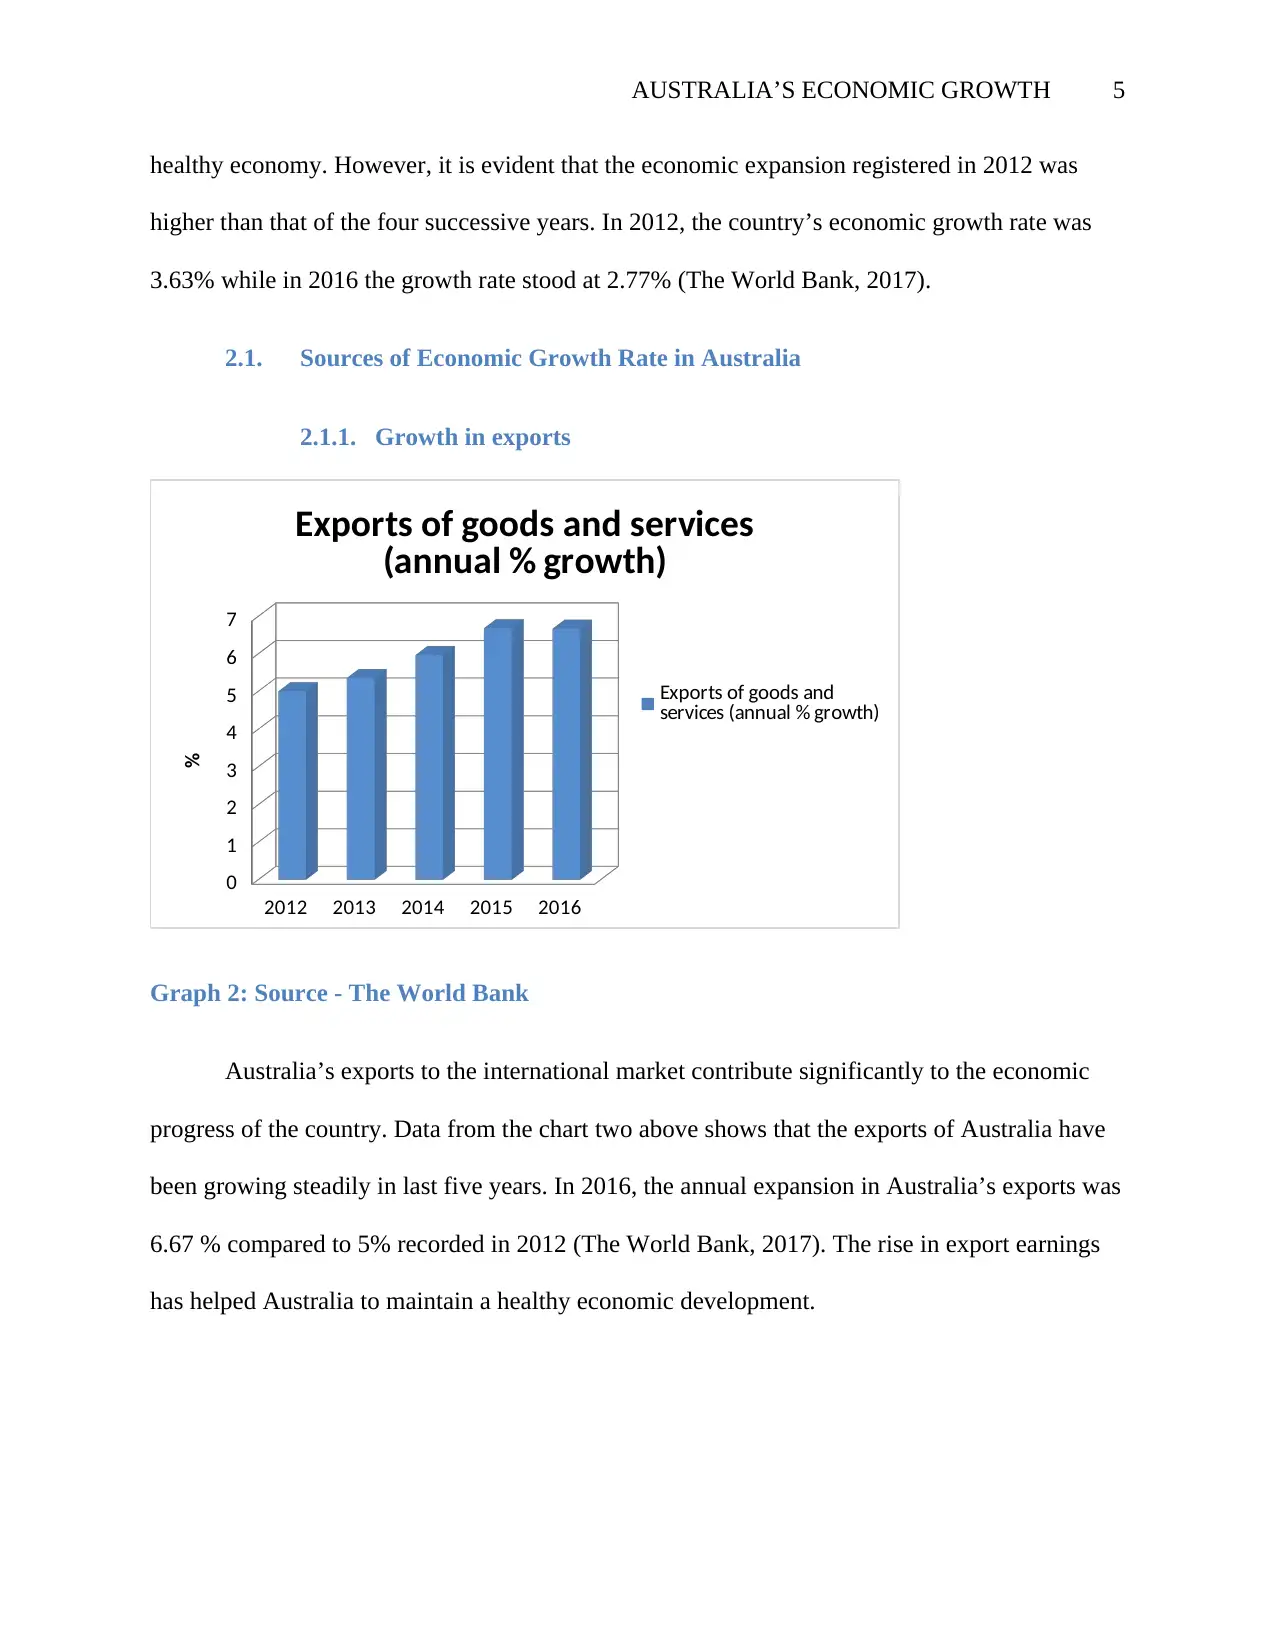
2.1.1. Growth in exports
2012 2013 2014 2015 2016
0
1
2
3
4
5
6
7
Exports of goods and services
(annual % growth)
Exports of goods and
services (annual % growth)
%
Graph 2: Source - The World Bank
Australia’s exports to the international market contribute significantly to the economic
progress of the country. Data from the chart two above shows that the exports of Australia have
been growing steadily in last five years. In 2016, the annual expansion in Australia’s exports was
6.67 % compared to 5% recorded in 2012 (The World Bank, 2017). The rise in export earnings
has helped Australia to maintain a healthy economic development.
healthy economy. However, it is evident that the economic expansion registered in 2012 was
higher than that of the four successive years. In 2012, the country’s economic growth rate was
3.63% while in 2016 the growth rate stood at 2.77% (The World Bank, 2017).
2.1. Sources of Economic Growth Rate in Australia
2.1.1. Growth in exports
2012 2013 2014 2015 2016
0
1
2
3
4
5
6
7
Exports of goods and services
(annual % growth)
Exports of goods and
services (annual % growth)
%
Graph 2: Source - The World Bank
Australia’s exports to the international market contribute significantly to the economic
progress of the country. Data from the chart two above shows that the exports of Australia have
been growing steadily in last five years. In 2016, the annual expansion in Australia’s exports was
6.67 % compared to 5% recorded in 2012 (The World Bank, 2017). The rise in export earnings
has helped Australia to maintain a healthy economic development.
AUSTRALIA’S ECONOMIC GROWTH 6
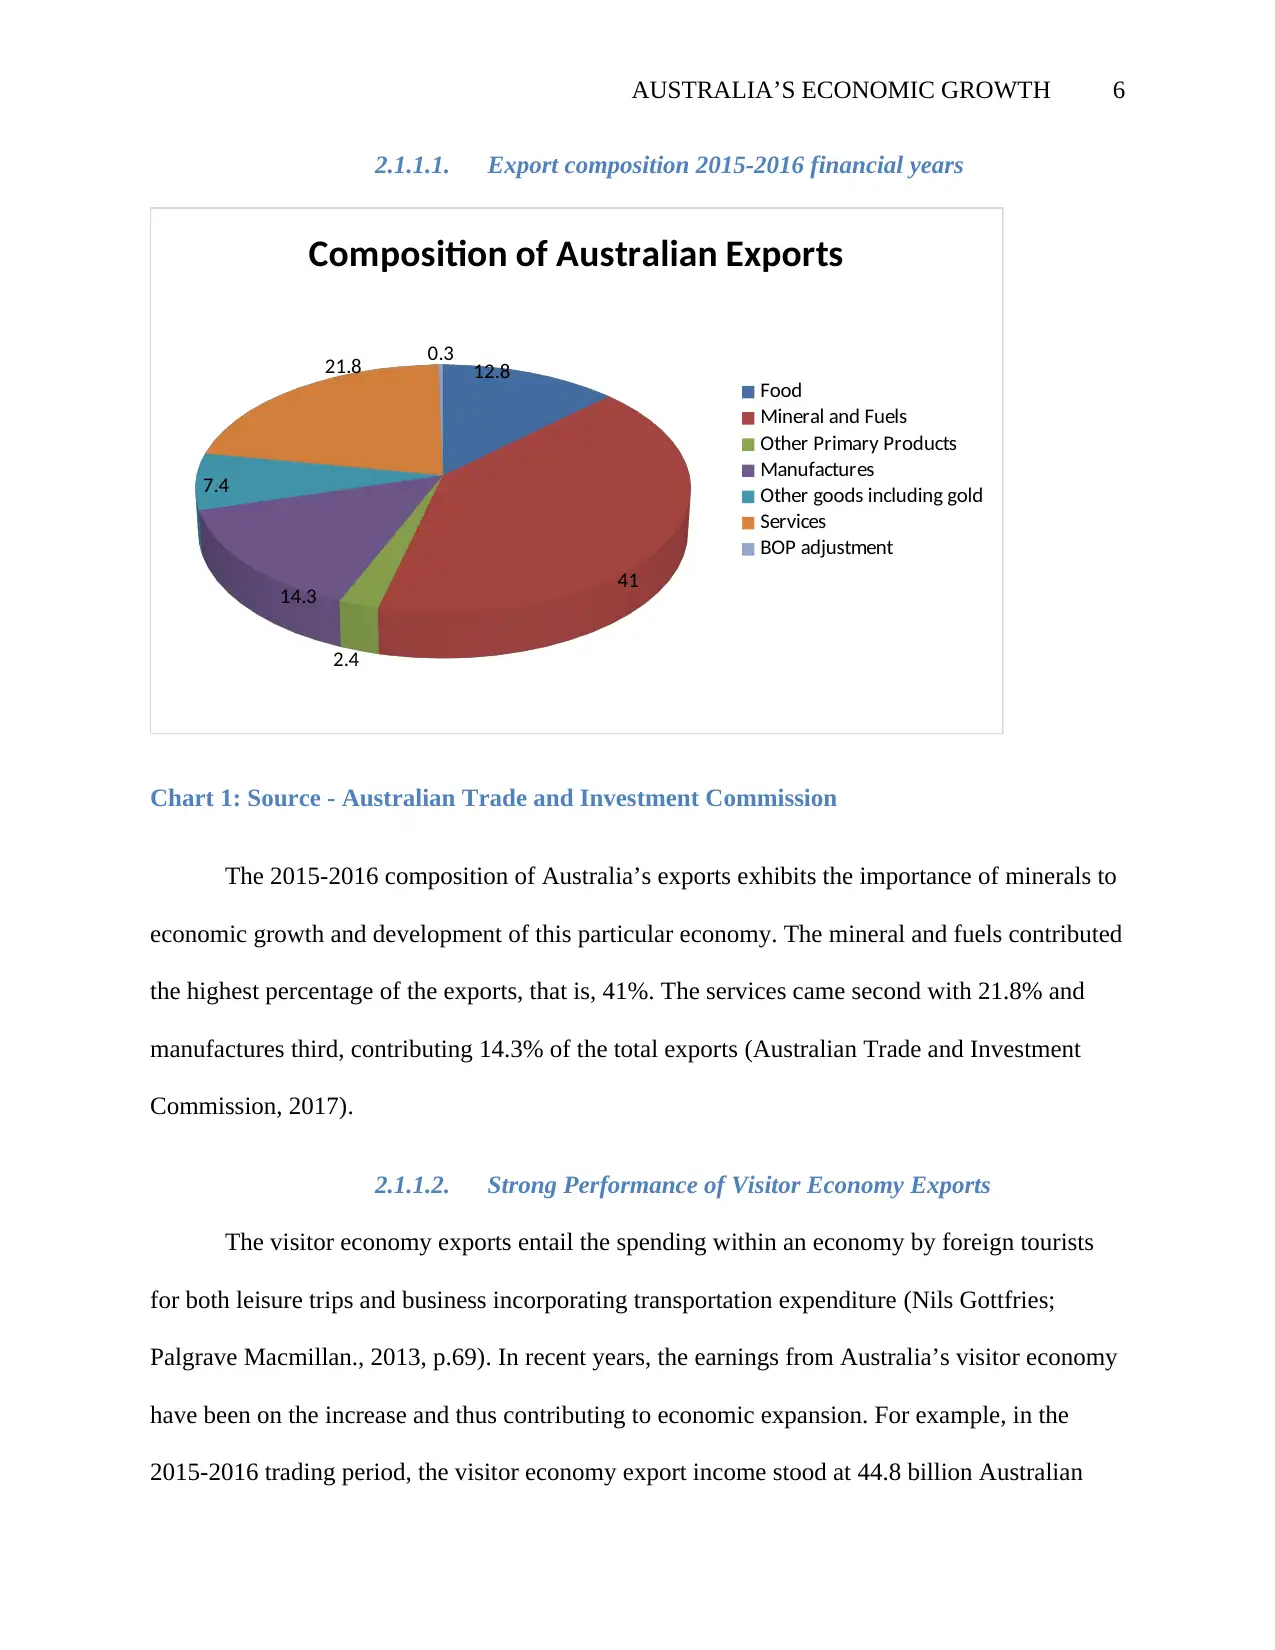
2.1.1.1. Export composition 2015-2016 financial years
12.8
41
2.4
14.3
7.4
21.8 0.3
Composition of Australian Exports
Food
Mineral and Fuels
Other Primary Products
Manufactures
Other goods including gold
Services
BOP adjustment
Chart 1: Source - Australian Trade and Investment Commission
The 2015-2016 composition of Australia’s exports exhibits the importance of minerals to
economic growth and development of this particular economy. The mineral and fuels contributed
the highest percentage of the exports, that is, 41%. The services came second with 21.8% and
manufactures third, contributing 14.3% of the total exports (Australian Trade and Investment
Commission, 2017).
2.1.1.2. Strong Performance of Visitor Economy Exports
The visitor economy exports entail the spending within an economy by foreign tourists
for both leisure trips and business incorporating transportation expenditure (Nils Gottfries;
Palgrave Macmillan., 2013, p.69). In recent years, the earnings from Australia’s visitor economy
have been on the increase and thus contributing to economic expansion. For example, in the
2015-2016 trading period, the visitor economy export income stood at 44.8 billion Australian
⊘ This is a preview!⊘
Do you want full access?
Subscribe today to unlock all pages.
Trusted by 1+ million students worldwide
AUSTRALIA’S ECONOMIC GROWTH 7
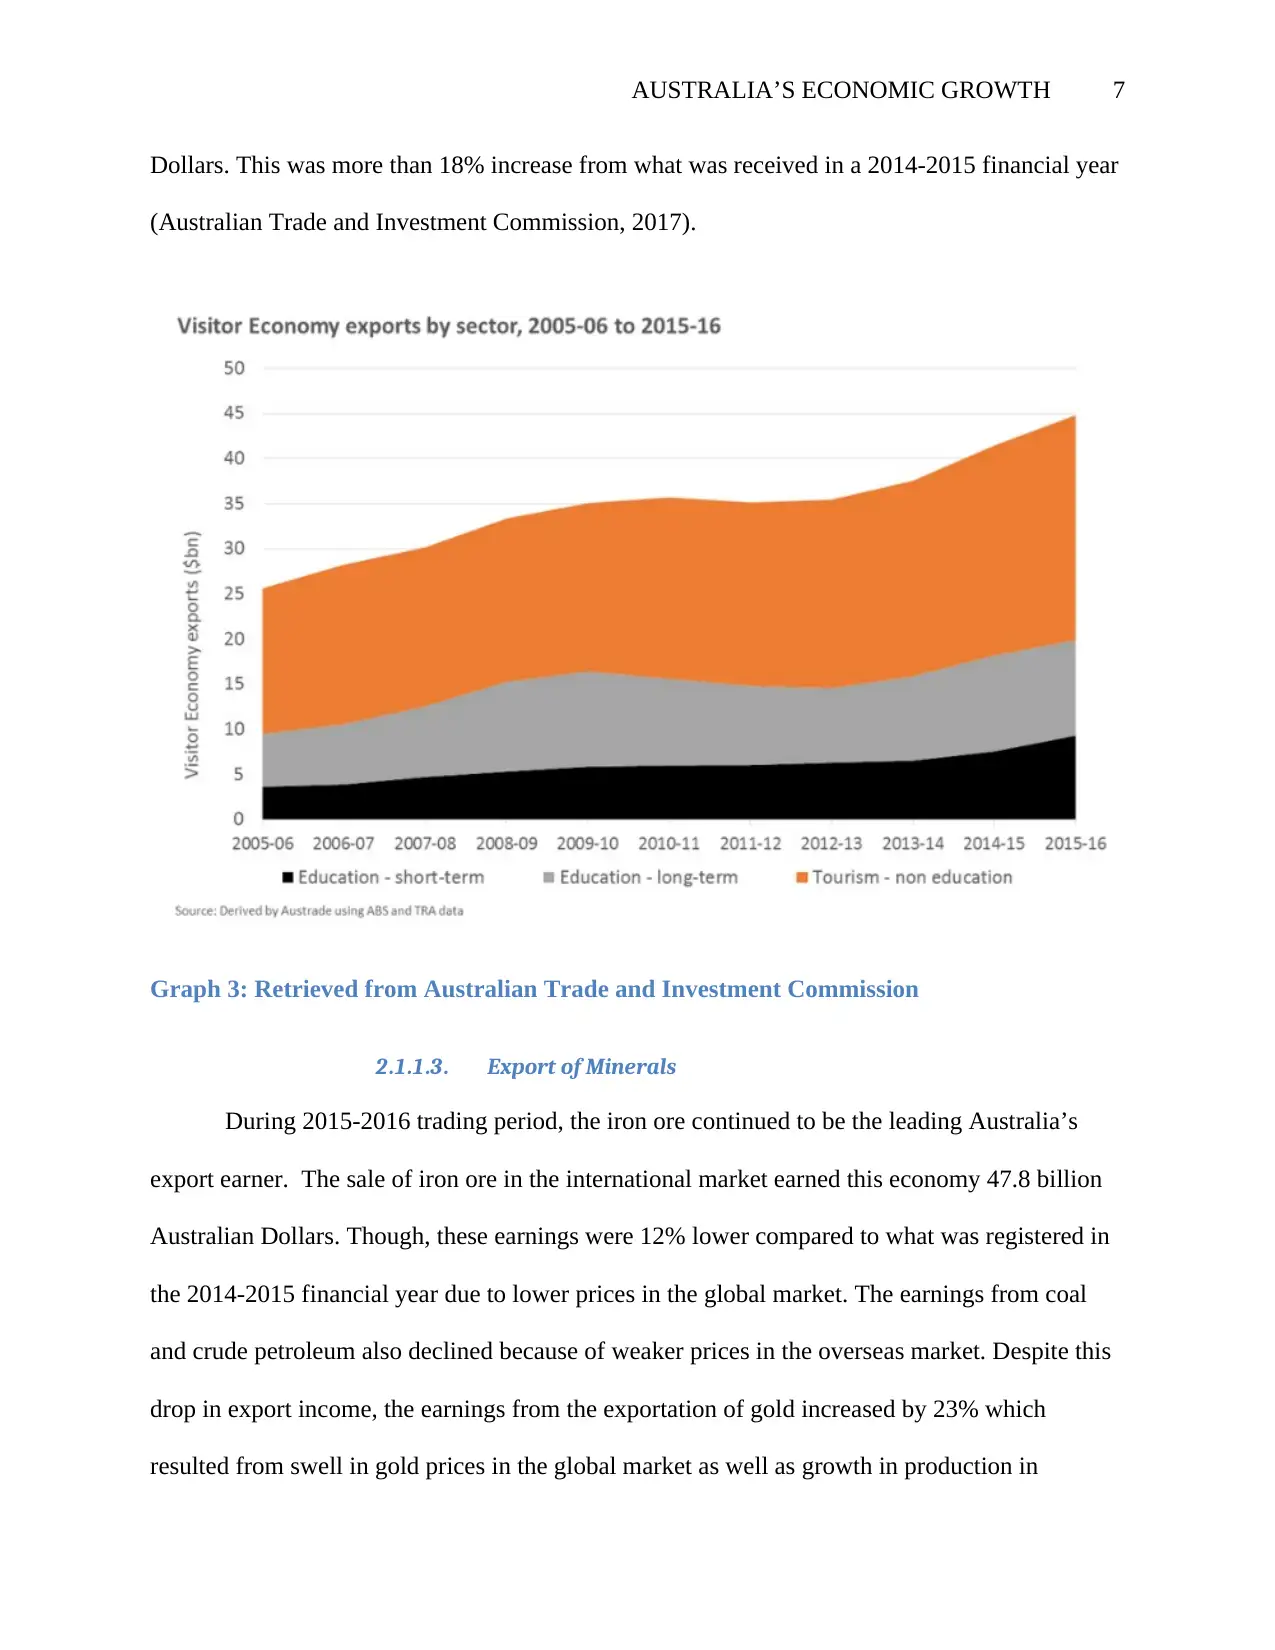
Dollars. This was more than 18% increase from what was received in a 2014-2015 financial year
(Australian Trade and Investment Commission, 2017).
Graph 3: Retrieved from Australian Trade and Investment Commission
2.1.1.3. Export of Minerals
During 2015-2016 trading period, the iron ore continued to be the leading Australia’s
export earner. The sale of iron ore in the international market earned this economy 47.8 billion
Australian Dollars. Though, these earnings were 12% lower compared to what was registered in
the 2014-2015 financial year due to lower prices in the global market. The earnings from coal
and crude petroleum also declined because of weaker prices in the overseas market. Despite this
drop in export income, the earnings from the exportation of gold increased by 23% which
resulted from swell in gold prices in the global market as well as growth in production in
Paraphrase This Document
Need a fresh take? Get an instant paraphrase of this document with our AI Paraphraser
AUSTRALIA’S ECONOMIC GROWTH 8
Australia (Australian Trade and Investment Commission, 2017). Liquefied Natural Gas is also
another crucial resource contributing to economic expansion in Australia. For instance, 2015-
2016 trading year, Liquefied Natural Gas contributed roughly 0.5% to the economic growth.
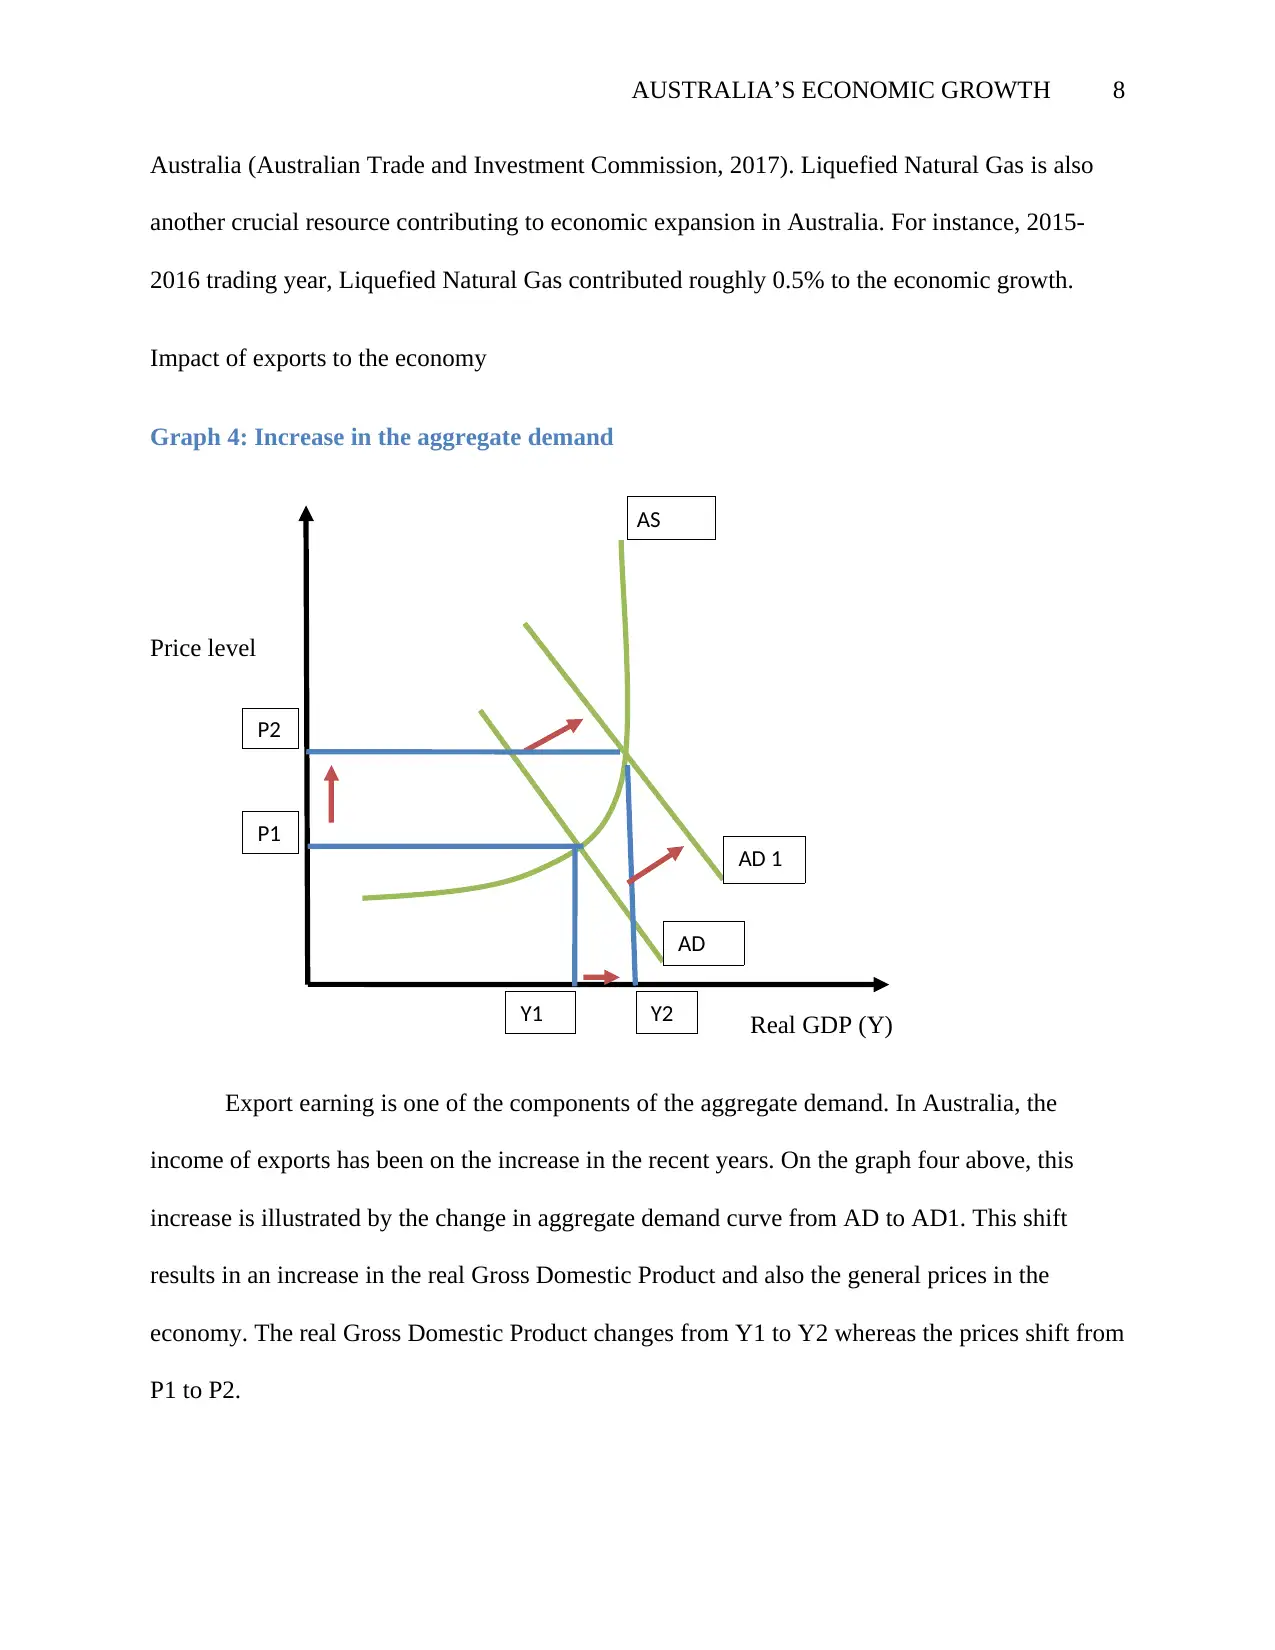
Impact of exports to the economy
Graph 4: Increase in the aggregate demand
Price level
Real GDP (Y)
Export earning is one of the components of the aggregate demand. In Australia, the
income of exports has been on the increase in the recent years. On the graph four above, this
increase is illustrated by the change in aggregate demand curve from AD to AD1. This shift
results in an increase in the real Gross Domestic Product and also the general prices in the
economy. The real Gross Domestic Product changes from Y1 to Y2 whereas the prices shift from
P1 to P2.
AS
P2
P1
AD 1
AD
Y2Y1
Australia (Australian Trade and Investment Commission, 2017). Liquefied Natural Gas is also
another crucial resource contributing to economic expansion in Australia. For instance, 2015-
2016 trading year, Liquefied Natural Gas contributed roughly 0.5% to the economic growth.
Impact of exports to the economy
Graph 4: Increase in the aggregate demand
Price level
Real GDP (Y)
Export earning is one of the components of the aggregate demand. In Australia, the
income of exports has been on the increase in the recent years. On the graph four above, this
increase is illustrated by the change in aggregate demand curve from AD to AD1. This shift
results in an increase in the real Gross Domestic Product and also the general prices in the
economy. The real Gross Domestic Product changes from Y1 to Y2 whereas the prices shift from
P1 to P2.
AS
P2
P1
AD 1
AD
Y2Y1
AUSTRALIA’S ECONOMIC GROWTH 9
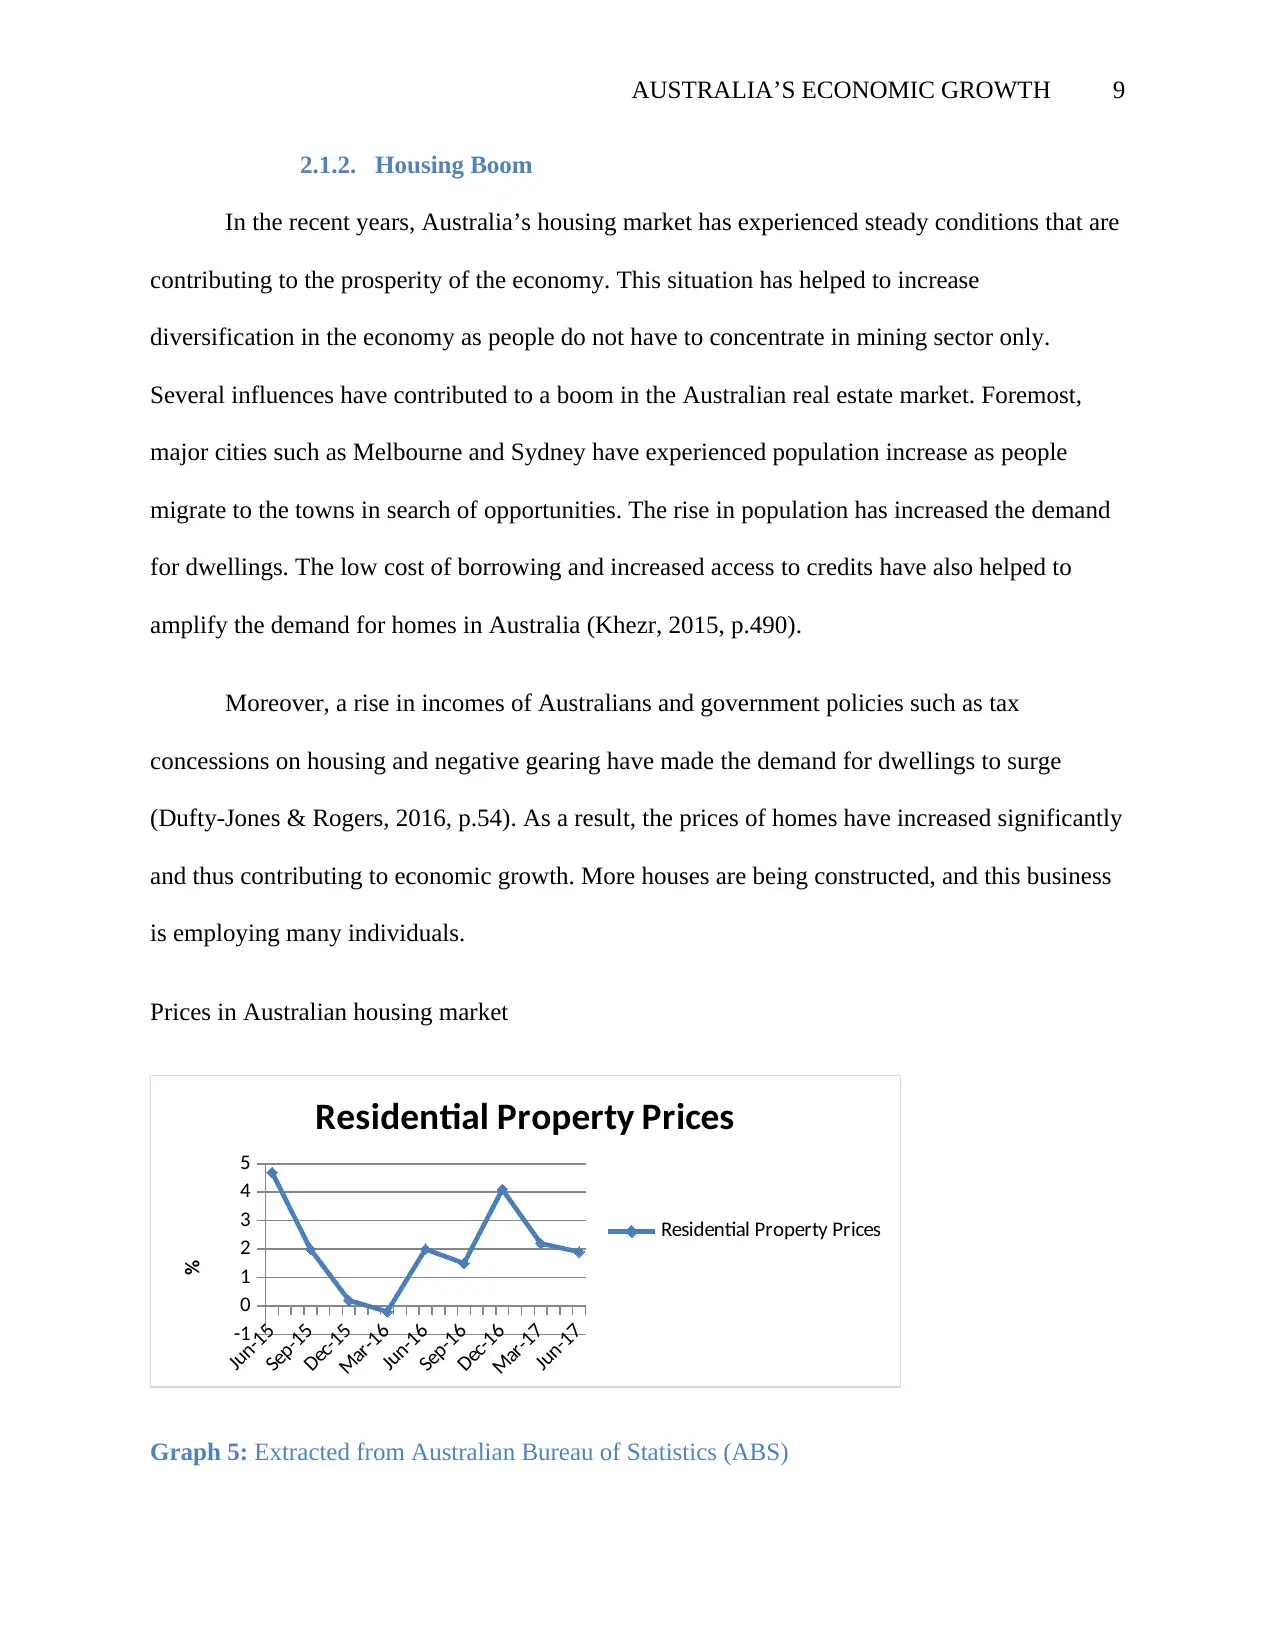
2.1.2. Housing Boom
In the recent years, Australia’s housing market has experienced steady conditions that are
contributing to the prosperity of the economy. This situation has helped to increase
diversification in the economy as people do not have to concentrate in mining sector only.
Several influences have contributed to a boom in the Australian real estate market. Foremost,
major cities such as Melbourne and Sydney have experienced population increase as people
migrate to the towns in search of opportunities. The rise in population has increased the demand
for dwellings. The low cost of borrowing and increased access to credits have also helped to
amplify the demand for homes in Australia (Khezr, 2015, p.490).
Moreover, a rise in incomes of Australians and government policies such as tax
concessions on housing and negative gearing have made the demand for dwellings to surge
(Dufty-Jones & Rogers, 2016, p.54). As a result, the prices of homes have increased significantly
and thus contributing to economic growth. More houses are being constructed, and this business
is employing many individuals.
Prices in Australian housing market
Jun-15
Sep-15
Dec-15
Mar-16
Jun-16
Sep-16
Dec-16
Mar-17
Jun-17-1
0
1
2
3
4
5
Residential Property Prices
Residential Property Prices
%
Graph 5: Extracted from Australian Bureau of Statistics (ABS)
⊘ This is a preview!⊘
Do you want full access?
Subscribe today to unlock all pages.
Trusted by 1+ million students worldwide
AUSTRALIA’S ECONOMIC GROWTH 10
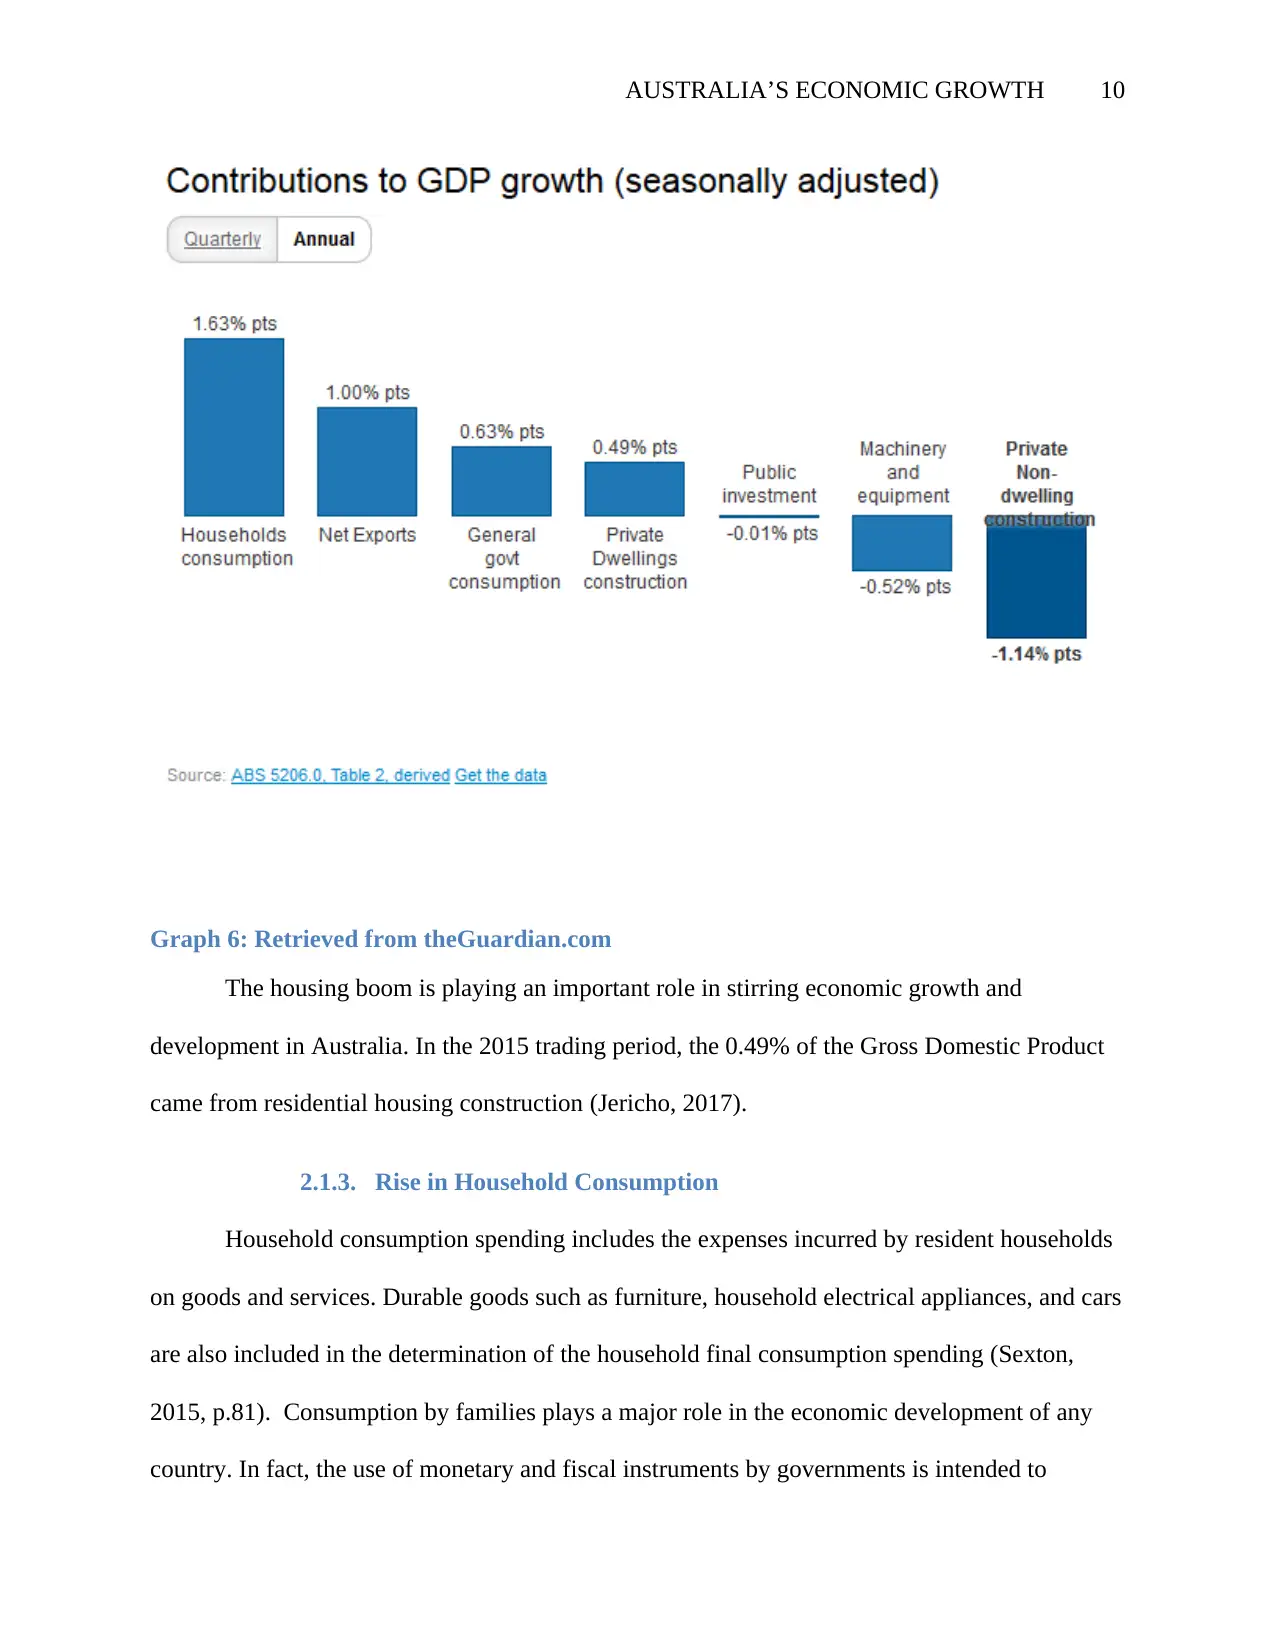
Graph 6: Retrieved from theGuardian.com
The housing boom is playing an important role in stirring economic growth and
development in Australia. In the 2015 trading period, the 0.49% of the Gross Domestic Product
came from residential housing construction (Jericho, 2017).
2.1.3. Rise in Household Consumption
Household consumption spending includes the expenses incurred by resident households
on goods and services. Durable goods such as furniture, household electrical appliances, and cars
are also included in the determination of the household final consumption spending (Sexton,
2015, p.81). Consumption by families plays a major role in the economic development of any
country. In fact, the use of monetary and fiscal instruments by governments is intended to
Paraphrase This Document
Need a fresh take? Get an instant paraphrase of this document with our AI Paraphraser
AUSTRALIA’S ECONOMIC GROWTH 11
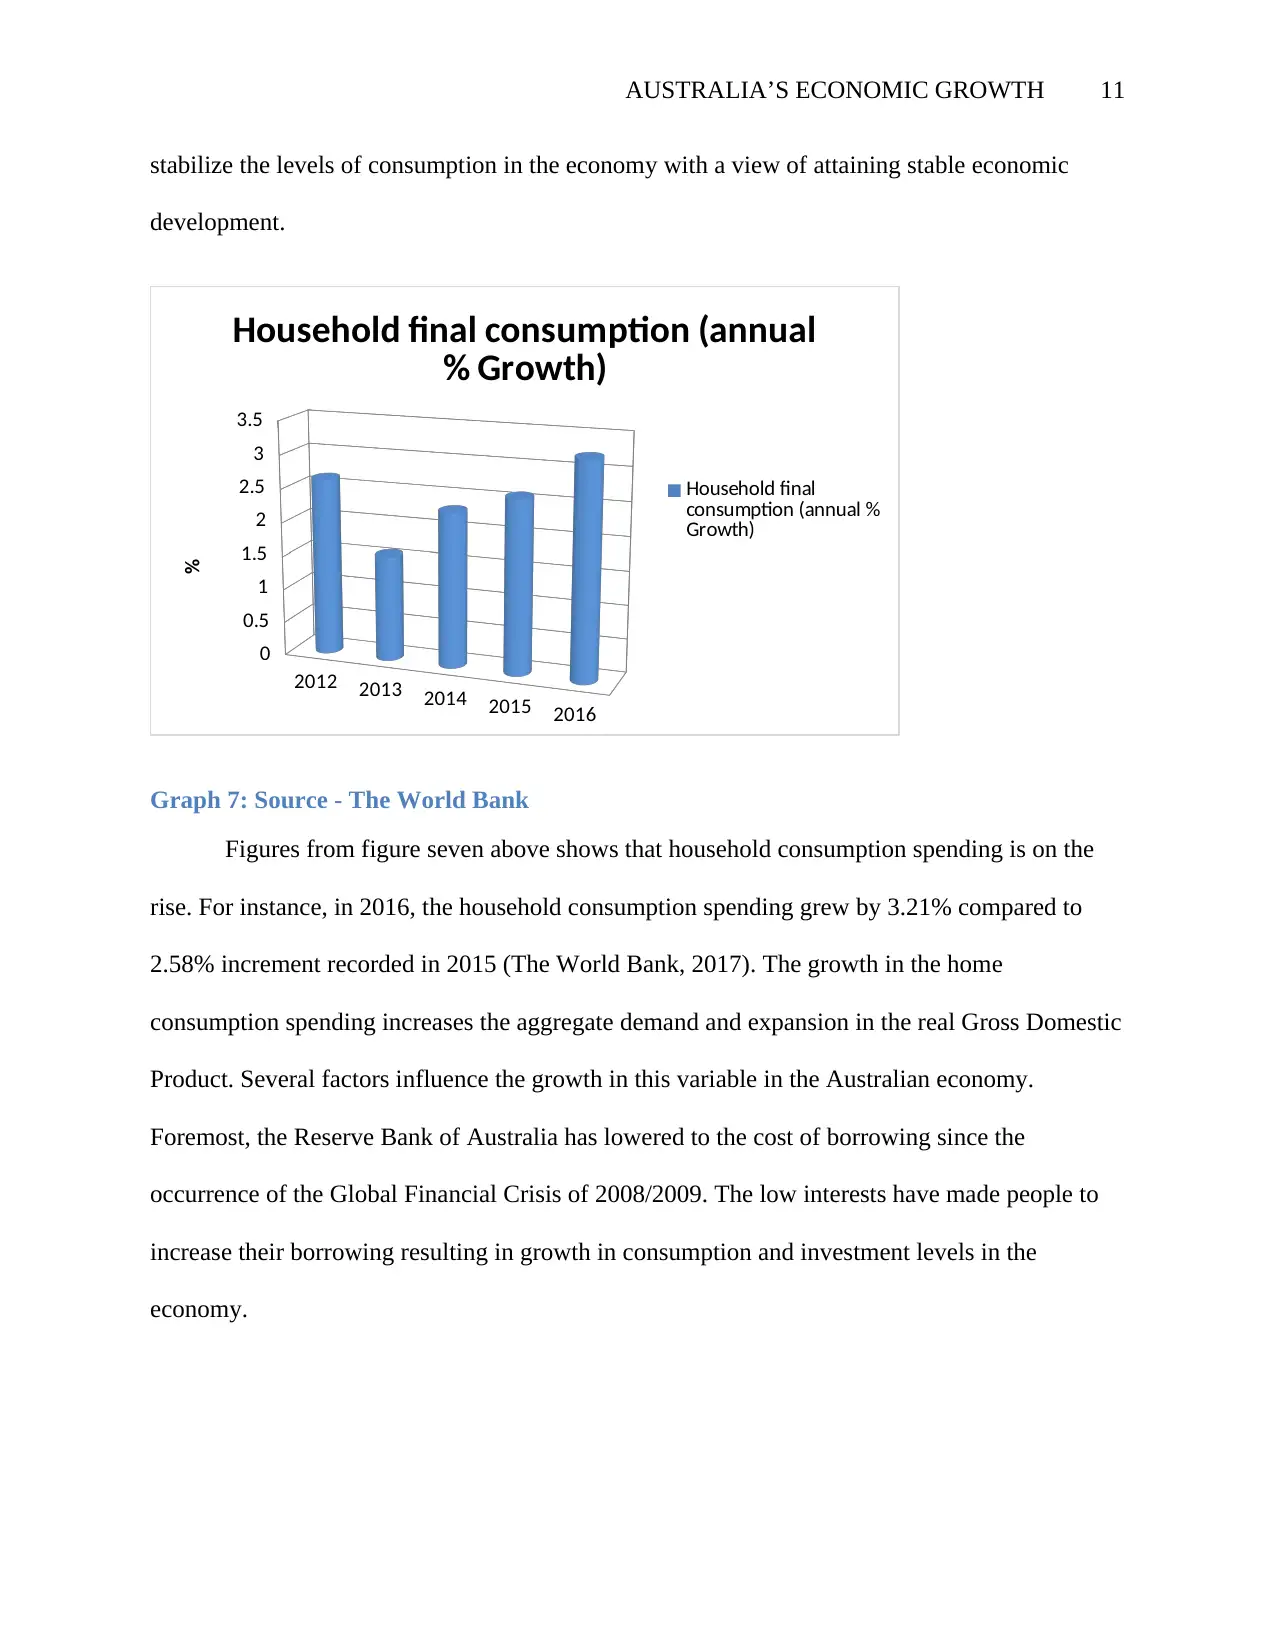
stabilize the levels of consumption in the economy with a view of attaining stable economic
development.
2012 2013 2014 2015 2016
0
0.5
1
1.5
2
2.5
3
3.5
Household final consumption (annual
% Growth)
Household final
consumption (annual %
Growth)
%
Graph 7: Source - The World Bank
Figures from figure seven above shows that household consumption spending is on the
rise. For instance, in 2016, the household consumption spending grew by 3.21% compared to
2.58% increment recorded in 2015 (The World Bank, 2017). The growth in the home
consumption spending increases the aggregate demand and expansion in the real Gross Domestic
Product. Several factors influence the growth in this variable in the Australian economy.
Foremost, the Reserve Bank of Australia has lowered to the cost of borrowing since the
occurrence of the Global Financial Crisis of 2008/2009. The low interests have made people to
increase their borrowing resulting in growth in consumption and investment levels in the
economy.
AUSTRALIA’S ECONOMIC GROWTH 12
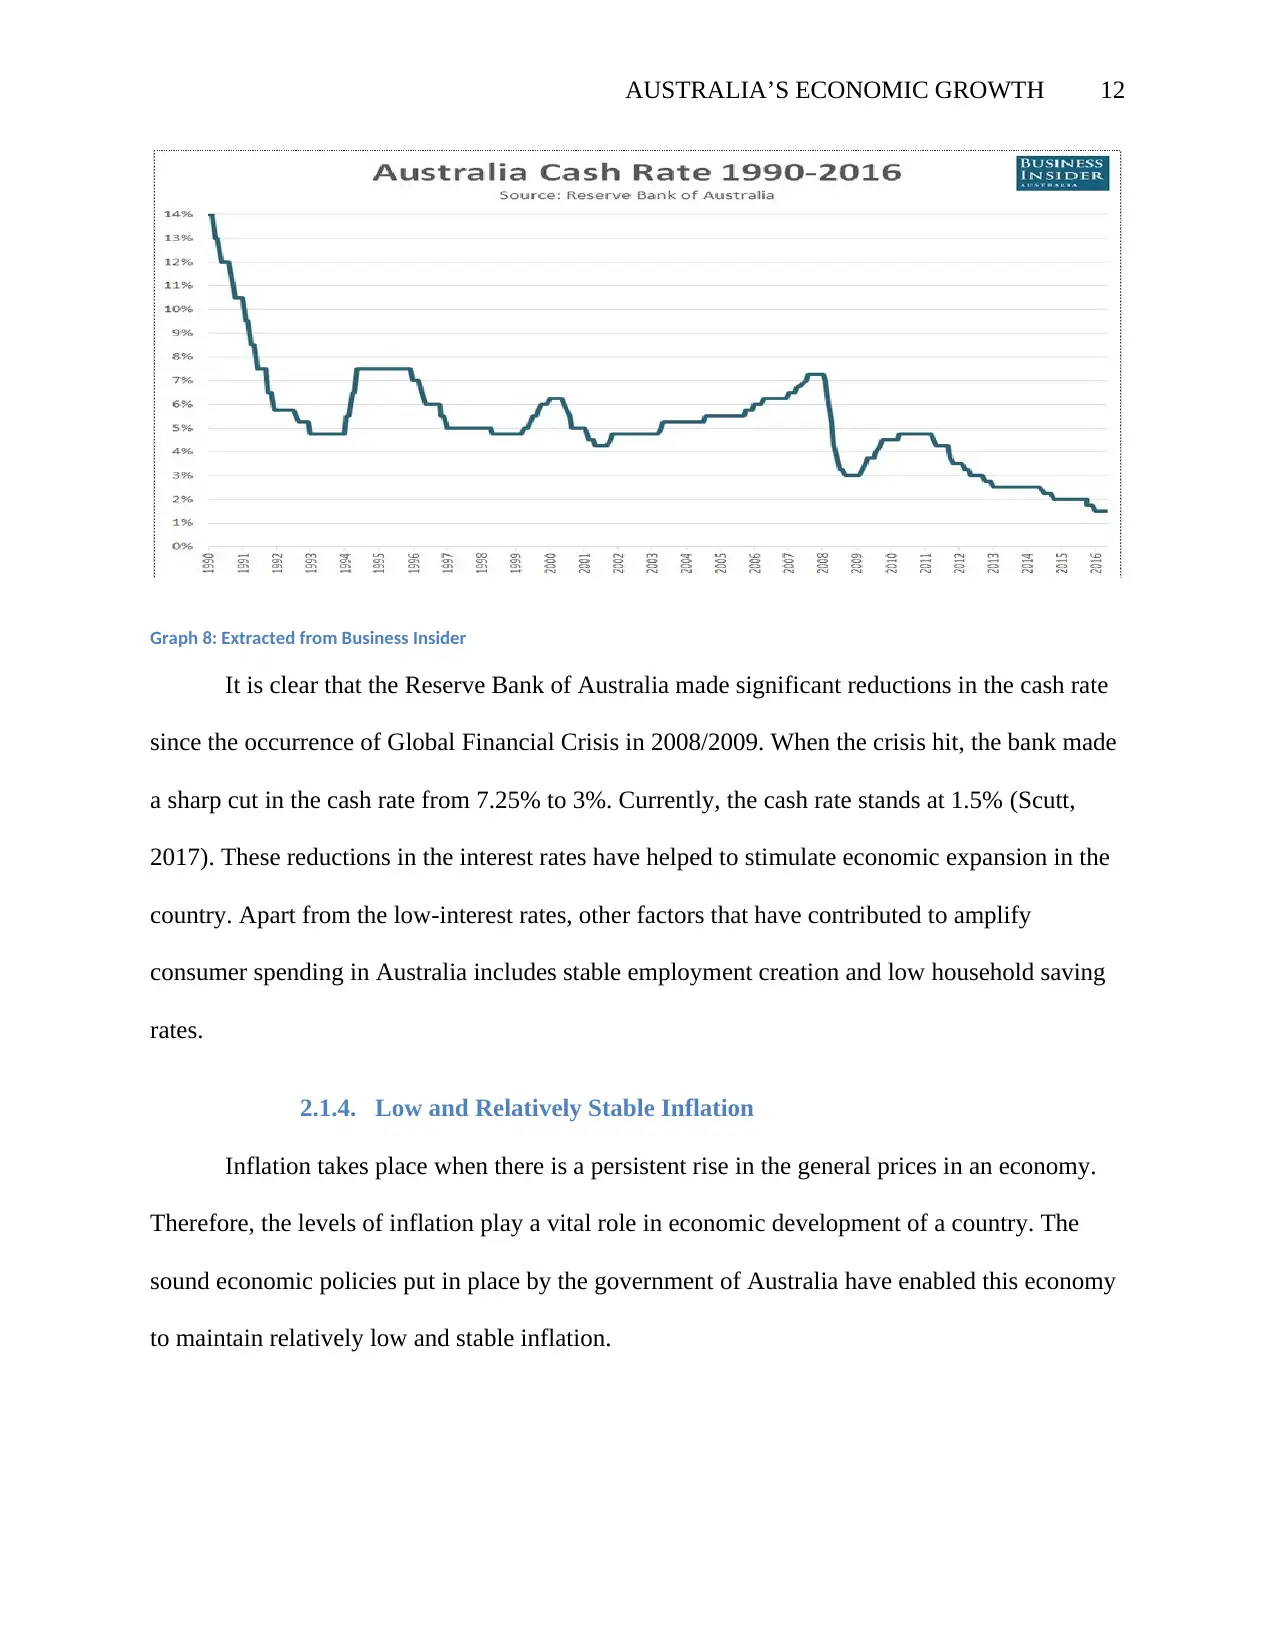
Graph 8: Extracted from Business Insider
It is clear that the Reserve Bank of Australia made significant reductions in the cash rate
since the occurrence of Global Financial Crisis in 2008/2009. When the crisis hit, the bank made
a sharp cut in the cash rate from 7.25% to 3%. Currently, the cash rate stands at 1.5% (Scutt,
2017). These reductions in the interest rates have helped to stimulate economic expansion in the
country. Apart from the low-interest rates, other factors that have contributed to amplify
consumer spending in Australia includes stable employment creation and low household saving
rates.
2.1.4. Low and Relatively Stable Inflation
Inflation takes place when there is a persistent rise in the general prices in an economy.
Therefore, the levels of inflation play a vital role in economic development of a country. The
sound economic policies put in place by the government of Australia have enabled this economy
to maintain relatively low and stable inflation.
⊘ This is a preview!⊘
Do you want full access?
Subscribe today to unlock all pages.
Trusted by 1+ million students worldwide
1 out of 23
Related Documents


Your All-in-One AI-Powered Toolkit for Academic Success.
+13062052269
info@desklib.com
Available 24*7 on WhatsApp / Email
![[object Object]](/_next/static/media/star-bottom.7253800d.svg)
Unlock your academic potential
Copyright © 2020–2026 A2Z Services. All Rights Reserved. Developed and managed by ZUCOL.