Report: Potential Adoption of Power BI by Small Businesses
VerifiedAdded on 2023/01/13
|4
|1360
|26
Report
AI Summary
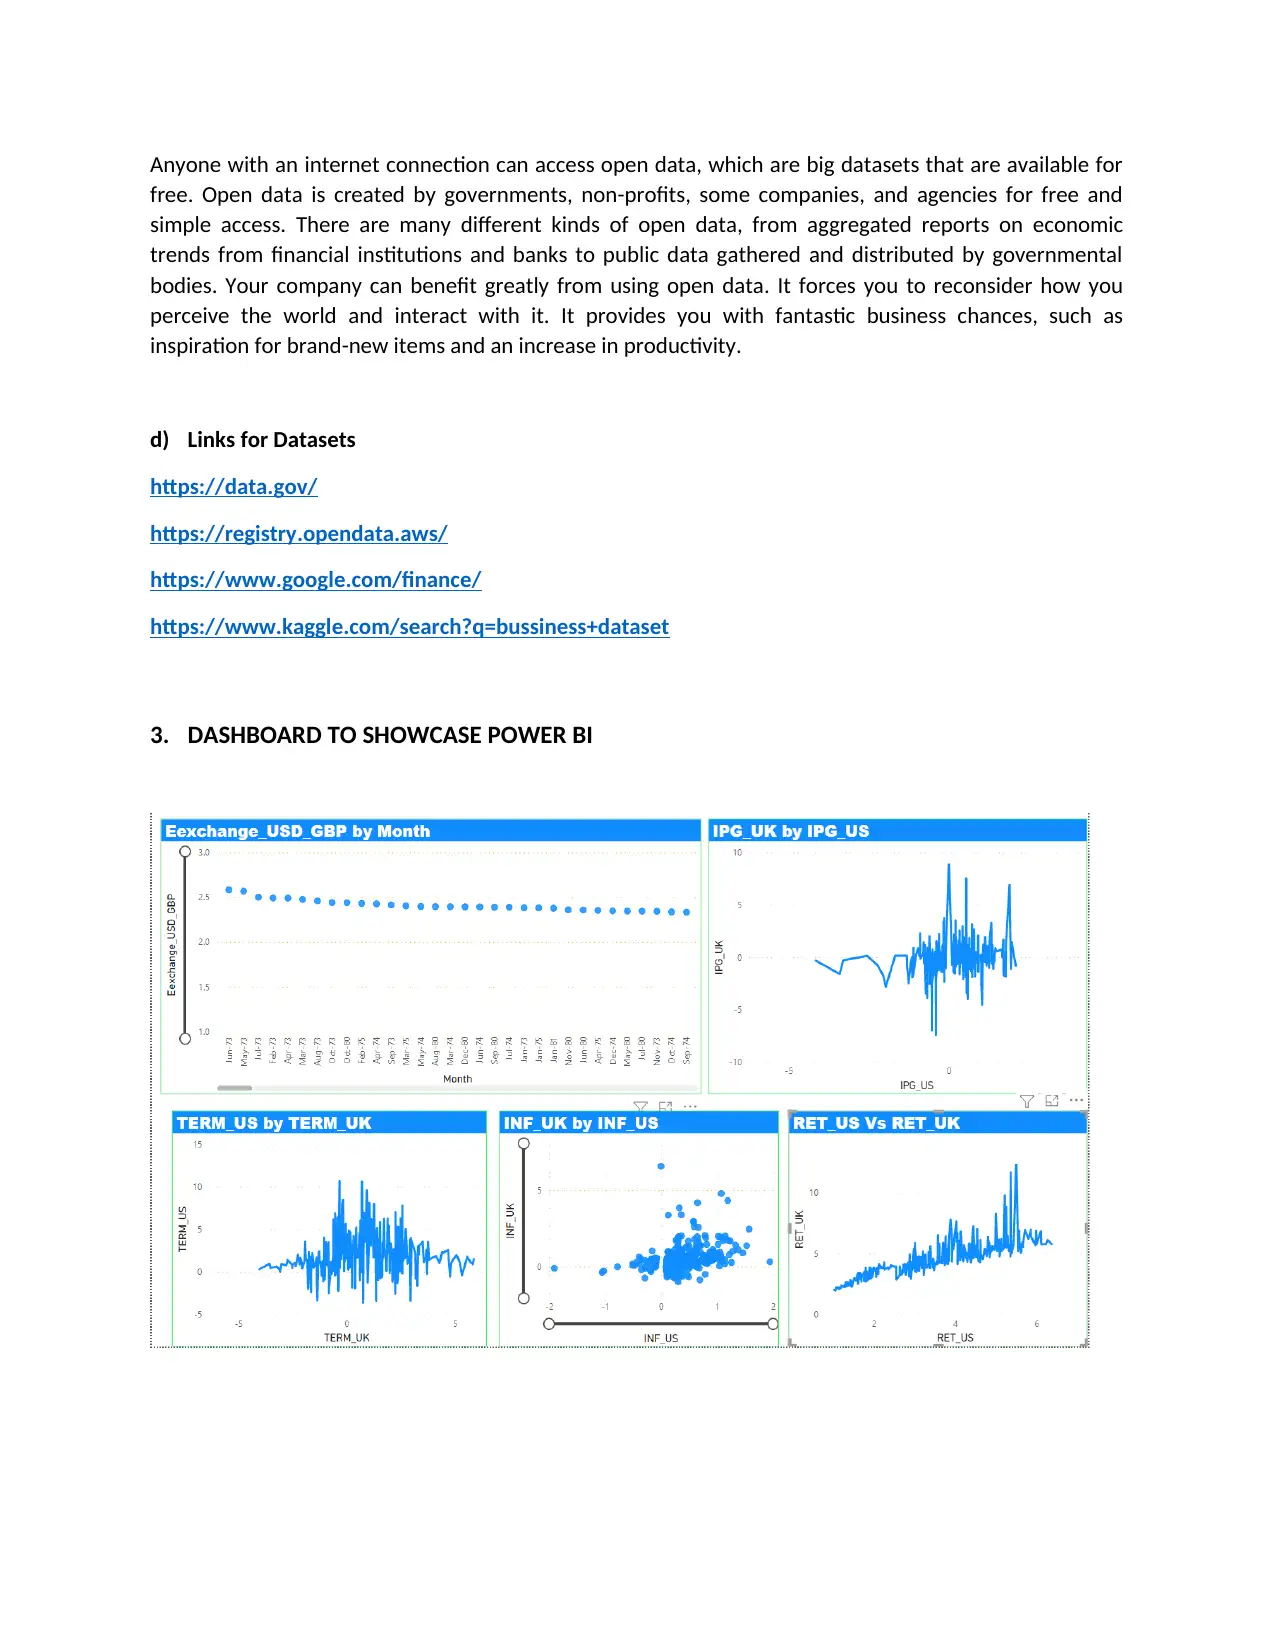
This report provides a comprehensive analysis of Power BI adoption for rapidly growing small businesses, contrasting it with Excel and highlighting the advantages of business intelligence platforms. The report begins with an introduction to business intelligence and Power BI, explaining its capabilities and user-friendly interface. It then differentiates between Power BI and Excel, detailing their respective strengths in data processing and analysis. The report further explores various data sources relevant to business management and finance, including ERP, CRM, online surveys, social media, and open data sources. A Power BI dashboard showcasing findings from datasets, such as the relationship between USD and GBP exchange rates and economic indicators, is also included. The report concludes by emphasizing Power BI's suitability for collaborative work, big data analysis, and data-driven decision-making, making it an ideal tool for businesses seeking to transform data into actionable insights. The report also includes the links for the datasets and the published dashboard for the user's reference.
1 out of 4
Related Documents


Your All-in-One AI-Powered Toolkit for Academic Success.
+13062052269
info@desklib.com
Available 24*7 on WhatsApp / Email
![[object Object]](/_next/static/media/star-bottom.7253800d.svg)
Copyright © 2020–2026 A2Z Services. All Rights Reserved. Developed and managed by ZUCOL.