Financial Ratio Analysis and Asset Valuation: Harvey Norman Report
VerifiedAdded on 2023/01/17
|9
|1986
|50
Report
AI Summary
This report provides a comprehensive financial analysis of Harvey Norman Holdings Limited. It begins with an overview of the company and the industry in which it operates, detailing its business model and market position within the computer, electronics, furniture, and bedding goods sector. The core of the report focuses on evaluating Harvey Norman's financial performance through ratio analysis, calculating and interpreting key ratios such as the current ratio, debt ratio, and interest earned ratio over a five-year period (2015-2019) to assess its liquidity, solvency, and profitability. The analysis includes graphical representations of the ratios to illustrate trends and identify areas of strength and weakness. Furthermore, the report includes a valuation of Harvey Norman's assets, examining the methods used for revaluation of property, plant, and equipment, as well as the treatment of intangible assets. The report concludes with a summary of the findings and insights into the company's financial health and performance.

REPORT
Paraphrase This Document
Need a fresh take? Get an instant paraphrase of this document with our AI Paraphraser
Table of Contents
EXECUTIVE SUMMARY.............................................................................................................3
MAIN BODY...................................................................................................................................3
1. About the company and the industry in which this operates..................................................3
2. Evaluation of financial performance of above company on the basis of ratio analysis..........3
3. Valuation of above company's assets. ....................................................................................7
CONCLUSION................................................................................................................................8
REFERENCES................................................................................................................................9
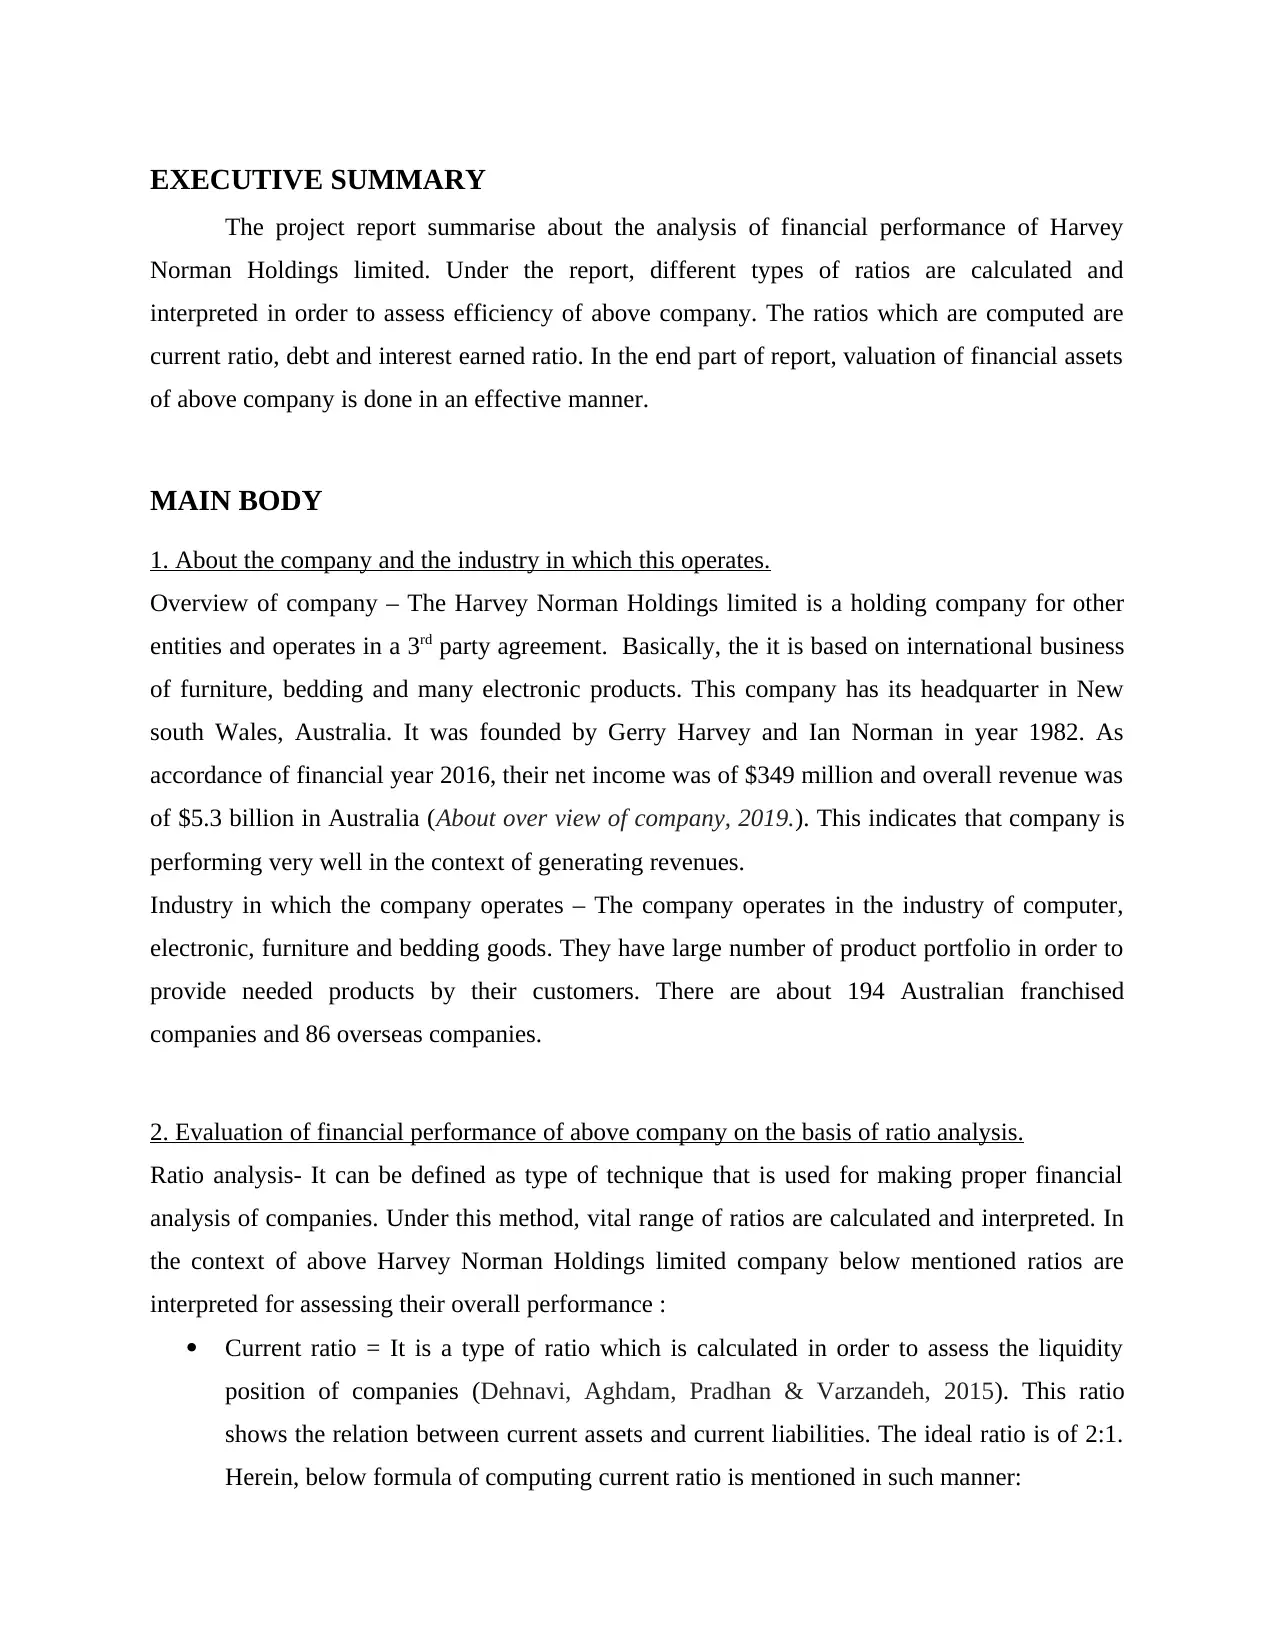
EXECUTIVE SUMMARY
The project report summarise about the analysis of financial performance of Harvey
Norman Holdings limited. Under the report, different types of ratios are calculated and
interpreted in order to assess efficiency of above company. The ratios which are computed are
current ratio, debt and interest earned ratio. In the end part of report, valuation of financial assets
of above company is done in an effective manner.
MAIN BODY
1. About the company and the industry in which this operates.
Overview of company – The Harvey Norman Holdings limited is a holding company for other
entities and operates in a 3rd party agreement. Basically, the it is based on international business
of furniture, bedding and many electronic products. This company has its headquarter in New
south Wales, Australia. It was founded by Gerry Harvey and Ian Norman in year 1982. As
accordance of financial year 2016, their net income was of $349 million and overall revenue was
of $5.3 billion in Australia (About over view of company, 2019.). This indicates that company is
performing very well in the context of generating revenues.
Industry in which the company operates – The company operates in the industry of computer,
electronic, furniture and bedding goods. They have large number of product portfolio in order to
provide needed products by their customers. There are about 194 Australian franchised
companies and 86 overseas companies.
2. Evaluation of financial performance of above company on the basis of ratio analysis.
Ratio analysis- It can be defined as type of technique that is used for making proper financial
analysis of companies. Under this method, vital range of ratios are calculated and interpreted. In
the context of above Harvey Norman Holdings limited company below mentioned ratios are
interpreted for assessing their overall performance :
Current ratio = It is a type of ratio which is calculated in order to assess the liquidity
position of companies (Dehnavi, Aghdam, Pradhan & Varzandeh, 2015). This ratio
shows the relation between current assets and current liabilities. The ideal ratio is of 2:1.
Herein, below formula of computing current ratio is mentioned in such manner:
⊘ This is a preview!⊘
Do you want full access?
Subscribe today to unlock all pages.
Trusted by 1+ million students worldwide
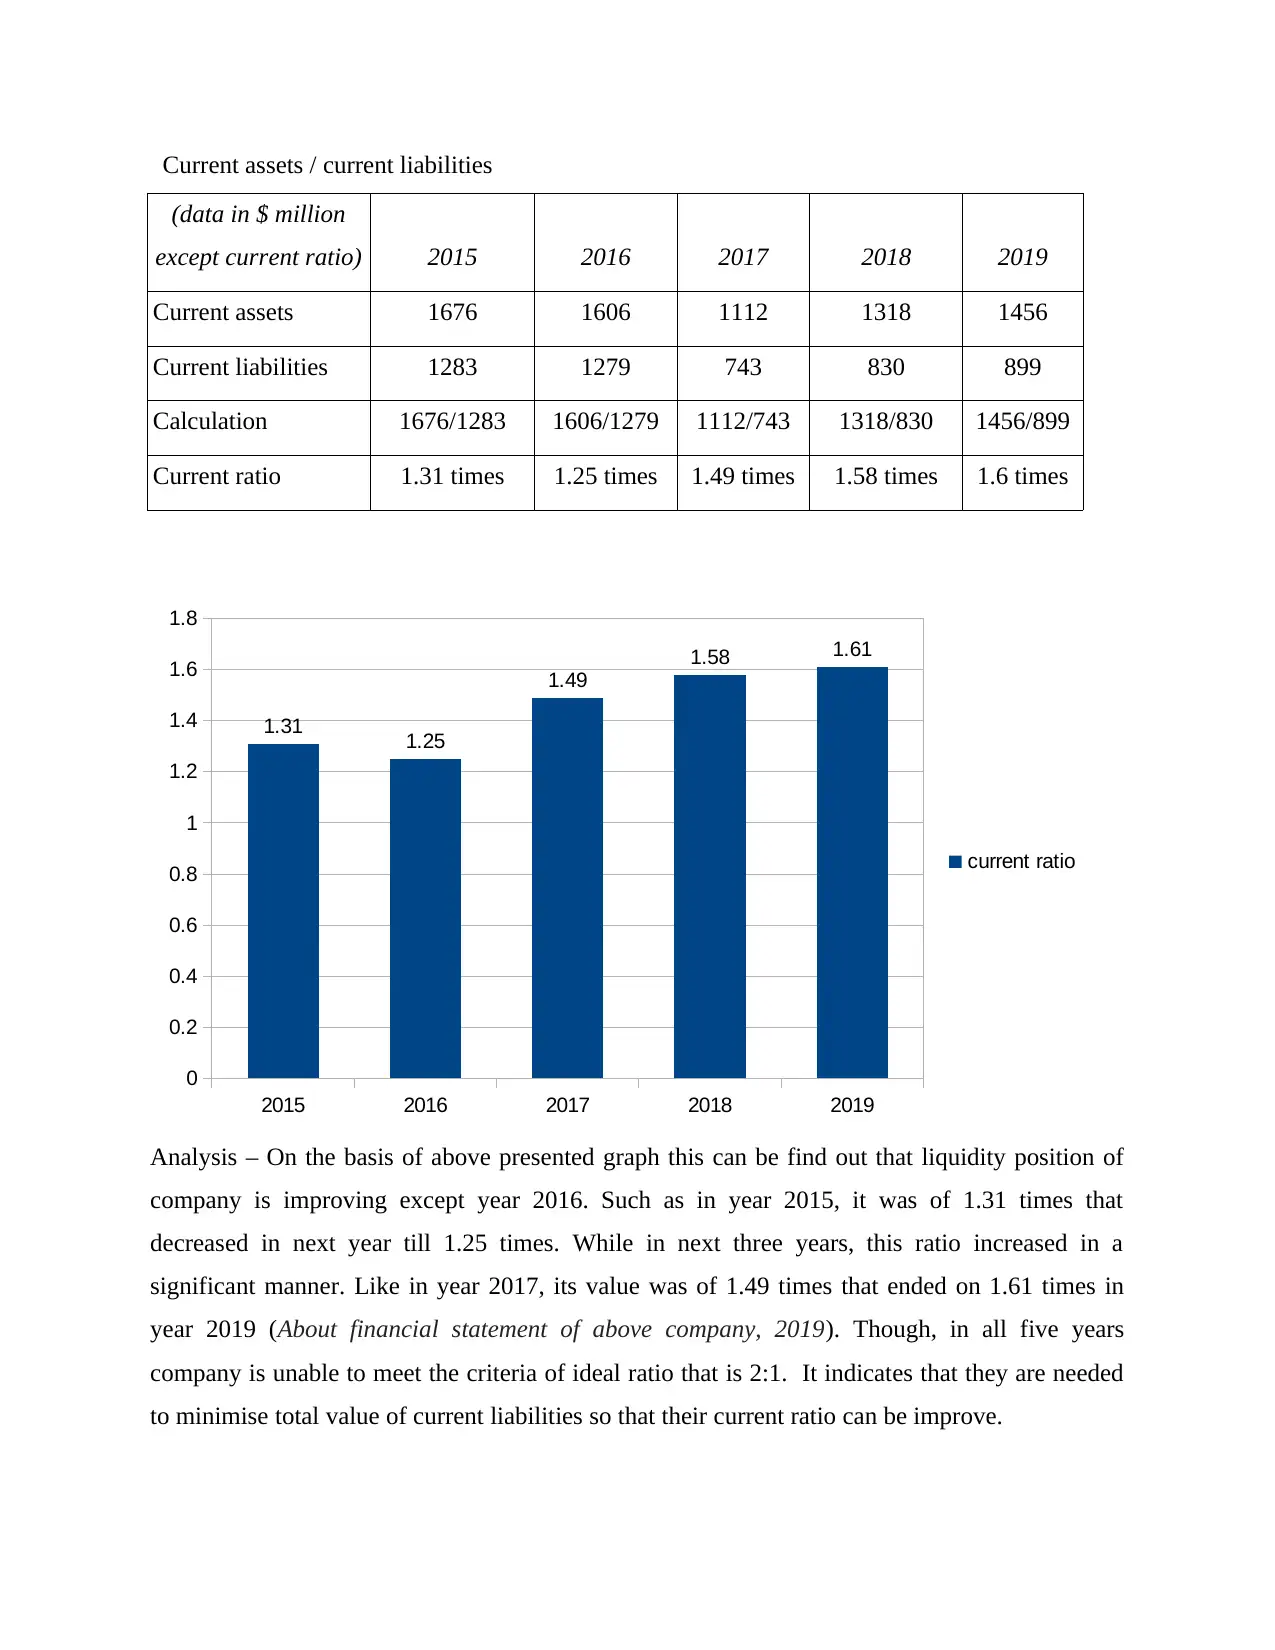
Current assets / current liabilities
(data in $ million
except current ratio) 2015 2016 2017 2018 2019
Current assets 1676 1606 1112 1318 1456
Current liabilities 1283 1279 743 830 899
Calculation 1676/1283 1606/1279 1112/743 1318/830 1456/899
Current ratio 1.31 times 1.25 times 1.49 times 1.58 times 1.6 times
2015 2016 2017 2018 2019
0
0.2
0.4
0.6
0.8
1
1.2
1.4
1.6
1.8
1.31 1.25
1.49
1.58 1.61
current ratio
Analysis – On the basis of above presented graph this can be find out that liquidity position of
company is improving except year 2016. Such as in year 2015, it was of 1.31 times that
decreased in next year till 1.25 times. While in next three years, this ratio increased in a
significant manner. Like in year 2017, its value was of 1.49 times that ended on 1.61 times in
year 2019 (About financial statement of above company, 2019). Though, in all five years
company is unable to meet the criteria of ideal ratio that is 2:1. It indicates that they are needed
to minimise total value of current liabilities so that their current ratio can be improve.
Paraphrase This Document
Need a fresh take? Get an instant paraphrase of this document with our AI Paraphraser
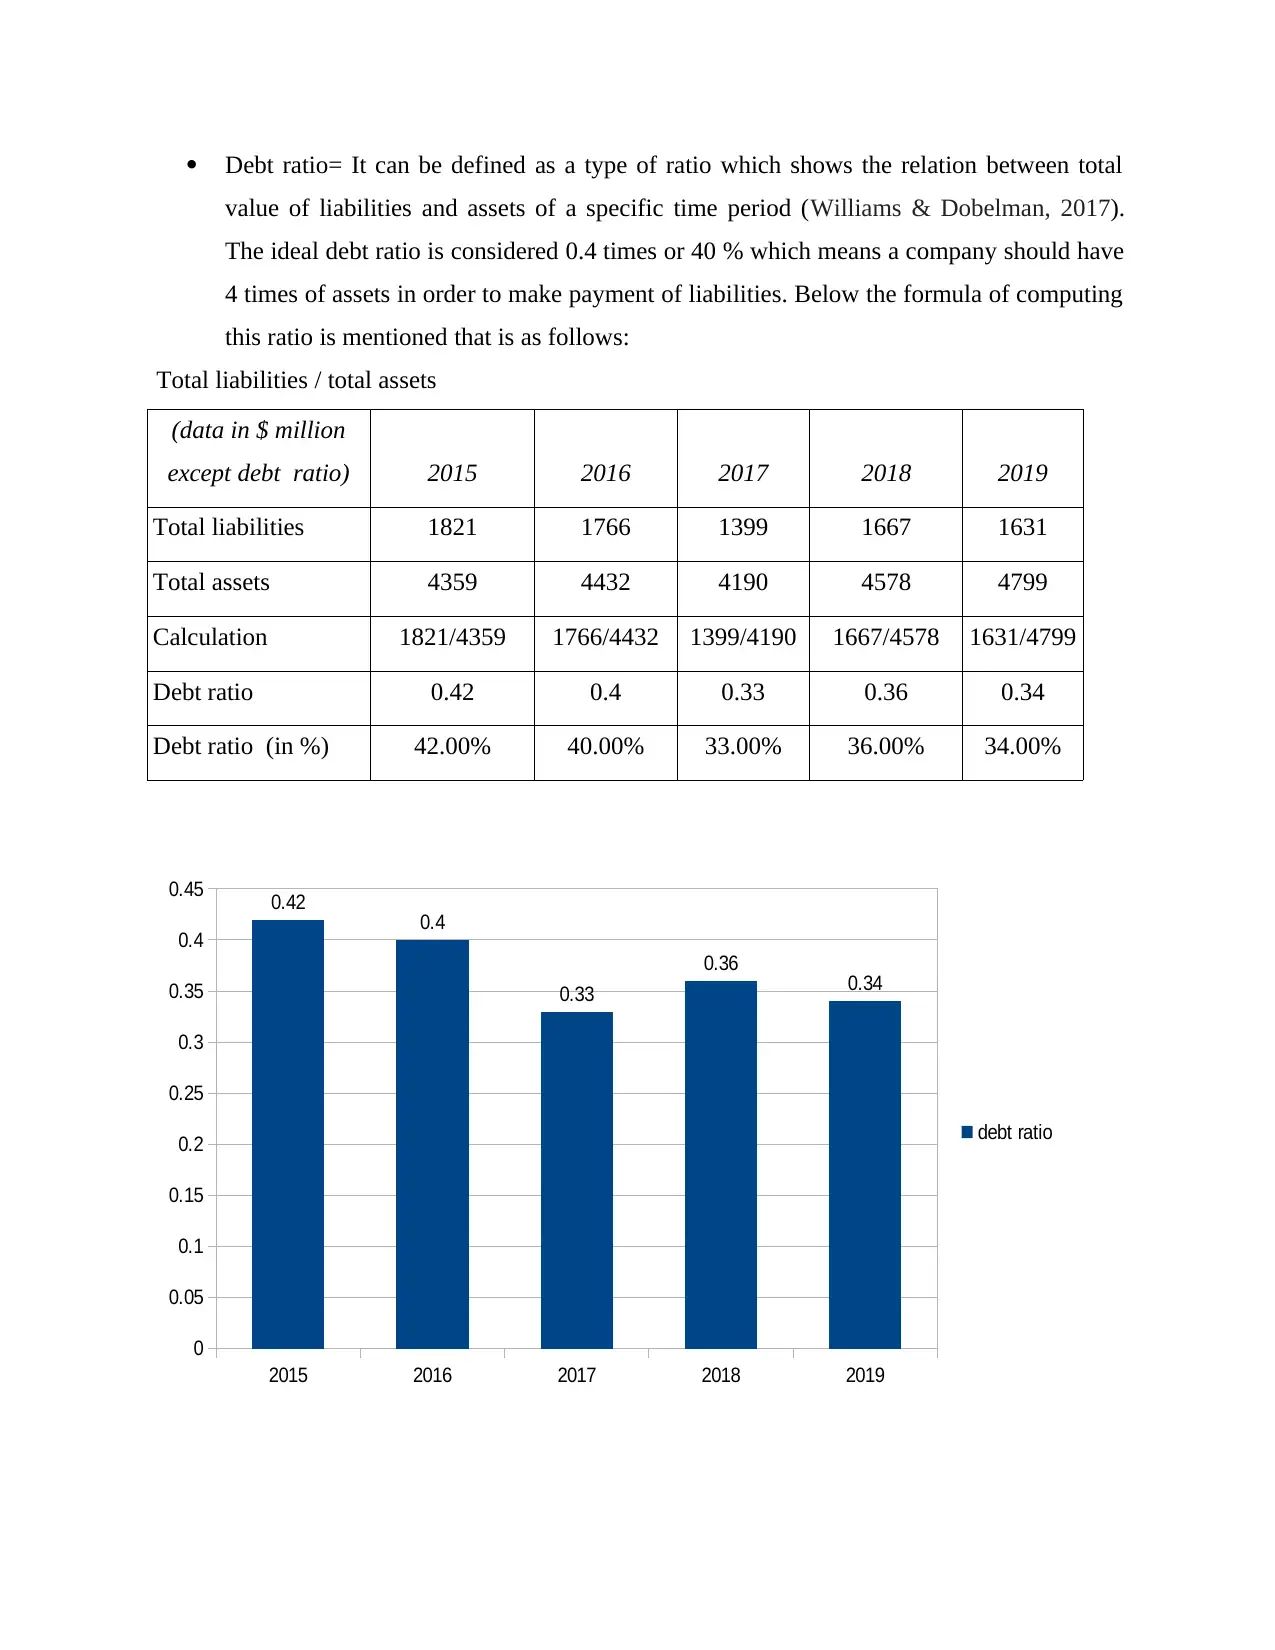
Debt ratio= It can be defined as a type of ratio which shows the relation between total
value of liabilities and assets of a specific time period (Williams & Dobelman, 2017).
The ideal debt ratio is considered 0.4 times or 40 % which means a company should have
4 times of assets in order to make payment of liabilities. Below the formula of computing
this ratio is mentioned that is as follows:
Total liabilities / total assets
(data in $ million
except debt ratio) 2015 2016 2017 2018 2019
Total liabilities 1821 1766 1399 1667 1631
Total assets 4359 4432 4190 4578 4799
Calculation 1821/4359 1766/4432 1399/4190 1667/4578 1631/4799
Debt ratio 0.42 0.4 0.33 0.36 0.34
Debt ratio (in %) 42.00% 40.00% 33.00% 36.00% 34.00%
2015 2016 2017 2018 2019
0
0.05
0.1
0.15
0.2
0.25
0.3
0.35
0.4
0.45 0.42 0.4
0.33
0.36 0.34
debt ratio
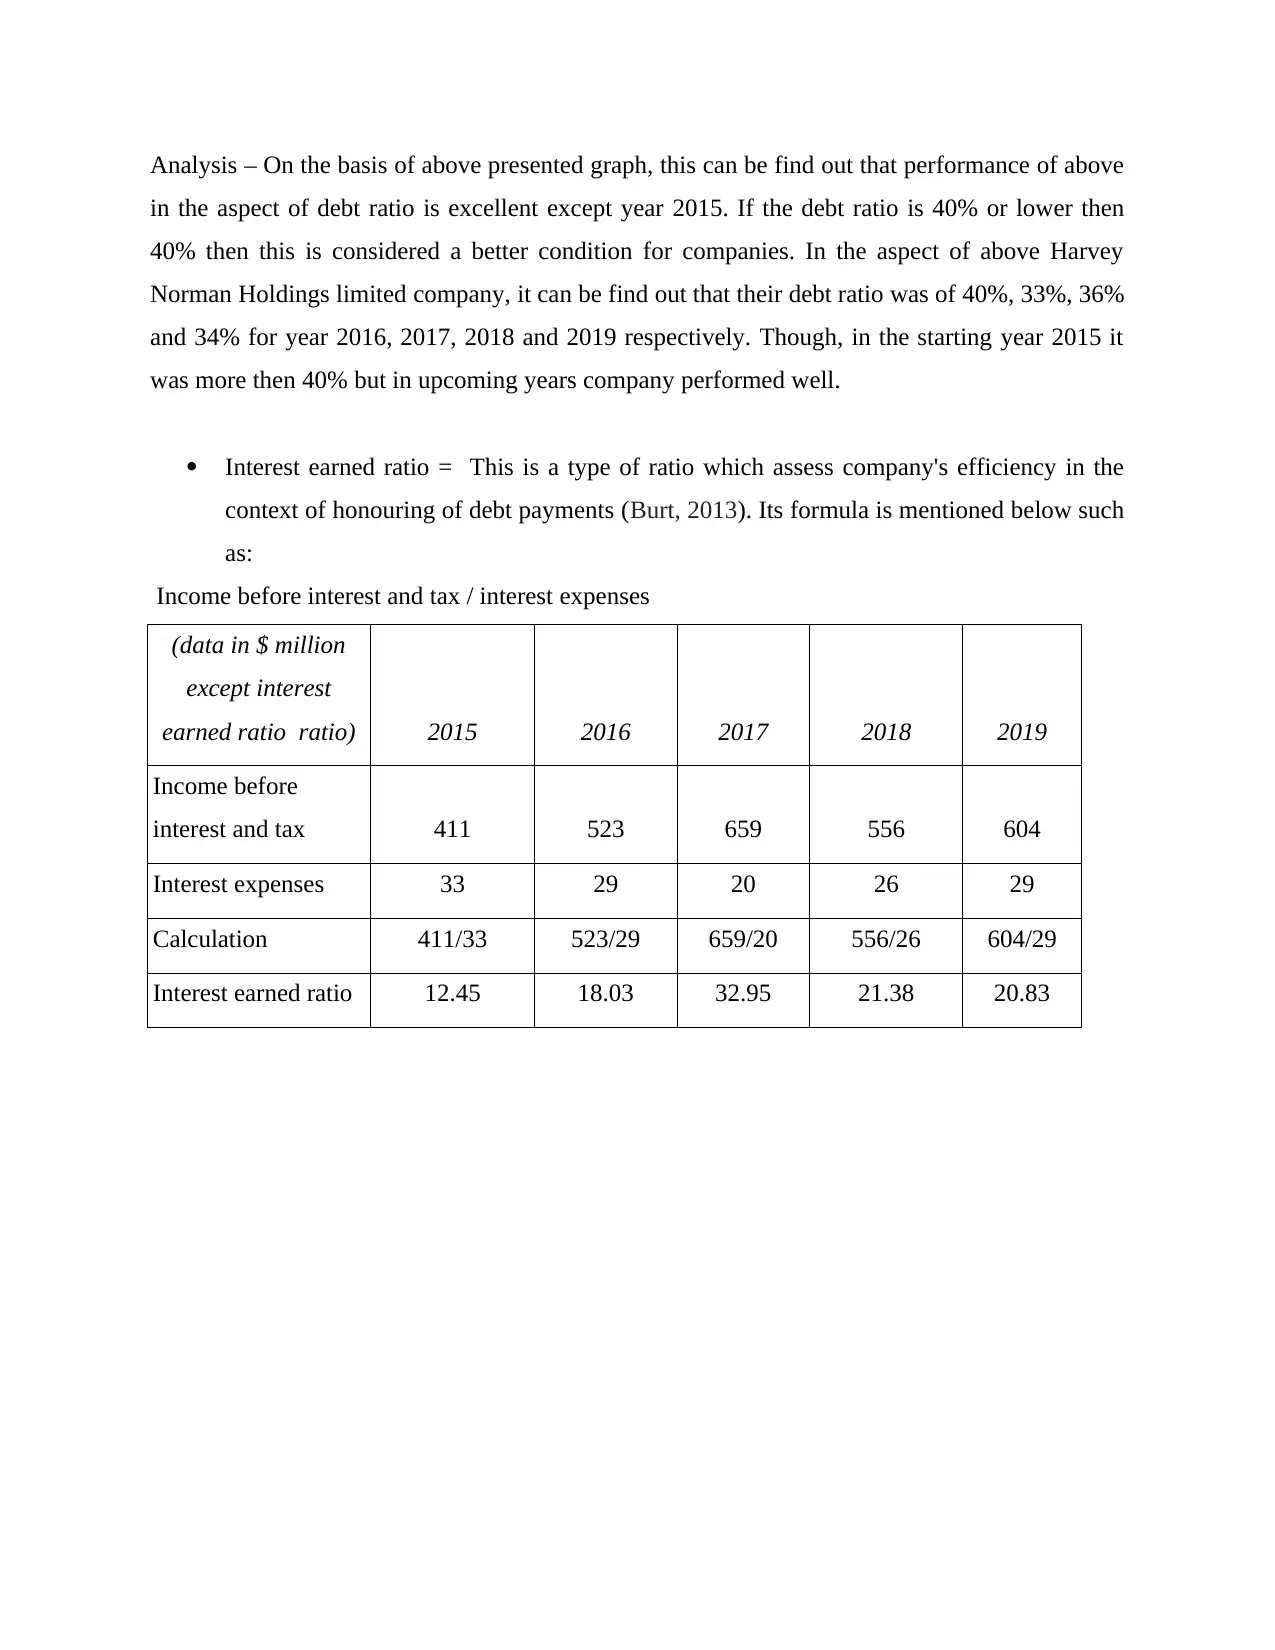
Analysis – On the basis of above presented graph, this can be find out that performance of above
in the aspect of debt ratio is excellent except year 2015. If the debt ratio is 40% or lower then
40% then this is considered a better condition for companies. In the aspect of above Harvey
Norman Holdings limited company, it can be find out that their debt ratio was of 40%, 33%, 36%
and 34% for year 2016, 2017, 2018 and 2019 respectively. Though, in the starting year 2015 it
was more then 40% but in upcoming years company performed well.
Interest earned ratio = This is a type of ratio which assess company's efficiency in the
context of honouring of debt payments (Burt, 2013). Its formula is mentioned below such
as:
Income before interest and tax / interest expenses
(data in $ million
except interest
earned ratio ratio) 2015 2016 2017 2018 2019
Income before
interest and tax 411 523 659 556 604
Interest expenses 33 29 20 26 29
Calculation 411/33 523/29 659/20 556/26 604/29
Interest earned ratio 12.45 18.03 32.95 21.38 20.83
⊘ This is a preview!⊘
Do you want full access?
Subscribe today to unlock all pages.
Trusted by 1+ million students worldwide
2015 2016 2017 2018 2019
0
5
10
15
20
25
30
35
12.45
18.03
32.95
21.38 20.83
Interest earned ratio
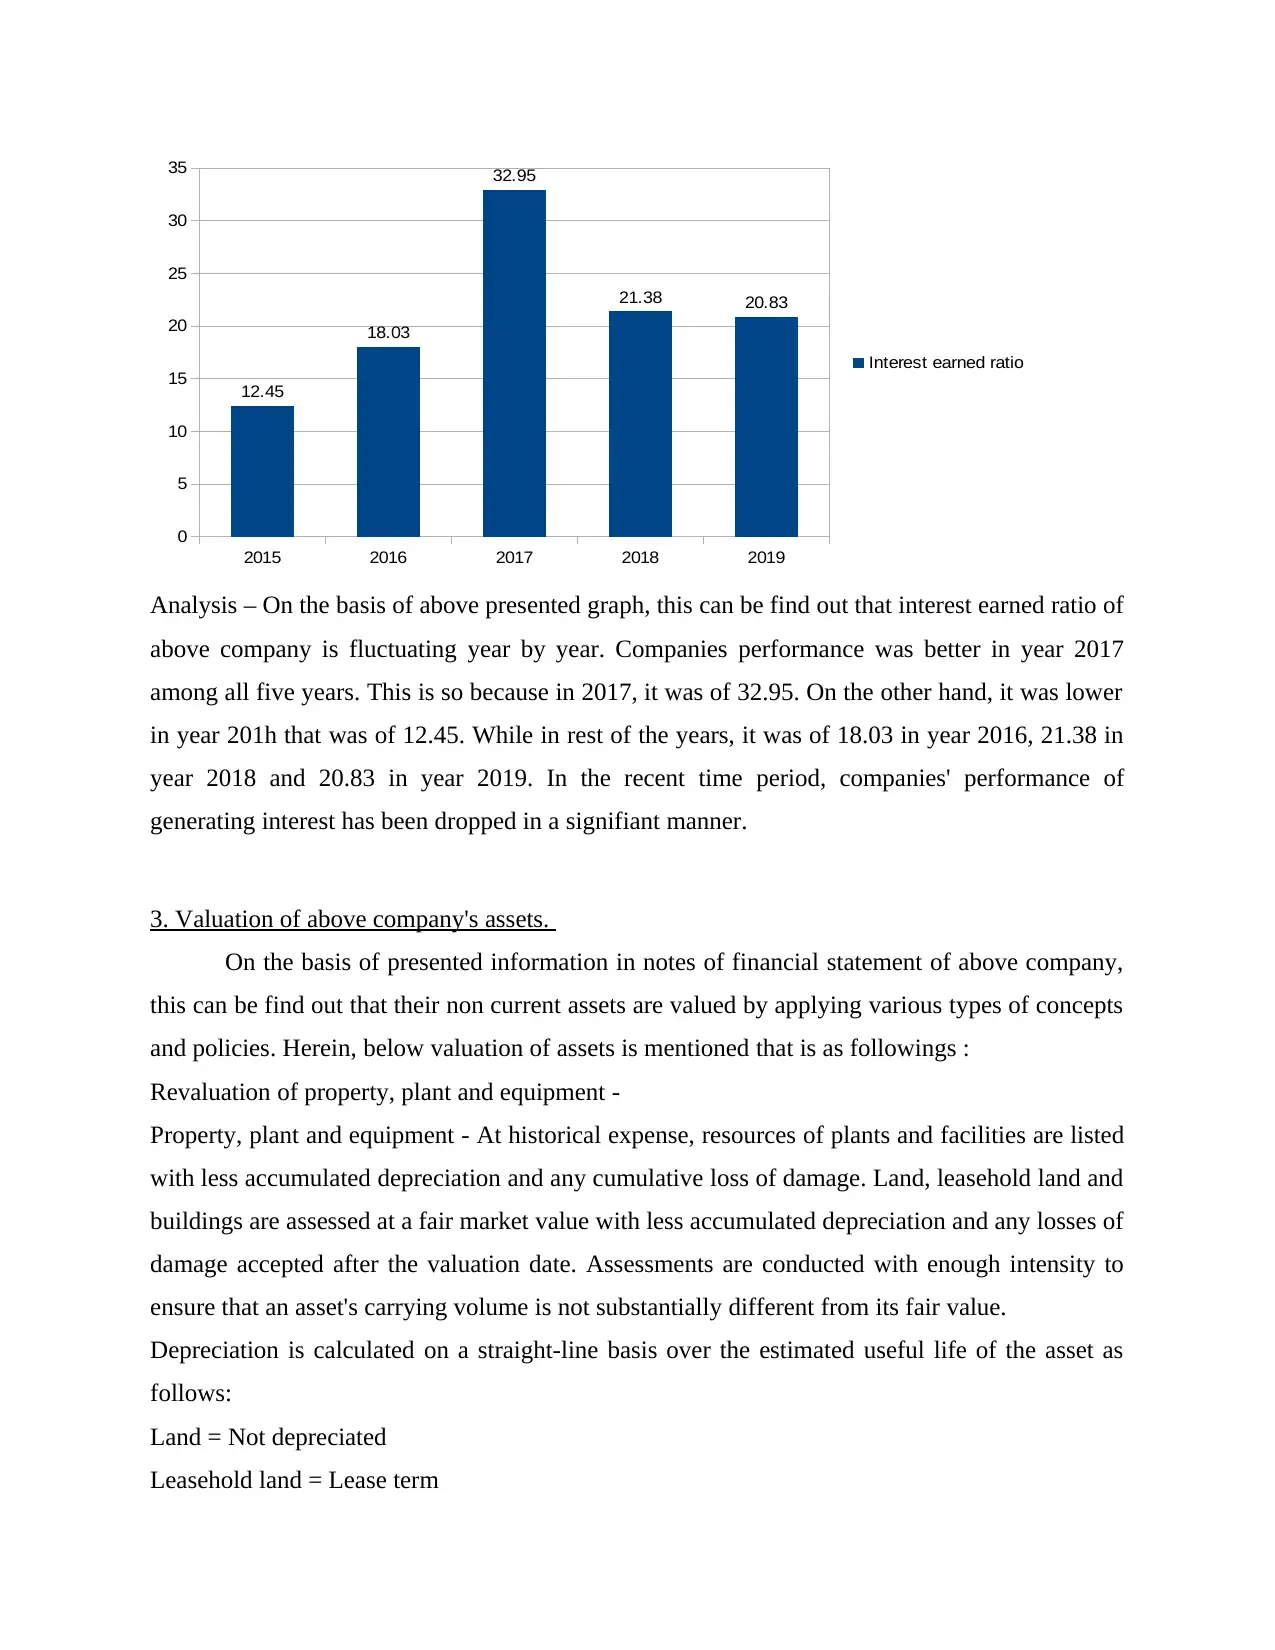
Analysis – On the basis of above presented graph, this can be find out that interest earned ratio of
above company is fluctuating year by year. Companies performance was better in year 2017
among all five years. This is so because in 2017, it was of 32.95. On the other hand, it was lower
in year 201h that was of 12.45. While in rest of the years, it was of 18.03 in year 2016, 21.38 in
year 2018 and 20.83 in year 2019. In the recent time period, companies' performance of
generating interest has been dropped in a signifiant manner.
3. Valuation of above company's assets.
On the basis of presented information in notes of financial statement of above company,
this can be find out that their non current assets are valued by applying various types of concepts
and policies. Herein, below valuation of assets is mentioned that is as followings :
Revaluation of property, plant and equipment -
Property, plant and equipment - At historical expense, resources of plants and facilities are listed
with less accumulated depreciation and any cumulative loss of damage. Land, leasehold land and
buildings are assessed at a fair market value with less accumulated depreciation and any losses of
damage accepted after the valuation date. Assessments are conducted with enough intensity to
ensure that an asset's carrying volume is not substantially different from its fair value.
Depreciation is calculated on a straight-line basis over the estimated useful life of the asset as
follows:
Land = Not depreciated
Leasehold land = Lease term
0
5
10
15
20
25
30
35
12.45
18.03
32.95
21.38 20.83
Interest earned ratio
Analysis – On the basis of above presented graph, this can be find out that interest earned ratio of
above company is fluctuating year by year. Companies performance was better in year 2017
among all five years. This is so because in 2017, it was of 32.95. On the other hand, it was lower
in year 201h that was of 12.45. While in rest of the years, it was of 18.03 in year 2016, 21.38 in
year 2018 and 20.83 in year 2019. In the recent time period, companies' performance of
generating interest has been dropped in a signifiant manner.
3. Valuation of above company's assets.
On the basis of presented information in notes of financial statement of above company,
this can be find out that their non current assets are valued by applying various types of concepts
and policies. Herein, below valuation of assets is mentioned that is as followings :
Revaluation of property, plant and equipment -
Property, plant and equipment - At historical expense, resources of plants and facilities are listed
with less accumulated depreciation and any cumulative loss of damage. Land, leasehold land and
buildings are assessed at a fair market value with less accumulated depreciation and any losses of
damage accepted after the valuation date. Assessments are conducted with enough intensity to
ensure that an asset's carrying volume is not substantially different from its fair value.
Depreciation is calculated on a straight-line basis over the estimated useful life of the asset as
follows:
Land = Not depreciated
Leasehold land = Lease term
Paraphrase This Document
Need a fresh take? Get an instant paraphrase of this document with our AI Paraphraser
Buildings under construction = No depreciation is computed
Buildings = 20 years to 40 years
Owned plant and equipments = 3 years to 20 years
Plant and equipment under finance lease = 1 year to 5 years
The residual values of the assets, helpful lives and practices of amortization are evaluated and
adapted at the end of each fiscal year, if necessary.
Intangible assets - Intangible assets are evaluated for deficiency where there is a cognitive
function measure, either separately or at the level of the unit producing cash (Vaze, 2013).
Useful lives are also checked periodically and changes are made on a prospect basis, where
appropriate. Gains or losses resulting from the de-cognition of an intangible asset are calculated
as the difference between the net sale revenues and the carrying value of the intangible asset and
are recorded in the statement of profits when the intangible asset is recognised.
Construction investment on an individual project is regarded as an intangible asset. When the
combined company will demonstrate:
The practical viability of finishing the intangible asset so that it can be used or sold.
Their intention to achieve and their ability to use or sell the asset
The asset is held at value less any accumulated amortization and cumulative depreciation losses
following initial identification of the construction expenditure as an investment (April Márquez‐
Grant & Richards,2012). Once production is complete, the amortization of the resource begins
and the asset is ready for use. During the expected future gain period, it is amortized. The asset
will be checked periodically for damage during the development period.
CONCLUSION
On the basis of above project report, it has been concluded financial analysis is essential
for companies in order to become aware about actual position. The report concludes about
overview of Harvey Norman Holdings limited company and its monetary performance. In the
terms of analysed different ratios, it can be concluded that their overall performance is better. As
well as further part of report concludes regards to valuation of non current assets of chosen
company.
REFERENCES
Books and journals:
Dehnavi, A., Aghdam, I. N., Pradhan, B., & Varzandeh, M. H. M. (2015). A new hybrid model
using step-wise weight assessment ratio analysis (SWARA) technique and adaptive
neuro-fuzzy inference system (ANFIS) for regional landslide hazard assessment in
Iran. Catena. 135. 122-148.
Williams, E. E., & Dobelman, J. A. (2017). Financial statement analysis. World Scientific Book
Chapters. 109-169.
Burt, N. M. (2013). Stable isotope ratio analysis of breastfeeding and weaning practices of
children from medieval Fishergate House York, UK. American Journal of Physical
Anthropology. 152(3). 407-416.
Vaze, R. (2013, April). Competitive ratio analysis of online algorithms to minimize packet
transmission time in energy harvesting communication system. In 2013 Proceedings
IEEE INFOCOM. (pp. 115-1123). IEEE.
Nehlich, O., Fuller, B. T., Márquez‐Grant, N., & Richards, M. P. (2012). Investigation of
diachronic dietary patterns on the islands of Ibiza and Formentera, Spain: evidence from
sulfur stable isotope ratio analysis. American Journal of Physical Anthropology. 149(1).
115-124.
Online:
About financial statement of above company, 2019. [online] available
through:<http://financials.morningstar.com/balance-sheet/bs.html?
t=HVN®ion=aus&culture=en-US>
About over view of company, 2019. [online] available
through:<http://www.harveynormanholdings.com.au/company>
⊘ This is a preview!⊘
Do you want full access?
Subscribe today to unlock all pages.
Trusted by 1+ million students worldwide
1 out of 9
Your All-in-One AI-Powered Toolkit for Academic Success.
+13062052269
info@desklib.com
Available 24*7 on WhatsApp / Email
![[object Object]](/_next/static/media/star-bottom.7253800d.svg)
Unlock your academic potential
Copyright © 2020–2026 A2Z Services. All Rights Reserved. Developed and managed by ZUCOL.