Ask a question from expert
Research in East London: SPSS
24 Pages2294 Words277 Views
Added on 2020-01-07
Research in East London: SPSS
Added on 2020-01-07
BookmarkShareRelated Documents
Research in East London

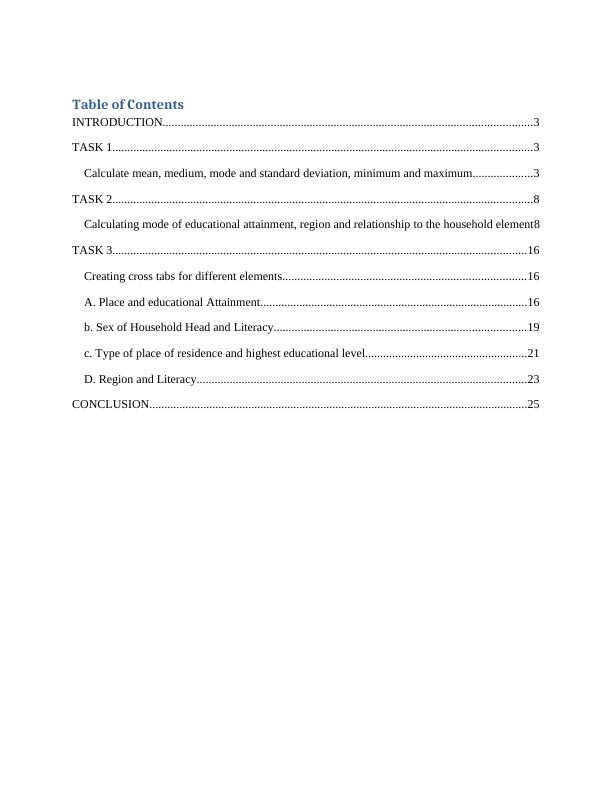
Table of ContentsINTRODUCTION...........................................................................................................................3TASK 1............................................................................................................................................3Calculate mean, medium, mode and standard deviation, minimum and maximum....................3TASK 2............................................................................................................................................8Calculating mode of educational attainment, region and relationship to the household element8TASK 3..........................................................................................................................................16Creating cross tabs for different elements.................................................................................16A. Place and educational Attainment.........................................................................................16b. Sex of Household Head and Literacy....................................................................................19c. Type of place of residence and highest educational level......................................................21D. Region and Literacy..............................................................................................................23CONCLUSION..............................................................................................................................25
INTRODUCTION SPSS may be defined as a tool which in turn helps in doing quantitative analysis in aneffectual way. It is highly significant which in turn helps in deriving suitable outcome fromissue. In this, report will provide deeper insight about the manner in which descriptive statisticsand chi-square tool assists in resolving the issues as well as testing hypothesis. TASK 1Calculate mean, medium, mode and standard deviation, minimum and maximumNValid11742Missing0Mean9.63Median8.00Mode6Std. Deviation5.252Minimum1Maximum48
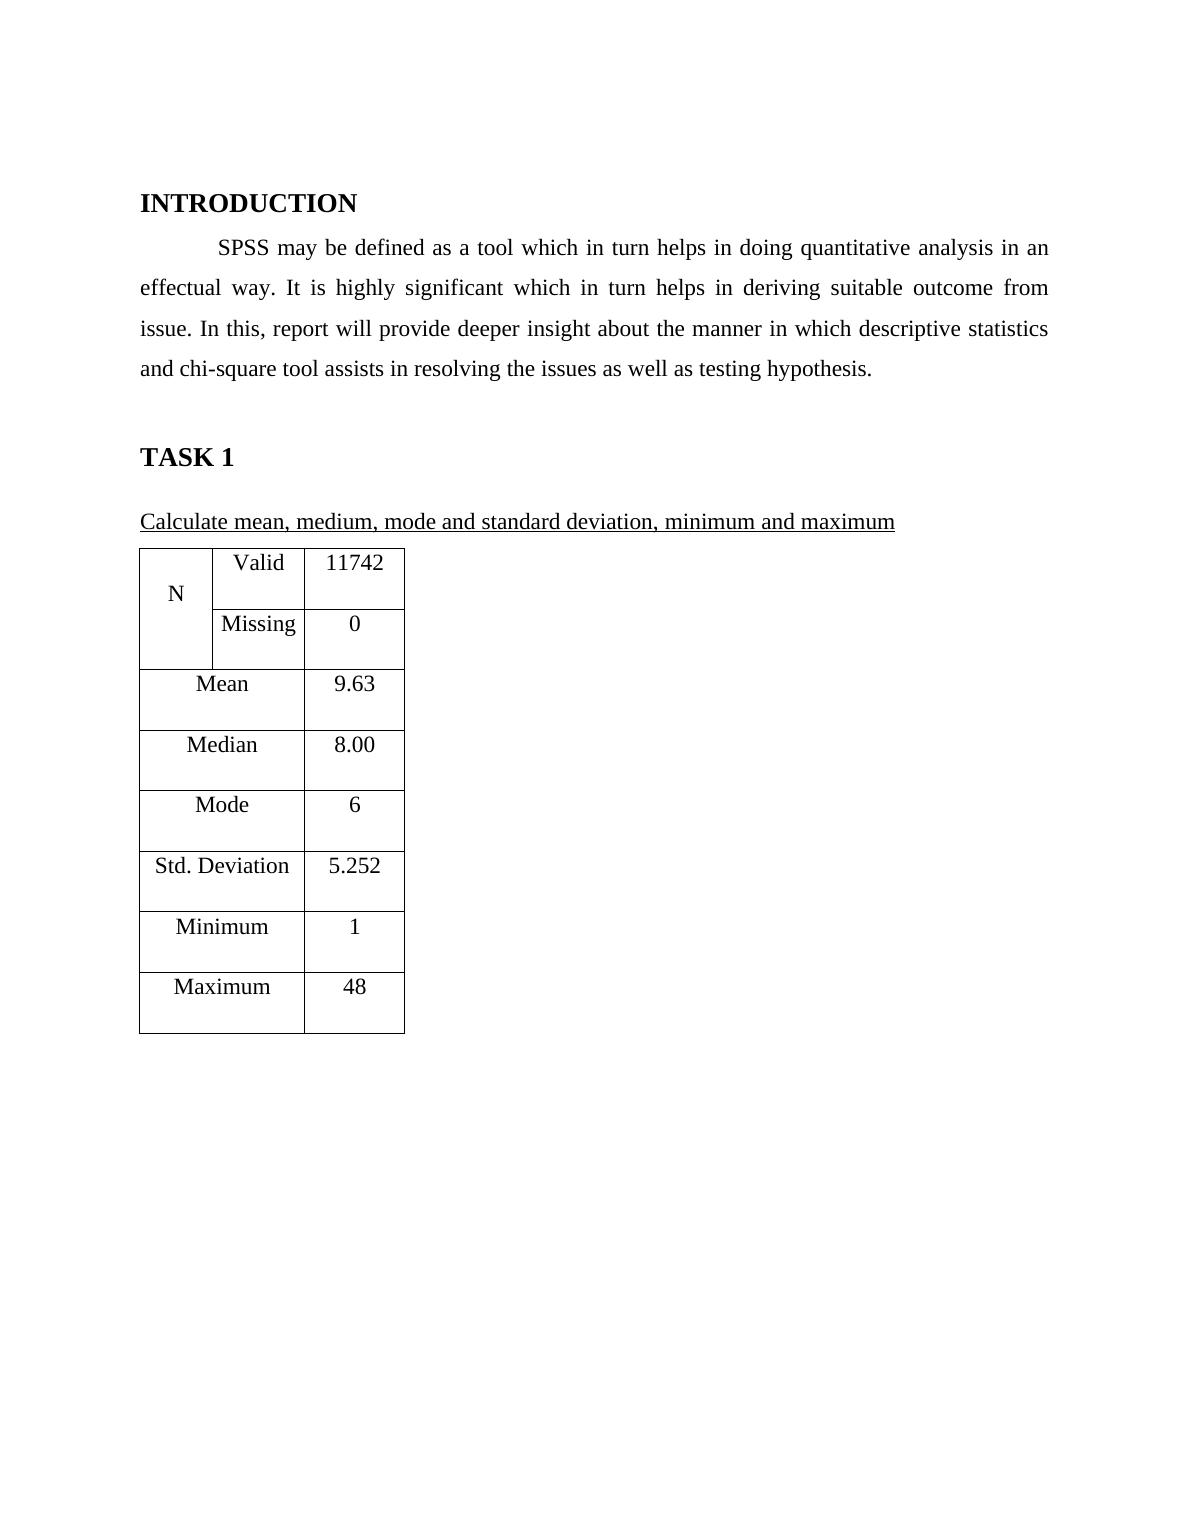
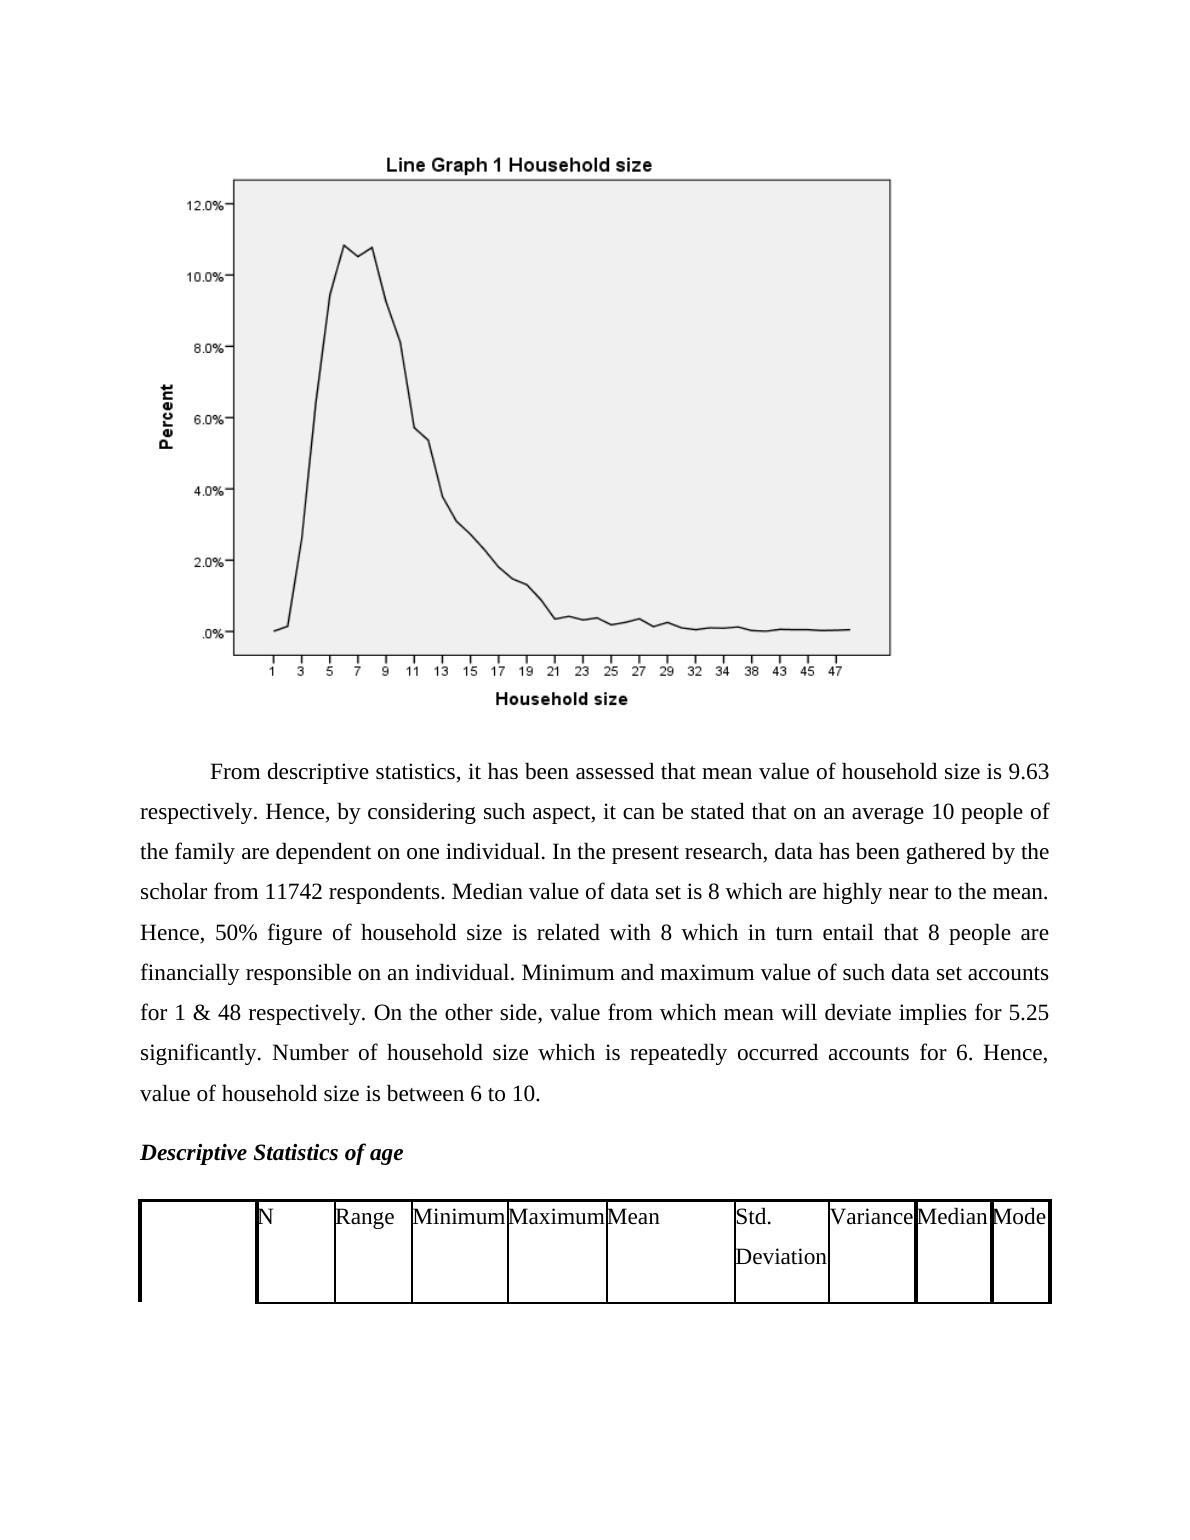
From descriptive statistics, it has been assessed that mean value of household size is 9.63respectively. Hence, by considering such aspect, it can be stated that on an average 10 people ofthe family are dependent on one individual. In the present research, data has been gathered by thescholar from 11742 respondents. Median value of data set is 8 which are highly near to the mean.Hence, 50% figure of household size is related with 8 which in turn entail that 8 people arefinancially responsible on an individual. Minimum and maximum value of such data set accountsfor 1 & 48 respectively. On the other side, value from which mean will deviate implies for 5.25significantly. Number of household size which is repeatedly occurred accounts for 6. Hence,value of household size is between 6 to 10. Descriptive Statistics of age NRangeMinimumMaximumMeanStd.DeviationVarianceMedianModeStatisticStatisticStatisticStatisticStatisticStd.ErrorStatisticStatistic
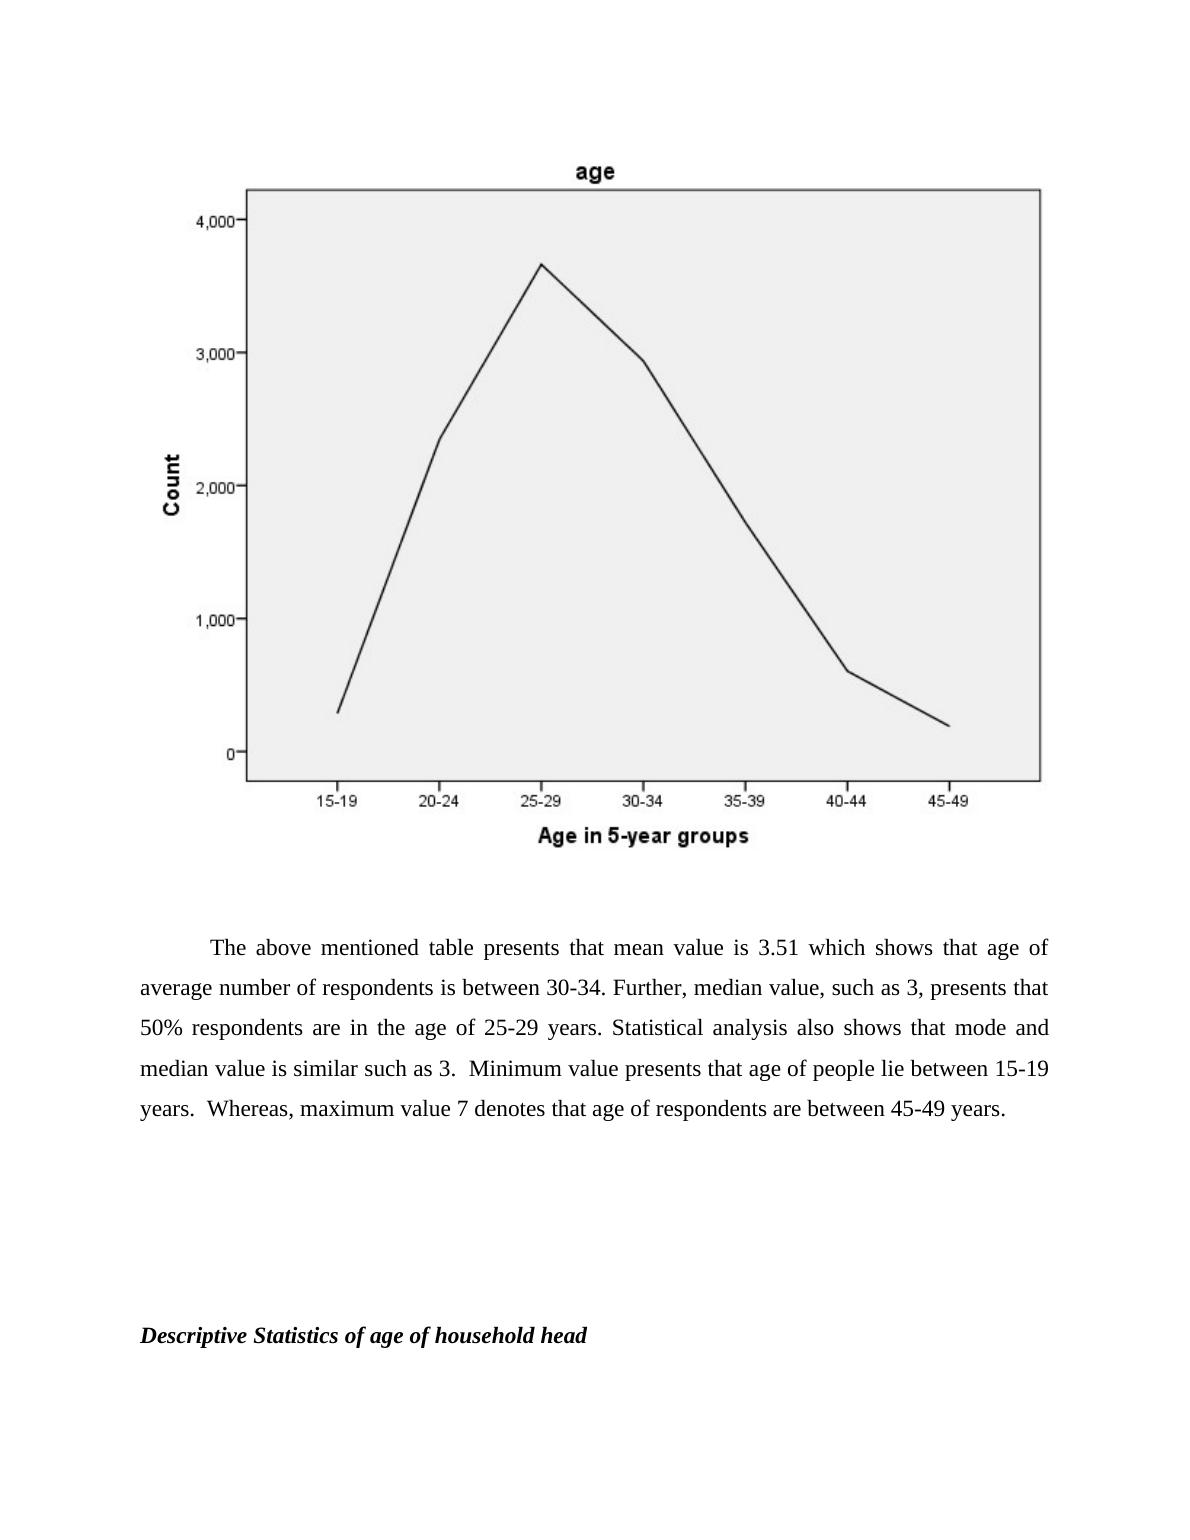
Age in 5-year groups117426173.51.0121.2611.59033Valid N(listwise)11742Graph
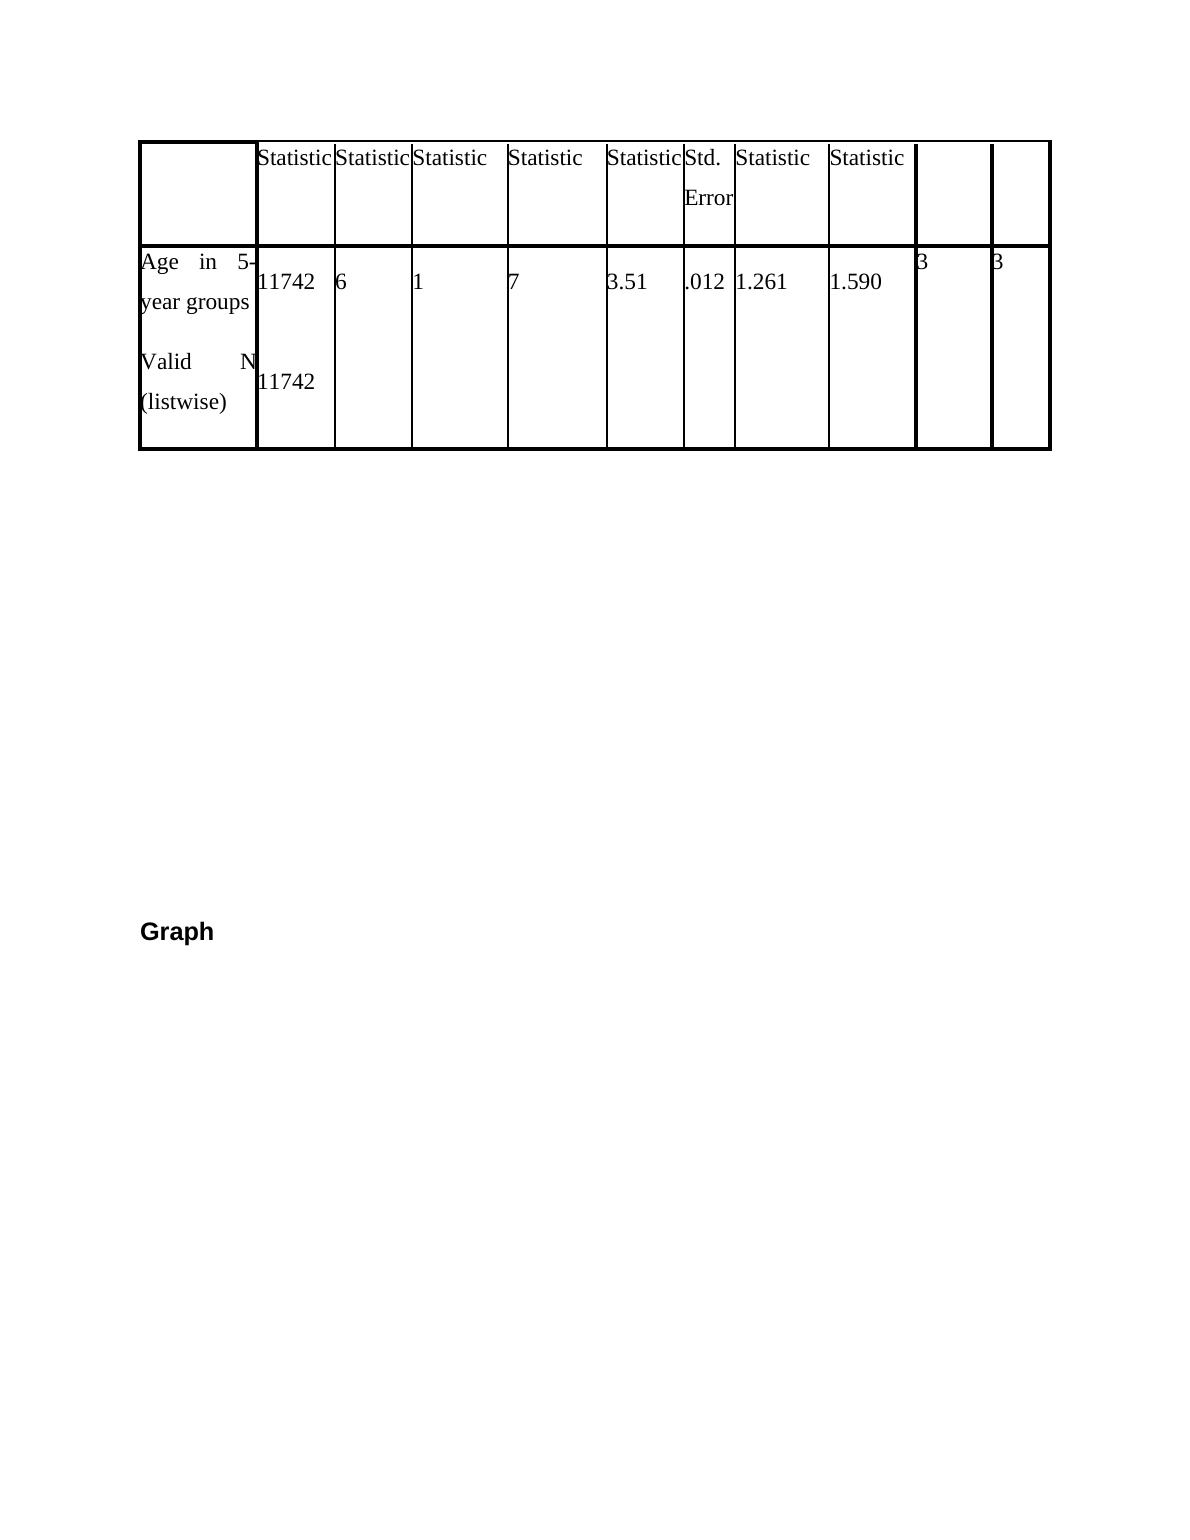
The above mentioned table presents that mean value is 3.51 which shows that age ofaverage number of respondents is between 30-34. Further, median value, such as 3, presents that50% respondents are in the age of 25-29 years. Statistical analysis also shows that mode andmedian value is similar such as 3. Minimum value presents that age of people lie between 15-19years. Whereas, maximum value 7 denotes that age of respondents are between 45-49 years. Descriptive Statistics of age of household head
End of preview
Want to access all the pages? Upload your documents or become a member.
Related Documents
Statistics (Correlation)lg...
|4
|666
|80
Exploratory Data Analysis and Factorial ANOVAlg...
|11
|1959
|216
Descriptive Statistics - Assignment 2lg...
|7
|893
|342
Bio statistics manuscript | Descriptive statisticslg...
|60
|6295
|275
Psychology Assignment | Quality of Lifelg...
|16
|2771
|72
Statistical Analysis of BMI and Physical Activity of Children and Teenagerslg...
|16
|2344
|388