Research Methodology Assignment | Statistics Assignment
14 Pages2411 Words67 Views
Added on 2020-06-06
Research Methodology Assignment | Statistics Assignment
Added on 2020-06-06
ShareRelated Documents
Research Methods

Table of ContentsINRODUCTION..............................................................................................................................1Question 1: Assessing the extent to which new immigrants are more likely to be poor.............1Question 2: Assessing gender inequality in terms of income......................................................4CONCLUSION..............................................................................................................................11REFERENCES..............................................................................................................................12

INRODUCTIONResearch methods, tools and techniques are highly significant which in turn helps scholarin presenting the fair solution of issue. In the field of research, techniques are highly varied inline with the type selected such as qualitative and quantitative. Thus, scholar is required to keepin mind research types when making selection of data collection and analysis tool. The presentreport is based on the case scenarios which will provide deeper insight about the level to whichnew immigrants are poor. Besides this, it will shed light on level of gender inequality on thebasis of income. Thus, report will develop understanding about the manner in which regression,correlation, descriptive statistics and chi-square test helps in decision making. Question 1: Assessing the extent to which new immigrants are more likely to be poor Descriptive statistics of household data Particulars HHRefUHSIZEDJHHINCNEWIMMGTENUREMean225161244.23.065161.60.62.5Standard Error1634703.10.04072.40.00.0Median224149901321622.513Mode#N/A299999913StandardDeviation73106143.021.977311821250.484631.24456SampleVariance5.34E+153.909753.3E+100.234871.54893Kurtosis-0.8349.221.7-1.7-0.9Skewness0.18579092712.70734.79586-0.51020.26961Range3065426005999999914Minimum1000307011001Maximum4065733016099999915Sum4.50E+1159471.3E+0812475086Count20002000200020002000Interpretation: The above depicted table shows that average household income is£65161.6 respectively. On the other side, income of 50% respondents is £21622.5 significantly.Further, mode presents that income that is generated by people repeatedly accounts for £999999.Thus, it can be depicted that monthly income from main employment generated by household is
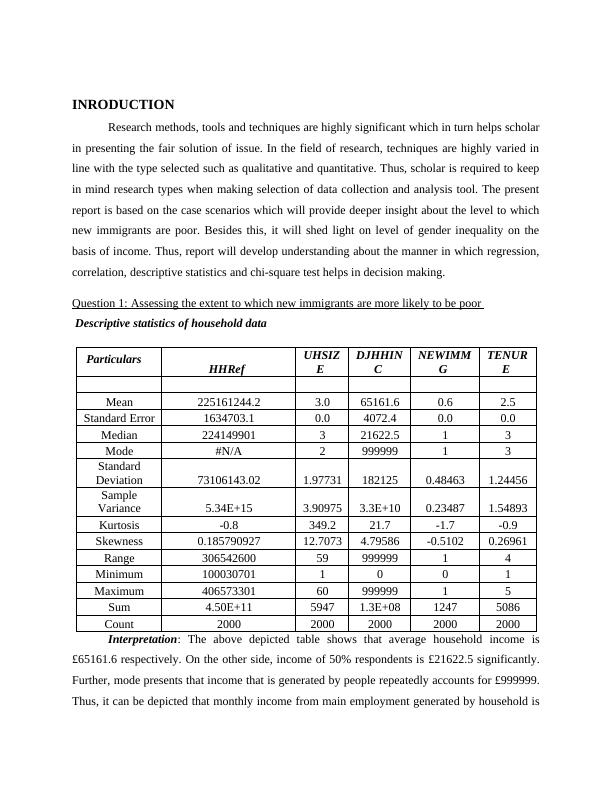
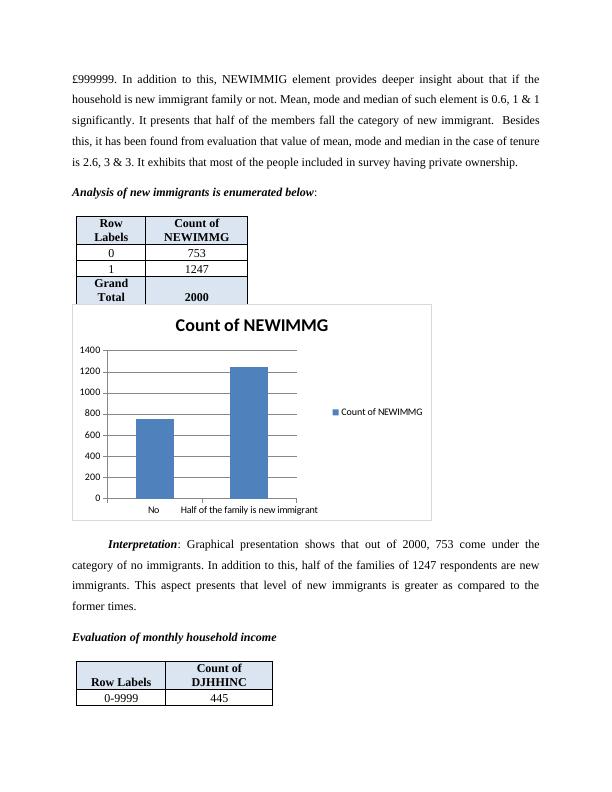
£999999. In addition to this, NEWIMMIG element provides deeper insight about that if thehousehold is new immigrant family or not. Mean, mode and median of such element is 0.6, 1 & 1significantly. It presents that half of the members fall the category of new immigrant. Besidesthis, it has been found from evaluation that value of mean, mode and median in the case of tenureis 2.6, 3 & 3. It exhibits that most of the people included in survey having private ownership.Analysis of new immigrants is enumerated below: RowLabelsCount ofNEWIMMG075311247GrandTotal2000No Half of the family is new immigrant0200400600800100012001400Count of NEWIMMGCount of NEWIMMGInterpretation: Graphical presentation shows that out of 2000, 753 come under thecategory of no immigrants. In addition to this, half of the families of 1247 respondents are newimmigrants. This aspect presents that level of new immigrants is greater as compared to theformer times. Evaluation of monthly household incomeRow LabelsCount ofDJHHINC0-9999445
End of preview
Want to access all the pages? Upload your documents or become a member.