logo

Research Methods for Tourism, Hospitality and Events

This assignment involves putting together a mini portfolio which will examine the understanding of quantitative methods and the use of statistical packages to analyze them. The portfolio must include questionnaire design, descriptive analysis, and chi-square test.

29 Pages1629 Words87 Views
   

Added on  2023-01-03

About This Document

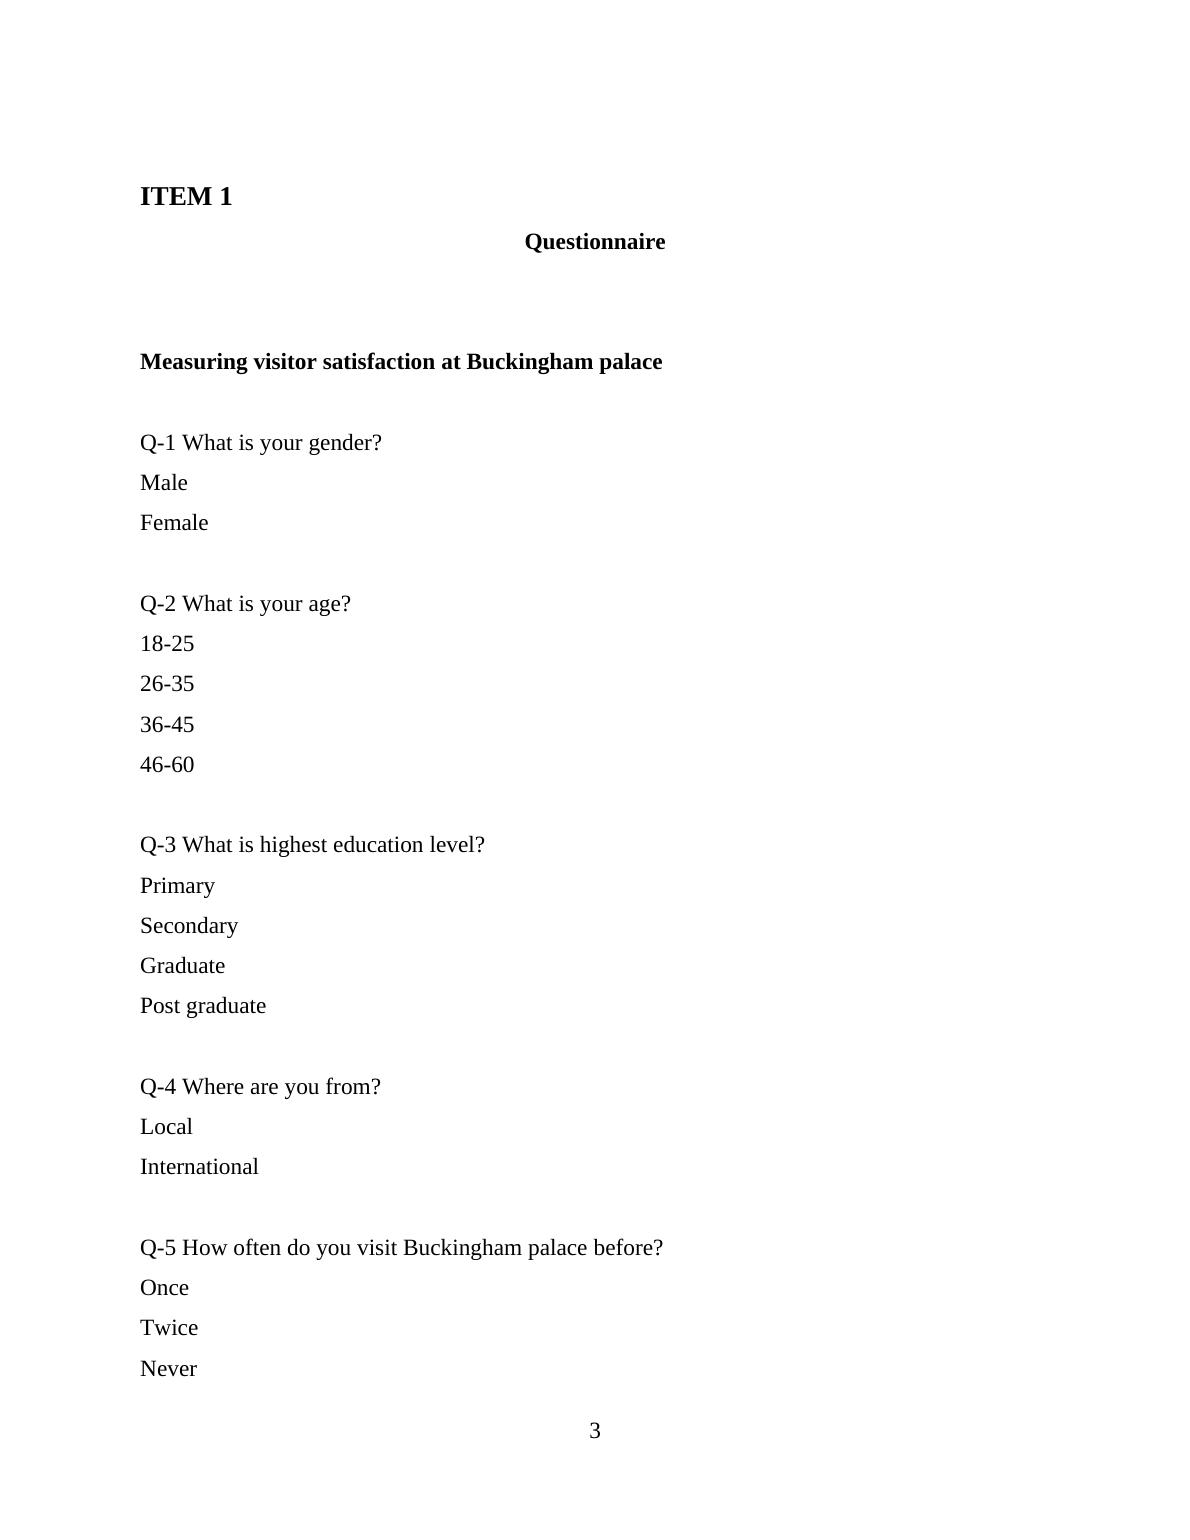
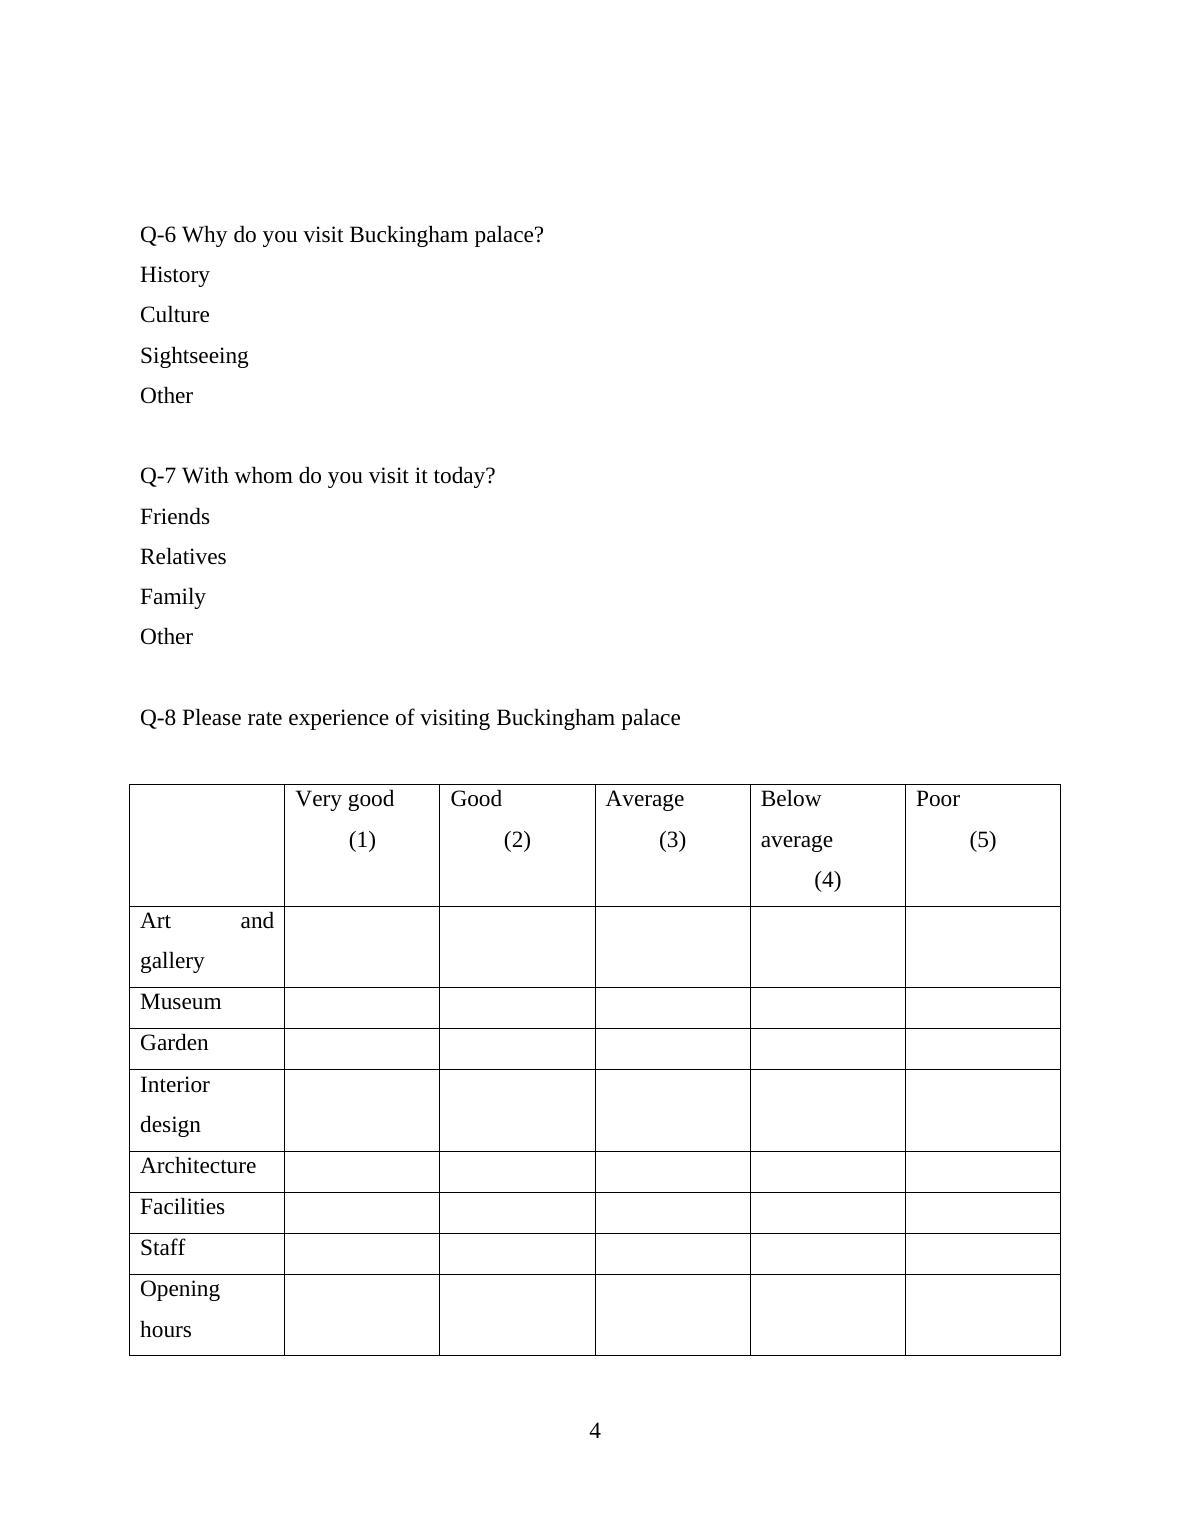
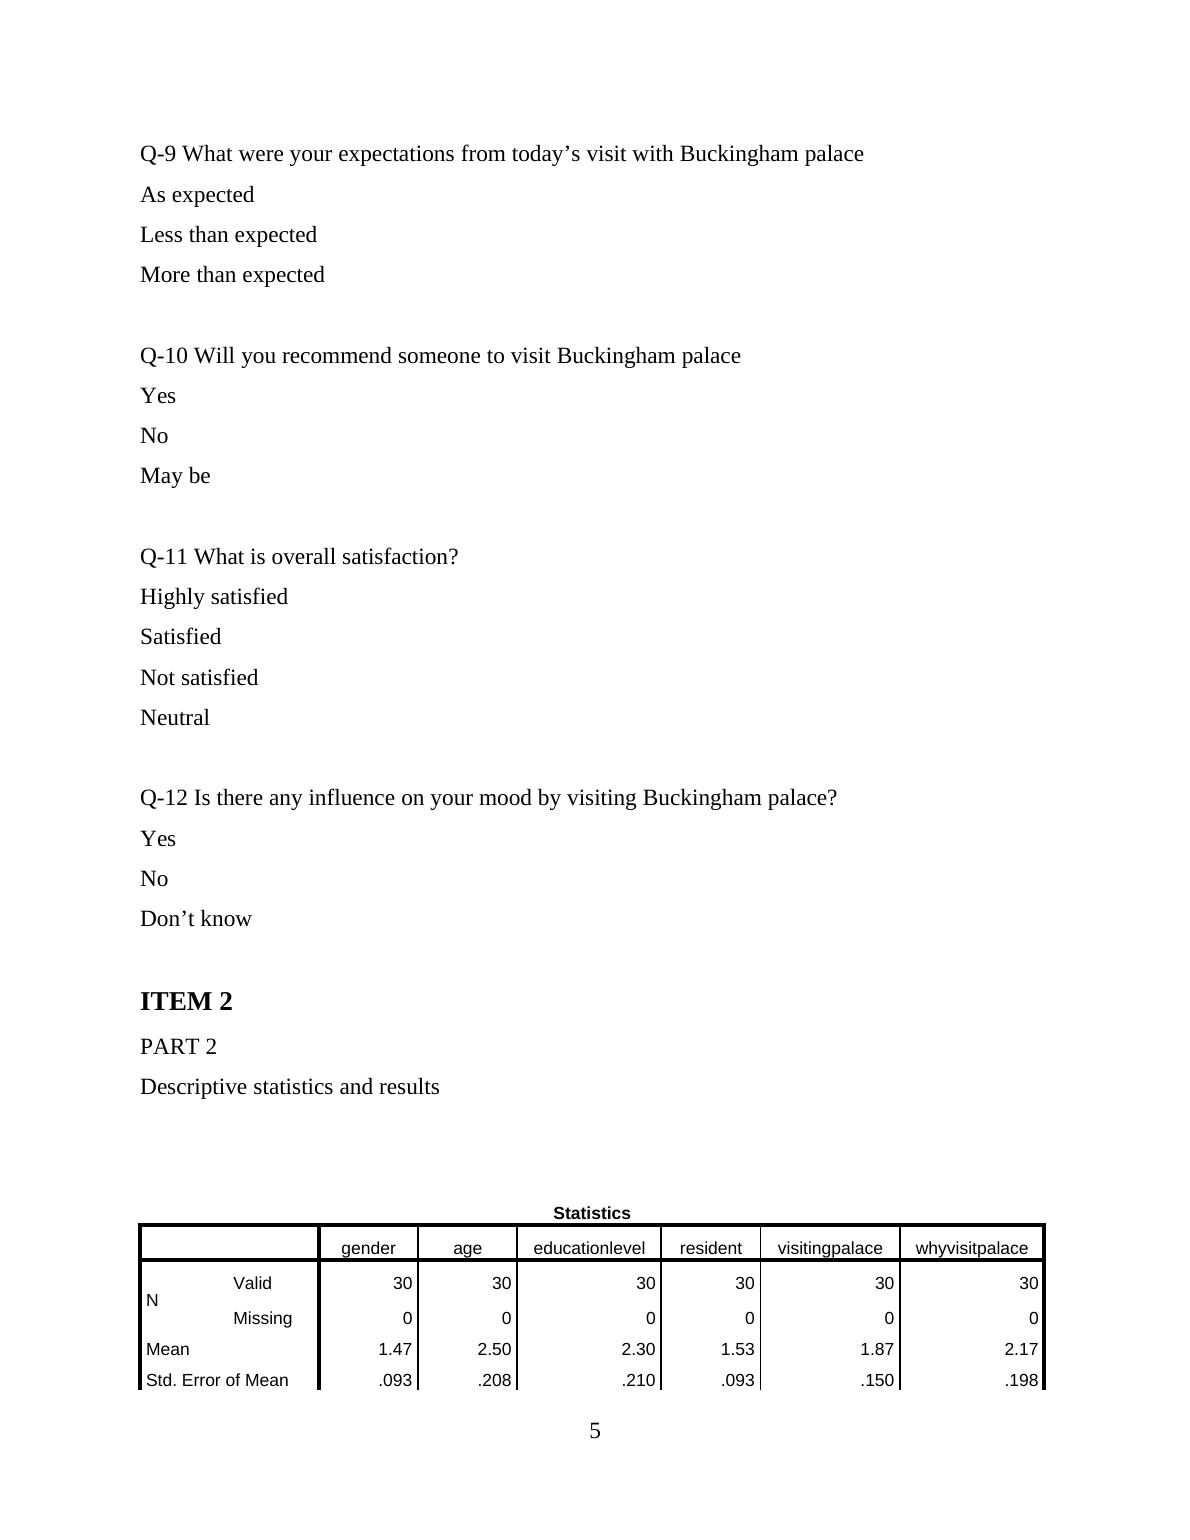
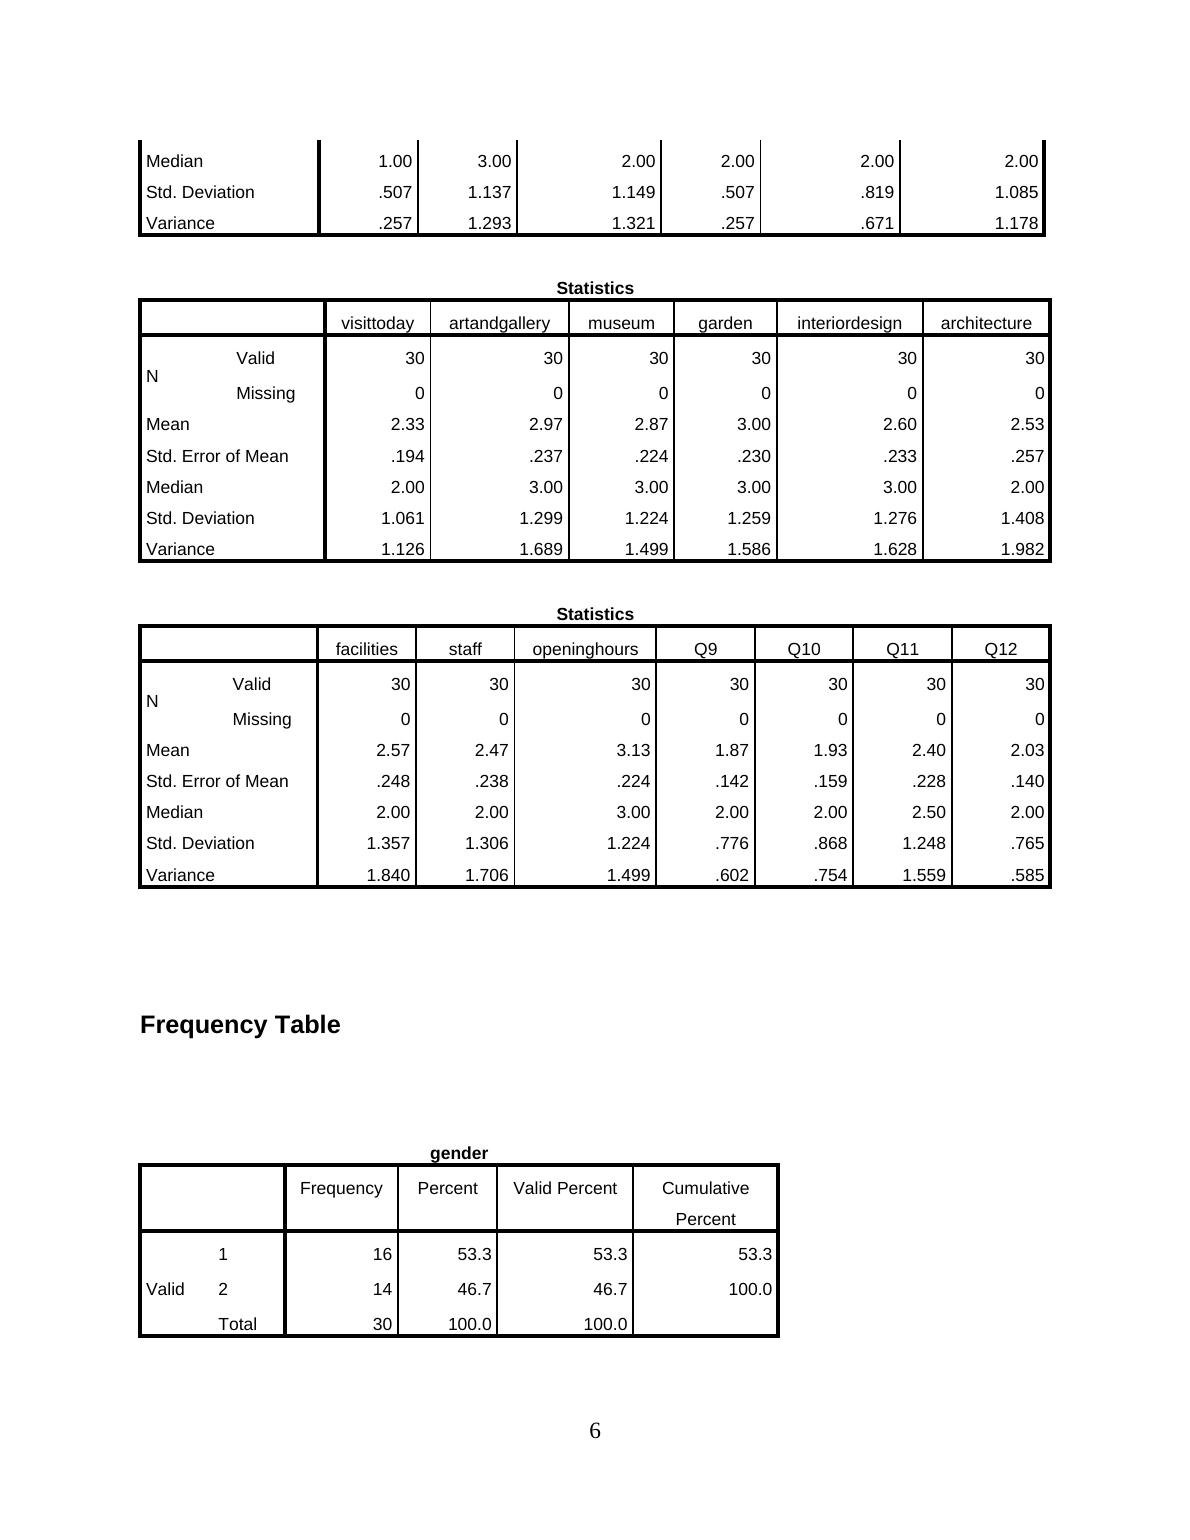
This document discusses the research methods used in the fields of tourism, hospitality, and events. It includes a questionnaire on measuring visitor satisfaction at Buckingham Palace, along with descriptive statistics and results. The findings reveal the demographics and preferences of visitors, their satisfaction levels, and the influence of visiting the palace on mood. The document provides valuable insights for researchers and professionals in the tourism industry.

Research Methods for Tourism, Hospitality and Events

This assignment involves putting together a mini portfolio which will examine the understanding of quantitative methods and the use of statistical packages to analyze them. The portfolio must include questionnaire design, descriptive analysis, and chi-square test.

   Added on 2023-01-03

ShareRelated Documents
Research methods for tourism,
hospitality and events
1
Research Methods for Tourism, Hospitality and Events_1
Table of Contents
ITEM 1.............................................................................................................................................3
ITEM 2.............................................................................................................................................5
ITEM 3...........................................................................................................................................26
REFERENCES..............................................................................................................................29
2
Research Methods for Tourism, Hospitality and Events_2
ITEM 1
Questionnaire
Measuring visitor satisfaction at Buckingham palace
Q-1 What is your gender?
Male
Female
Q-2 What is your age?
18-25
26-35
36-45
46-60
Q-3 What is highest education level?
Primary
Secondary
Graduate
Post graduate
Q-4 Where are you from?
Local
International
Q-5 How often do you visit Buckingham palace before?
Once
Twice
Never
3
Research Methods for Tourism, Hospitality and Events_3
Q-6 Why do you visit Buckingham palace?
History
Culture
Sightseeing
Other
Q-7 With whom do you visit it today?
Friends
Relatives
Family
Other
Q-8 Please rate experience of visiting Buckingham palace
Very good
(1)
Good
(2)
Average
(3)
Below
average
(4)
Poor
(5)
Art and
gallery
Museum
Garden
Interior
design
Architecture
Facilities
Staff
Opening
hours
4
Research Methods for Tourism, Hospitality and Events_4
Q-9 What were your expectations from today’s visit with Buckingham palace
As expected
Less than expected
More than expected
Q-10 Will you recommend someone to visit Buckingham palace
Yes
No
May be
Q-11 What is overall satisfaction?
Highly satisfied
Satisfied
Not satisfied
Neutral
Q-12 Is there any influence on your mood by visiting Buckingham palace?
Yes
No
Don’t know
ITEM 2
PART 2
Descriptive statistics and results
Statistics
gender age educationlevel resident visitingpalace whyvisitpalace
N Valid 30 30 30 30 30 30
Missing 0 0 0 0 0 0
Mean 1.47 2.50 2.30 1.53 1.87 2.17
Std. Error of Mean .093 .208 .210 .093 .150 .198
5
Research Methods for Tourism, Hospitality and Events_5
Median 1.00 3.00 2.00 2.00 2.00 2.00
Std. Deviation .507 1.137 1.149 .507 .819 1.085
Variance .257 1.293 1.321 .257 .671 1.178
Statistics
visittoday artandgallery museum garden interiordesign architecture
N Valid 30 30 30 30 30 30
Missing 0 0 0 0 0 0
Mean 2.33 2.97 2.87 3.00 2.60 2.53
Std. Error of Mean .194 .237 .224 .230 .233 .257
Median 2.00 3.00 3.00 3.00 3.00 2.00
Std. Deviation 1.061 1.299 1.224 1.259 1.276 1.408
Variance 1.126 1.689 1.499 1.586 1.628 1.982
Statistics
facilities staff openinghours Q9 Q10 Q11 Q12
N Valid 30 30 30 30 30 30 30
Missing 0 0 0 0 0 0 0
Mean 2.57 2.47 3.13 1.87 1.93 2.40 2.03
Std. Error of Mean .248 .238 .224 .142 .159 .228 .140
Median 2.00 2.00 3.00 2.00 2.00 2.50 2.00
Std. Deviation 1.357 1.306 1.224 .776 .868 1.248 .765
Variance 1.840 1.706 1.499 .602 .754 1.559 .585
Frequency Table
gender
Frequency Percent Valid Percent Cumulative
Percent
Valid
1 16 53.3 53.3 53.3
2 14 46.7 46.7 100.0
Total 30 100.0 100.0
6
Research Methods for Tourism, Hospitality and Events_6

End of preview

Want to access all the pages? Upload your documents or become a member.

Related Documents
SPSS Statistics Gender Analysis
|16
|880
|69

SOC5QSR Quantitative Skills for Social Research
|13
|1990
|200