Research Methods in Psychology: Statistics and Regression Analysis
VerifiedAdded on 2020/11/23
|16
|1704
|281
Homework Assignment
AI Summary
This assignment delves into research methods in psychology, specifically focusing on statistical analysis using regression. The student explores the relationships between various variables, including performance, IQ, metacognition, social skills, motivation, and leadership. The assignment utilizes linear regression to identify the level of relationship between these variables. It includes hypothesis testing, model summaries, ANOVA tables, and coefficient interpretations to determine the significance of these relationships. The analysis reveals significant correlations between the variables, with varying degrees of influence. The student provides interpretations of the statistical outputs, including R-squared values, p-values, and ANOVA results. Graphs are also included to visually represent the relationships between the variables, and the assignment concludes with suggestions for the company based on the findings.
RESEARCH METHODS IN
PSYCHOLOGY -
STATISTICS
PSYCHOLOGY -
STATISTICS
Paraphrase This Document
Need a fresh take? Get an instant paraphrase of this document with our AI Paraphraser
Table of Contents
INTRODUCTION...........................................................................................................................1
TASK...............................................................................................................................................1
Research question........................................................................................................................1
Equation for regression................................................................................................................6
Rank.............................................................................................................................................6
Correlation...................................................................................................................................6
Graphs..........................................................................................................................................9
CONCLUSION..............................................................................................................................13
REFERENCES..............................................................................................................................15
INTRODUCTION
Regression analysis assist in identifying the relationship between the variables. This
assignment will include the analysis on the basis of which the relationship between the variables
will be identified that will help the company is changing their assessment criteria.
TASK
Research question
What is the relationship between performance and metacognition ?
What is the relation between performance and leadership?
What is the relationship between performance and social skills?
What is the relationship between IQ and performance
What is the relation between performance and motivation?
The linear regression method is chosen for the analysis because it assist in identifying the
level of relationship existing between the variables.
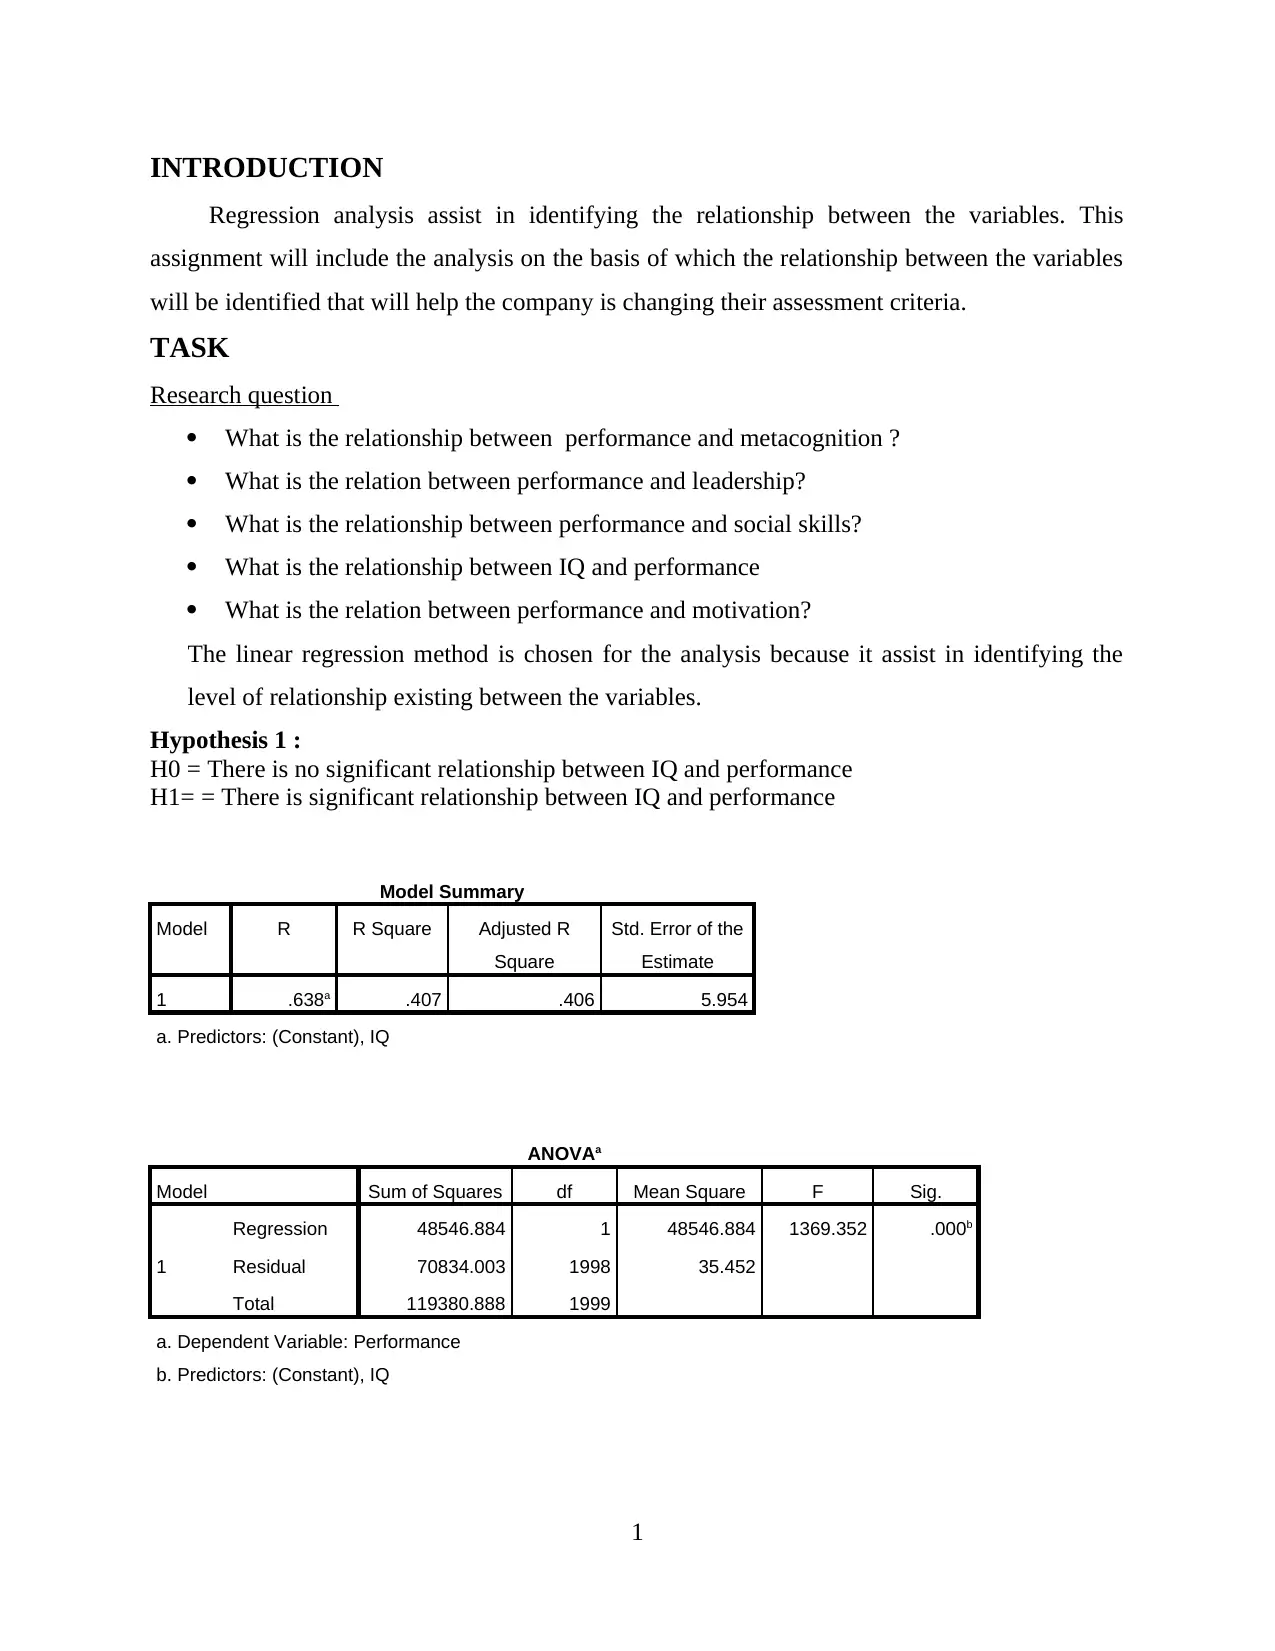
Hypothesis 1 :
H0 = There is no significant relationship between IQ and performance
H1= = There is significant relationship between IQ and performance
Model Summary
Model R R Square Adjusted R
Square
Std. Error of the
Estimate
1 .638a .407 .406 5.954
a. Predictors: (Constant), IQ
ANOVAa
Model Sum of Squares df Mean Square F Sig.
1
Regression 48546.884 1 48546.884 1369.352 .000b
Residual 70834.003 1998 35.452
Total 119380.888 1999
a. Dependent Variable: Performance
b. Predictors: (Constant), IQ
1
Regression analysis assist in identifying the relationship between the variables. This
assignment will include the analysis on the basis of which the relationship between the variables
will be identified that will help the company is changing their assessment criteria.
TASK
Research question
What is the relationship between performance and metacognition ?
What is the relation between performance and leadership?
What is the relationship between performance and social skills?
What is the relationship between IQ and performance
What is the relation between performance and motivation?
The linear regression method is chosen for the analysis because it assist in identifying the
level of relationship existing between the variables.
Hypothesis 1 :
H0 = There is no significant relationship between IQ and performance
H1= = There is significant relationship between IQ and performance
Model Summary
Model R R Square Adjusted R
Square
Std. Error of the
Estimate
1 .638a .407 .406 5.954
a. Predictors: (Constant), IQ
ANOVAa
Model Sum of Squares df Mean Square F Sig.
1
Regression 48546.884 1 48546.884 1369.352 .000b
Residual 70834.003 1998 35.452
Total 119380.888 1999
a. Dependent Variable: Performance
b. Predictors: (Constant), IQ
1
⊘ This is a preview!⊘
Do you want full access?
Subscribe today to unlock all pages.
Trusted by 1+ million students worldwide
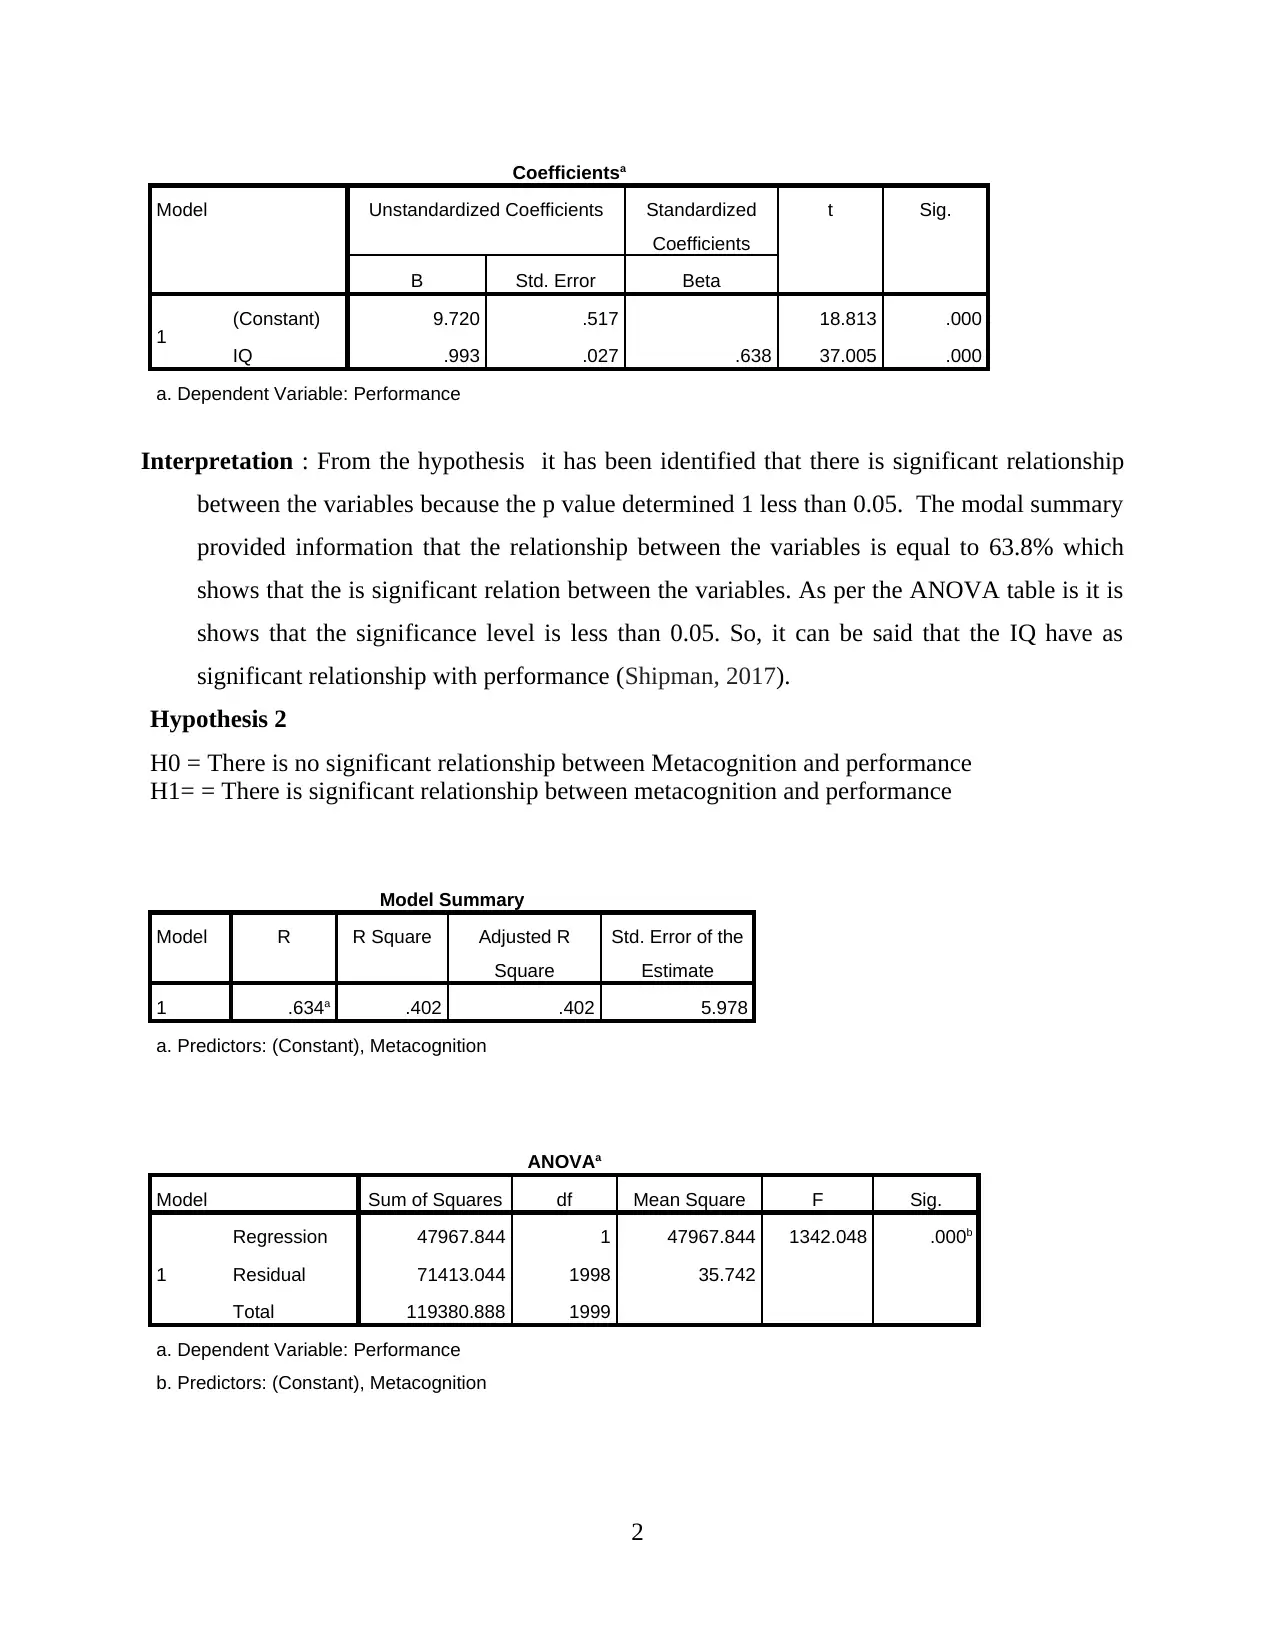
Coefficientsa
Model Unstandardized Coefficients Standardized
Coefficients
t Sig.
B Std. Error Beta
1 (Constant) 9.720 .517 18.813 .000
IQ .993 .027 .638 37.005 .000
a. Dependent Variable: Performance
Interpretation : From the hypothesis it has been identified that there is significant relationship
between the variables because the p value determined 1 less than 0.05. The modal summary
provided information that the relationship between the variables is equal to 63.8% which
shows that the is significant relation between the variables. As per the ANOVA table is it is
shows that the significance level is less than 0.05. So, it can be said that the IQ have as
significant relationship with performance (Shipman, 2017).
Hypothesis 2
H0 = There is no significant relationship between Metacognition and performance
H1= = There is significant relationship between metacognition and performance
Model Summary
Model R R Square Adjusted R
Square
Std. Error of the
Estimate
1 .634a .402 .402 5.978
a. Predictors: (Constant), Metacognition
ANOVAa
Model Sum of Squares df Mean Square F Sig.
1
Regression 47967.844 1 47967.844 1342.048 .000b
Residual 71413.044 1998 35.742
Total 119380.888 1999
a. Dependent Variable: Performance
b. Predictors: (Constant), Metacognition
2
Paraphrase This Document
Need a fresh take? Get an instant paraphrase of this document with our AI Paraphraser
Coefficientsa
Model Unstandardized Coefficients Standardized
Coefficients
t Sig.
B Std. Error Beta
1 (Constant) 12.874 .439 29.326 .000
Metacognition .971 .027 .634 36.634 .000
a. Dependent Variable: Performance
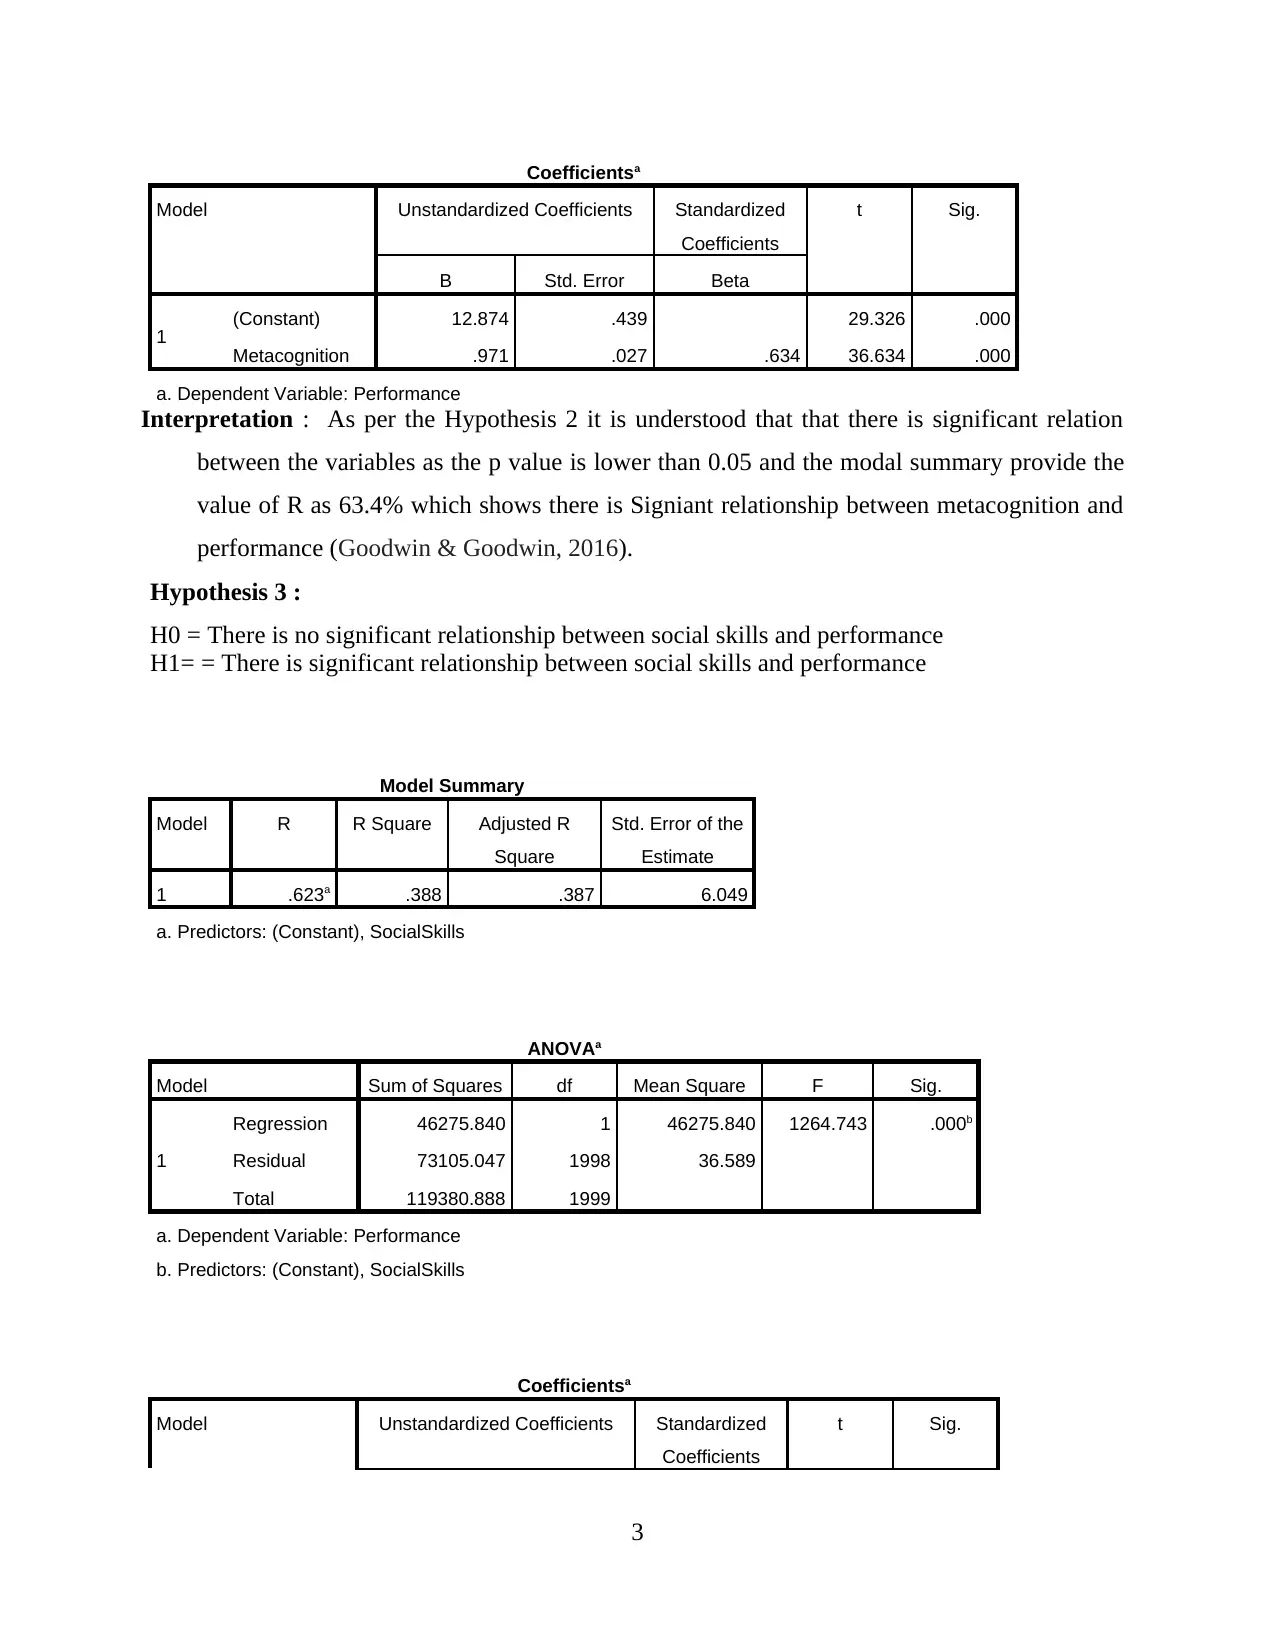
Interpretation : As per the Hypothesis 2 it is understood that that there is significant relation
between the variables as the p value is lower than 0.05 and the modal summary provide the
value of R as 63.4% which shows there is Signiant relationship between metacognition and
performance (Goodwin & Goodwin, 2016).
Hypothesis 3 :
H0 = There is no significant relationship between social skills and performance
H1= = There is significant relationship between social skills and performance
Model Summary
Model R R Square Adjusted R
Square
Std. Error of the
Estimate
1 .623a .388 .387 6.049
a. Predictors: (Constant), SocialSkills
ANOVAa
Model Sum of Squares df Mean Square F Sig.
1
Regression 46275.840 1 46275.840 1264.743 .000b
Residual 73105.047 1998 36.589
Total 119380.888 1999
a. Dependent Variable: Performance
b. Predictors: (Constant), SocialSkills
Coefficientsa
Model Unstandardized Coefficients Standardized
Coefficients
t Sig.
3
Model Unstandardized Coefficients Standardized
Coefficients
t Sig.
B Std. Error Beta
1 (Constant) 12.874 .439 29.326 .000
Metacognition .971 .027 .634 36.634 .000
a. Dependent Variable: Performance
Interpretation : As per the Hypothesis 2 it is understood that that there is significant relation
between the variables as the p value is lower than 0.05 and the modal summary provide the
value of R as 63.4% which shows there is Signiant relationship between metacognition and
performance (Goodwin & Goodwin, 2016).
Hypothesis 3 :
H0 = There is no significant relationship between social skills and performance
H1= = There is significant relationship between social skills and performance
Model Summary
Model R R Square Adjusted R
Square
Std. Error of the
Estimate
1 .623a .388 .387 6.049
a. Predictors: (Constant), SocialSkills
ANOVAa
Model Sum of Squares df Mean Square F Sig.
1
Regression 46275.840 1 46275.840 1264.743 .000b
Residual 73105.047 1998 36.589
Total 119380.888 1999
a. Dependent Variable: Performance
b. Predictors: (Constant), SocialSkills
Coefficientsa
Model Unstandardized Coefficients Standardized
Coefficients
t Sig.
3
B Std. Error Beta
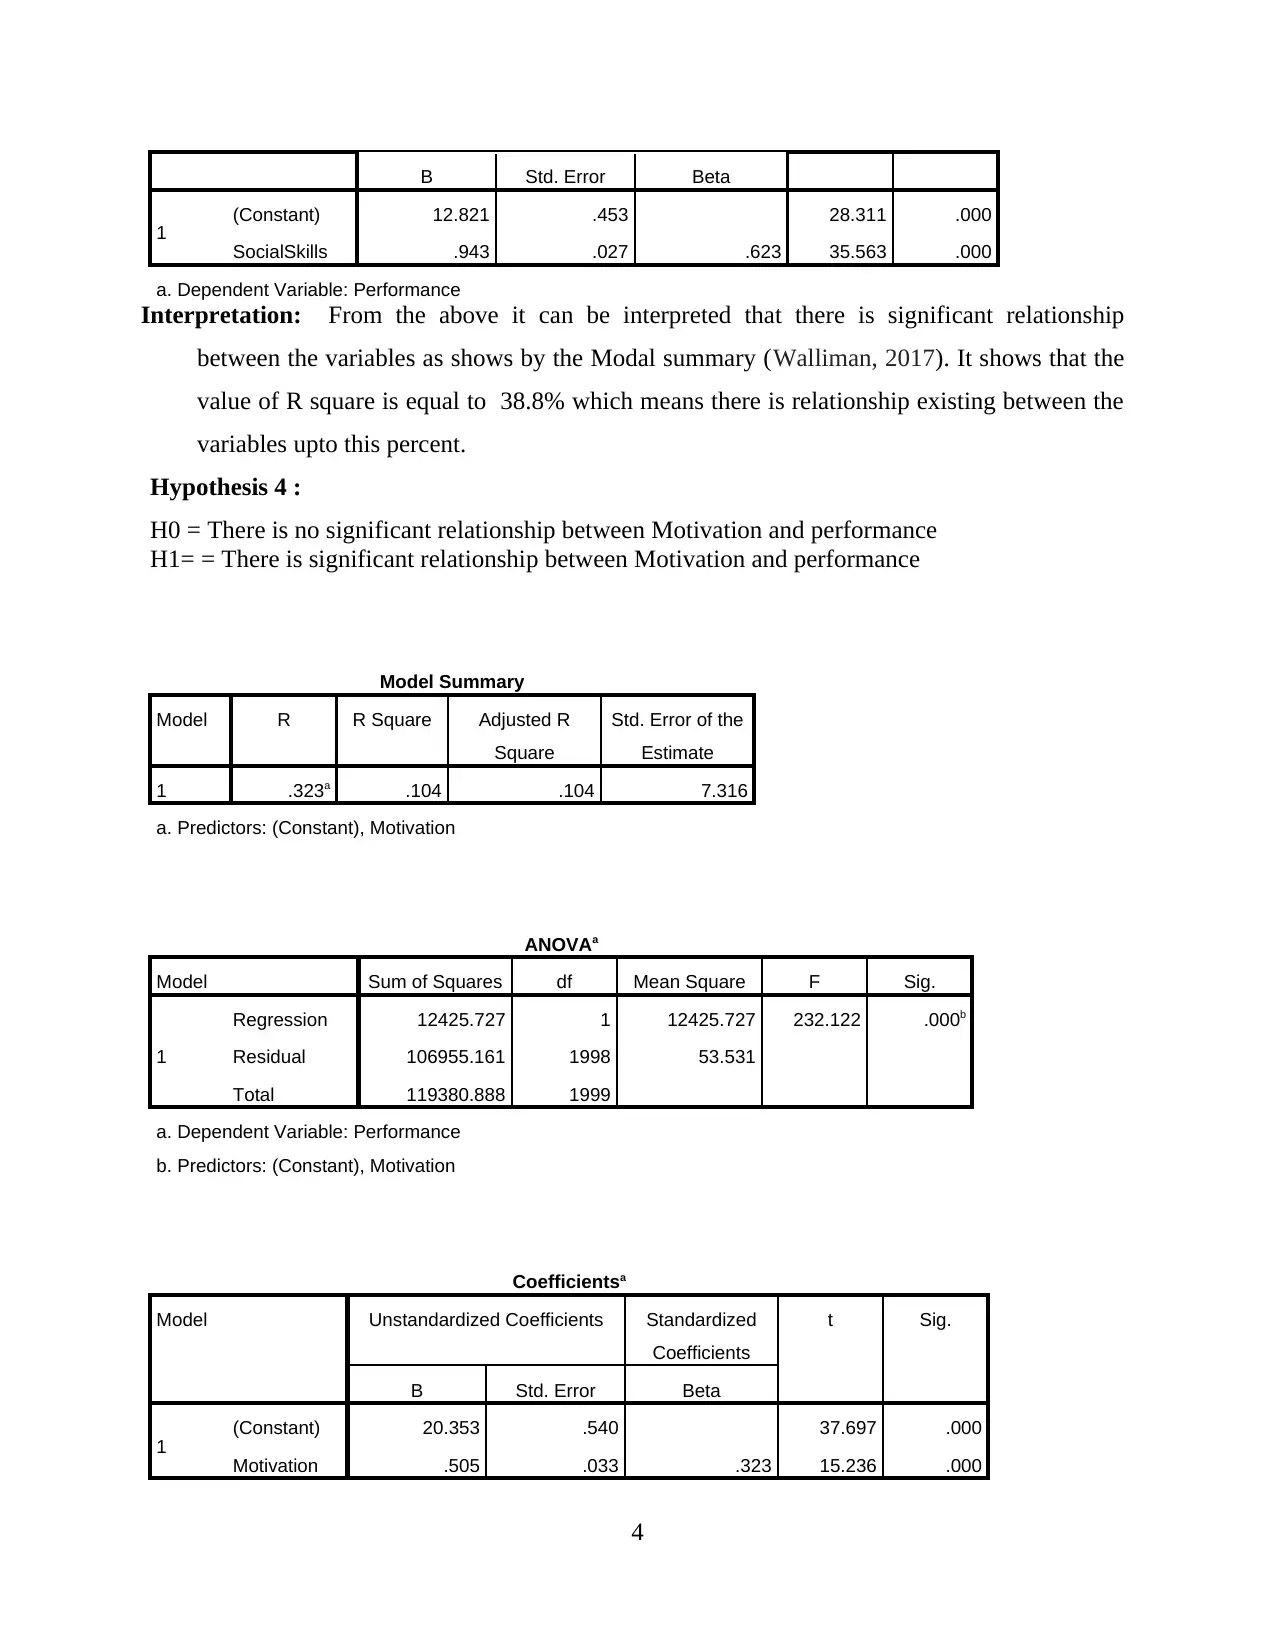
1 (Constant) 12.821 .453 28.311 .000
SocialSkills .943 .027 .623 35.563 .000
a. Dependent Variable: Performance
Interpretation: From the above it can be interpreted that there is significant relationship
between the variables as shows by the Modal summary (Walliman, 2017). It shows that the
value of R square is equal to 38.8% which means there is relationship existing between the
variables upto this percent.
Hypothesis 4 :
H0 = There is no significant relationship between Motivation and performance
H1= = There is significant relationship between Motivation and performance
Model Summary
Model R R Square Adjusted R
Square
Std. Error of the
Estimate
1 .323a .104 .104 7.316
a. Predictors: (Constant), Motivation
ANOVAa
Model Sum of Squares df Mean Square F Sig.
1
Regression 12425.727 1 12425.727 232.122 .000b
Residual 106955.161 1998 53.531
Total 119380.888 1999
a. Dependent Variable: Performance
b. Predictors: (Constant), Motivation
Coefficientsa
Model Unstandardized Coefficients Standardized
Coefficients
t Sig.
B Std. Error Beta
1 (Constant) 20.353 .540 37.697 .000
Motivation .505 .033 .323 15.236 .000
4
⊘ This is a preview!⊘
Do you want full access?
Subscribe today to unlock all pages.
Trusted by 1+ million students worldwide
a. Dependent Variable: Performance
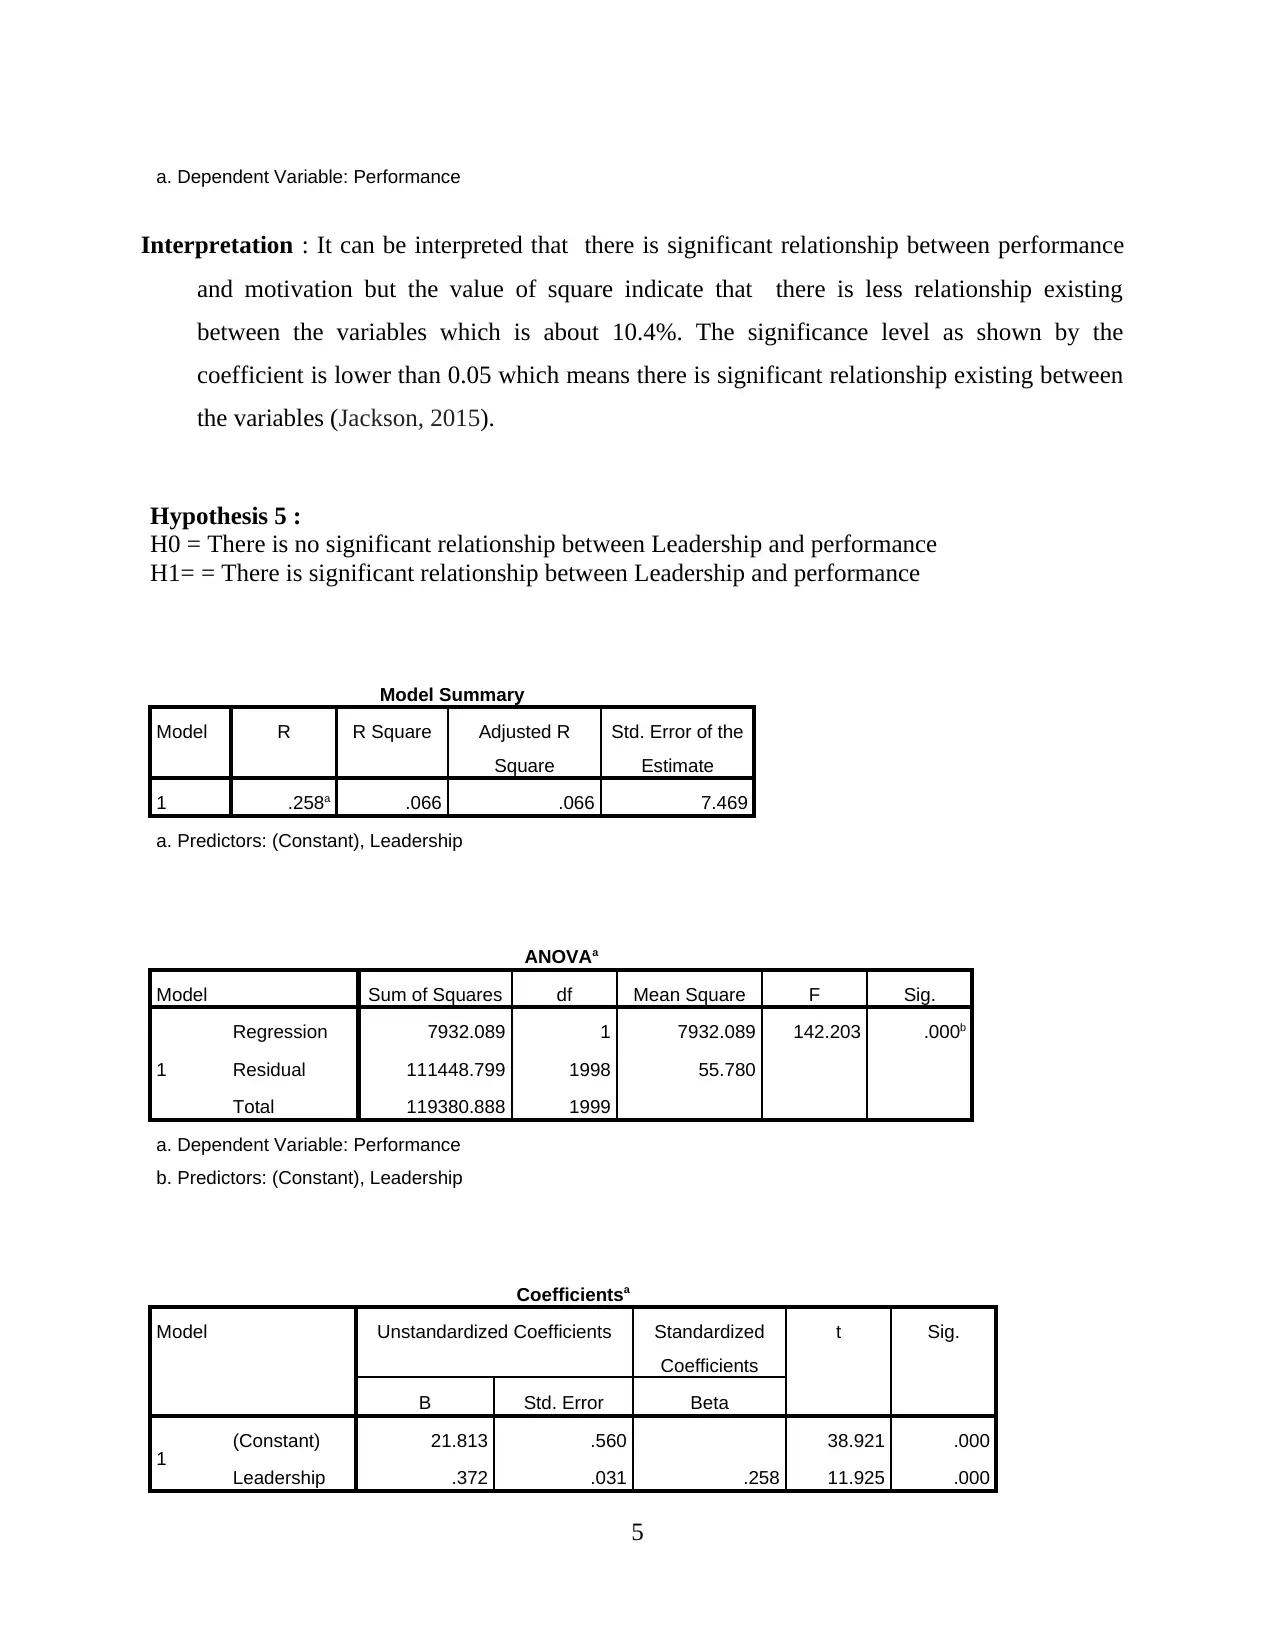
Interpretation : It can be interpreted that there is significant relationship between performance
and motivation but the value of square indicate that there is less relationship existing
between the variables which is about 10.4%. The significance level as shown by the
coefficient is lower than 0.05 which means there is significant relationship existing between
the variables (Jackson, 2015).
Hypothesis 5 :
H0 = There is no significant relationship between Leadership and performance
H1= = There is significant relationship between Leadership and performance
Model Summary
Model R R Square Adjusted R
Square
Std. Error of the
Estimate
1 .258a .066 .066 7.469
a. Predictors: (Constant), Leadership
ANOVAa
Model Sum of Squares df Mean Square F Sig.
1
Regression 7932.089 1 7932.089 142.203 .000b
Residual 111448.799 1998 55.780
Total 119380.888 1999
a. Dependent Variable: Performance
b. Predictors: (Constant), Leadership
Coefficientsa
Model Unstandardized Coefficients Standardized
Coefficients
t Sig.
B Std. Error Beta
1 (Constant) 21.813 .560 38.921 .000
Leadership .372 .031 .258 11.925 .000
5
Paraphrase This Document
Need a fresh take? Get an instant paraphrase of this document with our AI Paraphraser
a. Dependent Variable: Performance
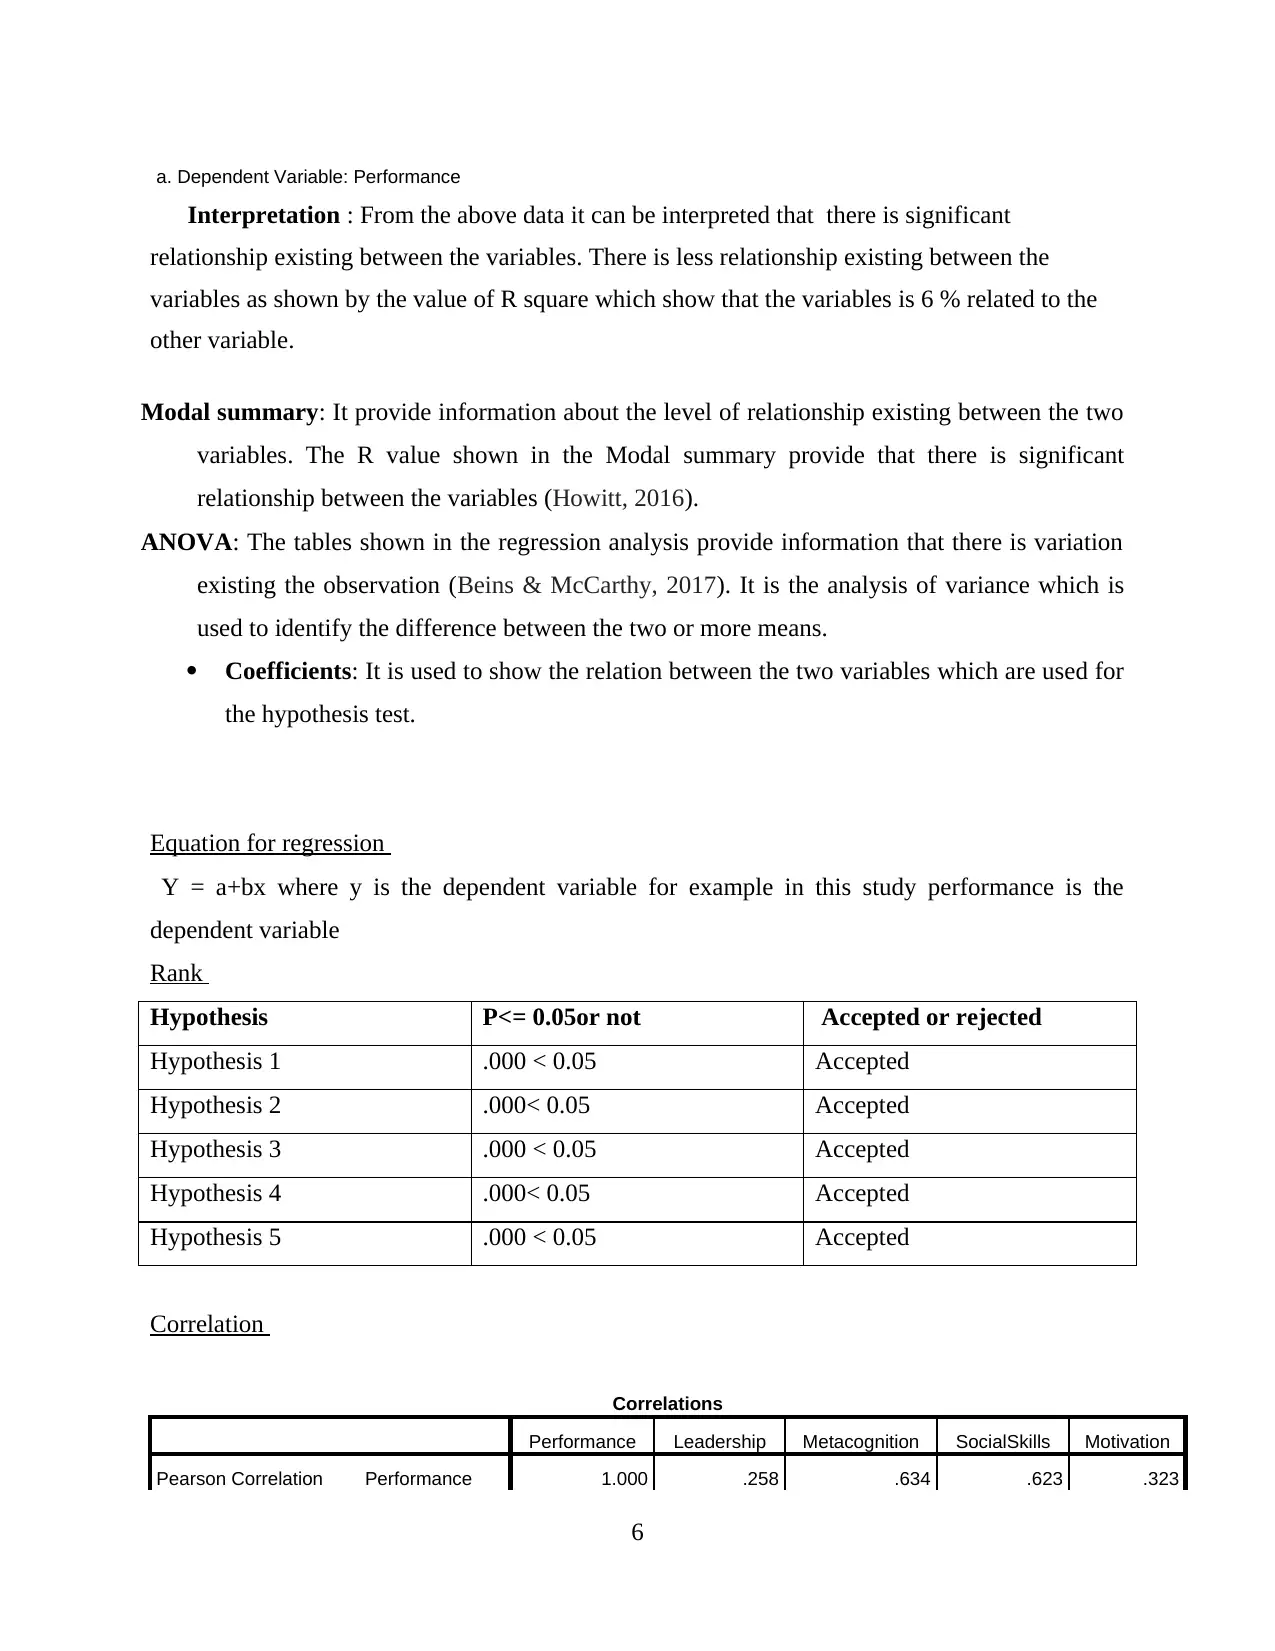
Interpretation : From the above data it can be interpreted that there is significant
relationship existing between the variables. There is less relationship existing between the
variables as shown by the value of R square which show that the variables is 6 % related to the
other variable.
Modal summary: It provide information about the level of relationship existing between the two
variables. The R value shown in the Modal summary provide that there is significant
relationship between the variables (Howitt, 2016).
ANOVA: The tables shown in the regression analysis provide information that there is variation
existing the observation (Beins & McCarthy, 2017). It is the analysis of variance which is
used to identify the difference between the two or more means.
Coefficients: It is used to show the relation between the two variables which are used for
the hypothesis test.
Equation for regression
Y = a+bx where y is the dependent variable for example in this study performance is the
dependent variable
Rank
Hypothesis P<= 0.05or not Accepted or rejected
Hypothesis 1 .000 < 0.05 Accepted
Hypothesis 2 .000< 0.05 Accepted
Hypothesis 3 .000 < 0.05 Accepted
Hypothesis 4 .000< 0.05 Accepted
Hypothesis 5 .000 < 0.05 Accepted
Correlation
Correlations
Performance Leadership Metacognition SocialSkills Motivation
Pearson Correlation Performance 1.000 .258 .634 .623 .323
6
Leadership .258 1.000 -.049 -.054 .929
Metacognition .634 -.049 1.000 .978 -.057
SocialSkills .623 -.054 .978 1.000 -.061
Motivation .323 .929 -.057 -.061 1.000
Sig. (1-tailed)
Performance . .000 .000 .000 .000
Leadership .000 . .015 .008 .000
Metacognition .000 .015 . .000 .005
SocialSkills .000 .008 .000 . .003
Motivation .000 .000 .005 .003 .
N
Performance 2000 2000 2000 2000 2000
Leadership 2000 2000 2000 2000 2000
Metacognition 2000 2000 2000 2000 2000
SocialSkills 2000 2000 2000 2000 2000
Motivation 2000 2000 2000 2000 2000
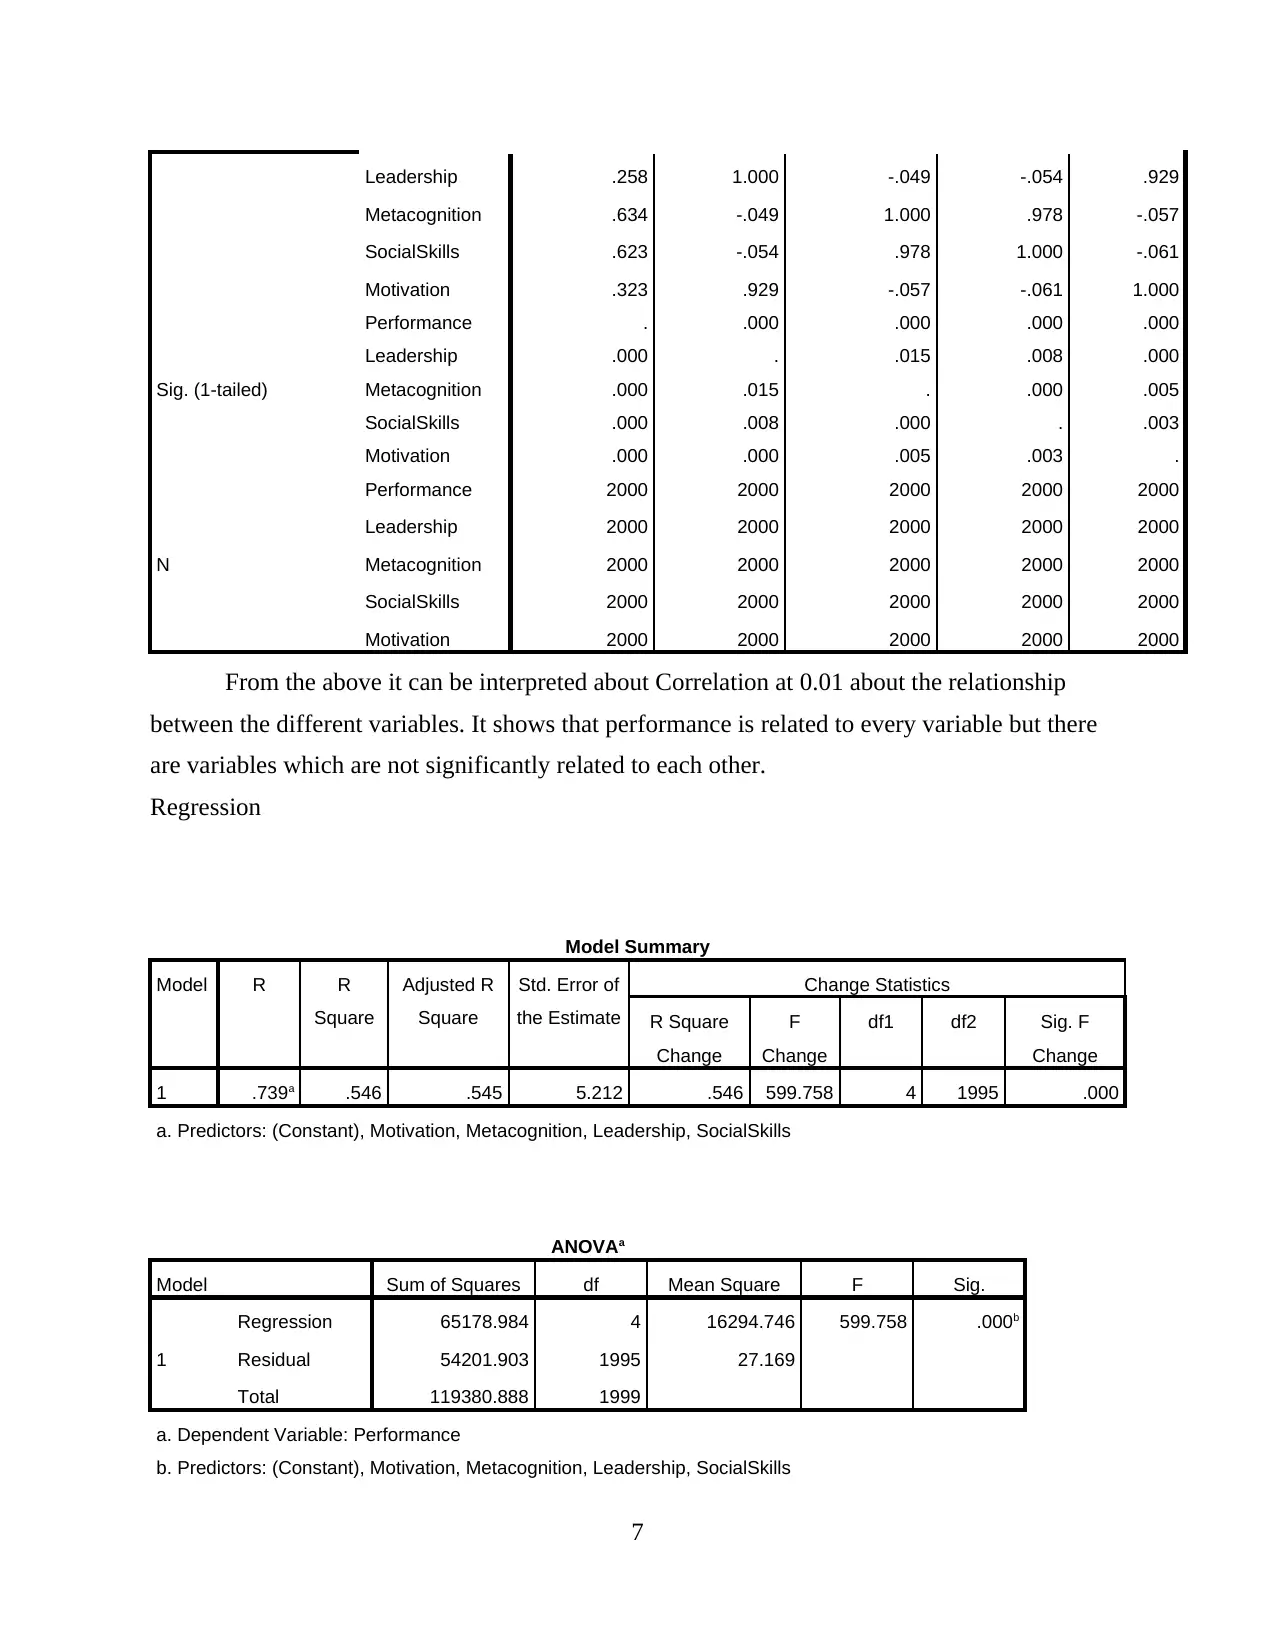
From the above it can be interpreted about Correlation at 0.01 about the relationship
between the different variables. It shows that performance is related to every variable but there
are variables which are not significantly related to each other.
Regression
Model Summary
Model R R
Square
Adjusted R
Square
Std. Error of
the Estimate
Change Statistics
R Square
Change
F
Change
df1 df2 Sig. F
Change
1 .739a .546 .545 5.212 .546 599.758 4 1995 .000
a. Predictors: (Constant), Motivation, Metacognition, Leadership, SocialSkills
ANOVAa
Model Sum of Squares df Mean Square F Sig.
1
Regression 65178.984 4 16294.746 599.758 .000b
Residual 54201.903 1995 27.169
Total 119380.888 1999
a. Dependent Variable: Performance
b. Predictors: (Constant), Motivation, Metacognition, Leadership, SocialSkills
7
Metacognition .634 -.049 1.000 .978 -.057
SocialSkills .623 -.054 .978 1.000 -.061
Motivation .323 .929 -.057 -.061 1.000
Sig. (1-tailed)
Performance . .000 .000 .000 .000
Leadership .000 . .015 .008 .000
Metacognition .000 .015 . .000 .005
SocialSkills .000 .008 .000 . .003
Motivation .000 .000 .005 .003 .
N
Performance 2000 2000 2000 2000 2000
Leadership 2000 2000 2000 2000 2000
Metacognition 2000 2000 2000 2000 2000
SocialSkills 2000 2000 2000 2000 2000
Motivation 2000 2000 2000 2000 2000
From the above it can be interpreted about Correlation at 0.01 about the relationship
between the different variables. It shows that performance is related to every variable but there
are variables which are not significantly related to each other.
Regression
Model Summary
Model R R
Square
Adjusted R
Square
Std. Error of
the Estimate
Change Statistics
R Square
Change
F
Change
df1 df2 Sig. F
Change
1 .739a .546 .545 5.212 .546 599.758 4 1995 .000
a. Predictors: (Constant), Motivation, Metacognition, Leadership, SocialSkills
ANOVAa
Model Sum of Squares df Mean Square F Sig.
1
Regression 65178.984 4 16294.746 599.758 .000b
Residual 54201.903 1995 27.169
Total 119380.888 1999
a. Dependent Variable: Performance
b. Predictors: (Constant), Motivation, Metacognition, Leadership, SocialSkills
7
⊘ This is a preview!⊘
Do you want full access?
Subscribe today to unlock all pages.
Trusted by 1+ million students worldwide
Coefficientsa
Model Unstandardized
Coefficients
Standardized
Coefficients
t Sig. 99.0% Confidence Interval
for B
B Std. Error Beta Lower Bound Upper Bound
1
(Constant) 4.196 .558 7.515 .000 2.756 5.635
Leadership -.471 .059 -.326 -7.998 .000 -.623 -.319
Metacognition .868 .111 .567 7.802 .000 .581 1.155
SocialSkills .138 .110 .091 1.257 .209 -.145 .422
Motivation 1.038 .064 .663 16.269 .000 .873 1.202
a. Dependent Variable: Performance
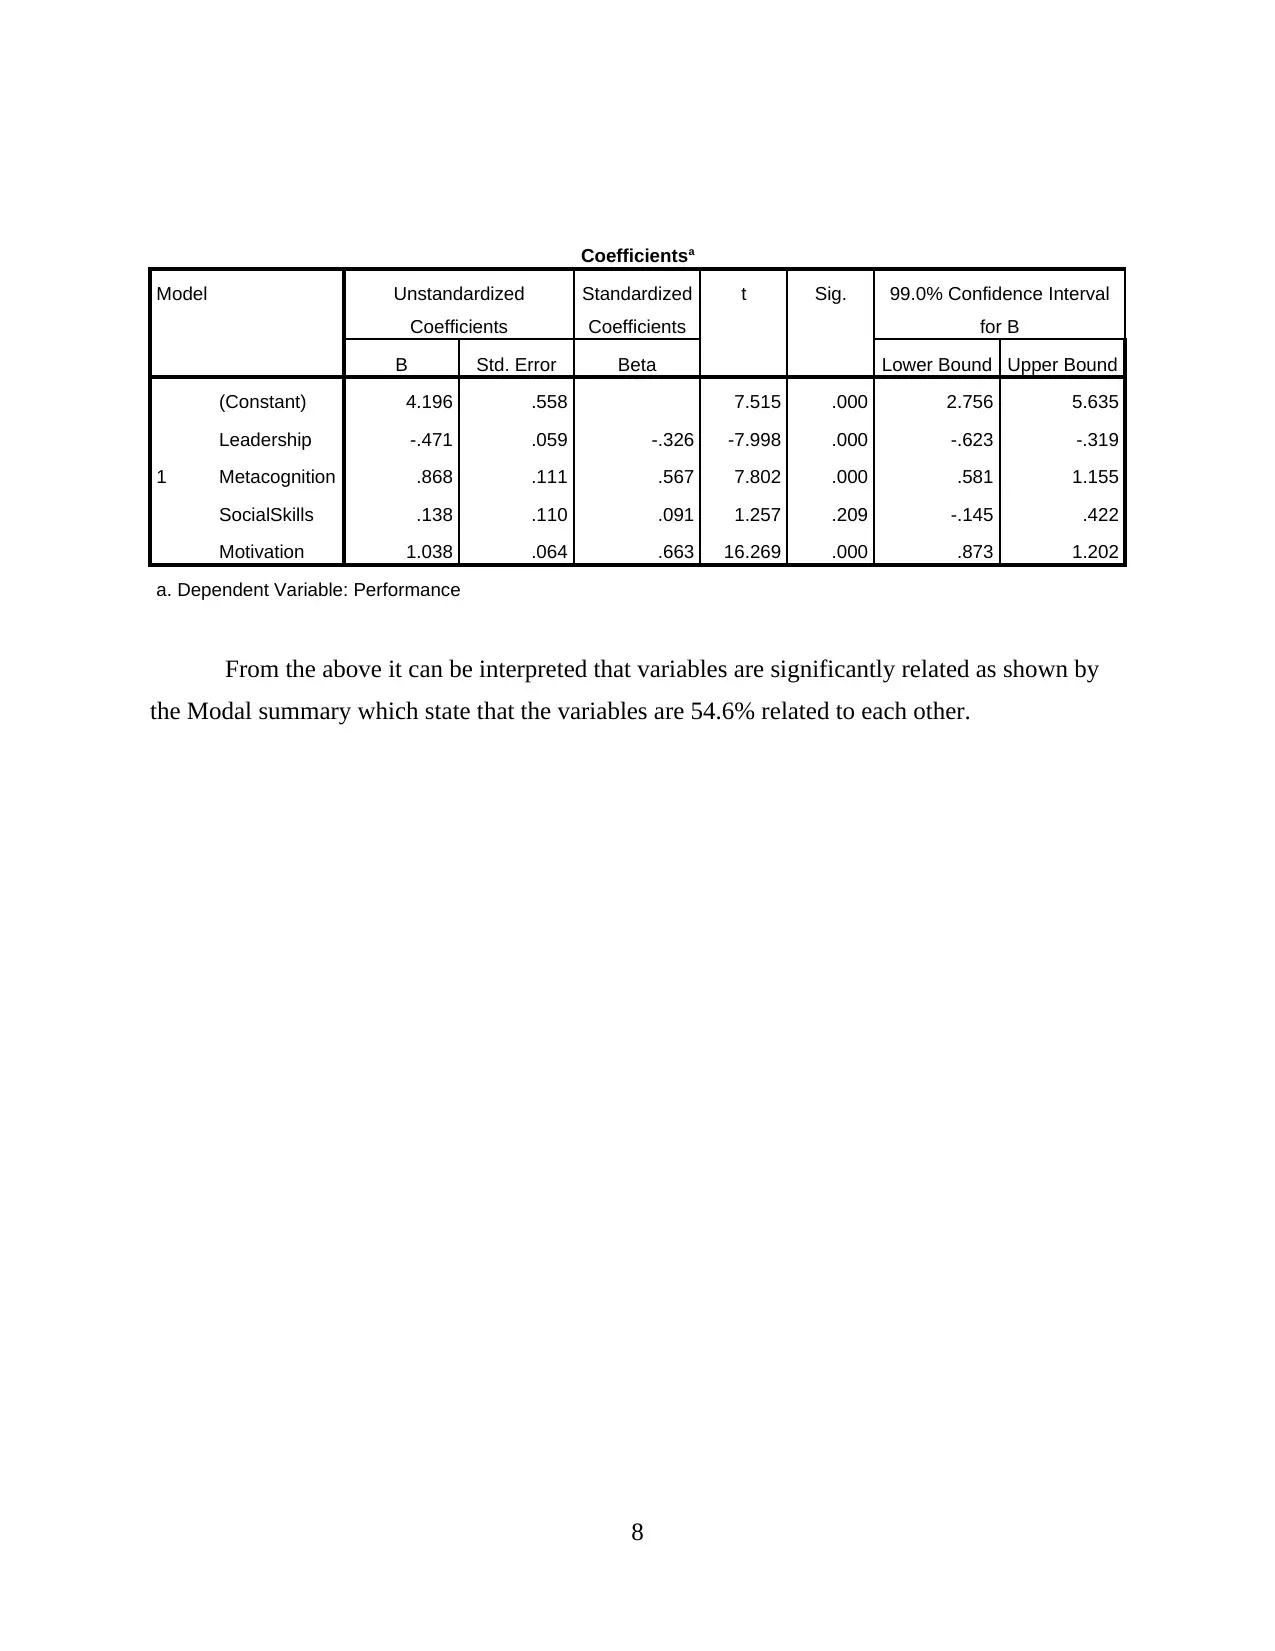
From the above it can be interpreted that variables are significantly related as shown by
the Modal summary which state that the variables are 54.6% related to each other.
8
Model Unstandardized
Coefficients
Standardized
Coefficients
t Sig. 99.0% Confidence Interval
for B
B Std. Error Beta Lower Bound Upper Bound
1
(Constant) 4.196 .558 7.515 .000 2.756 5.635
Leadership -.471 .059 -.326 -7.998 .000 -.623 -.319
Metacognition .868 .111 .567 7.802 .000 .581 1.155
SocialSkills .138 .110 .091 1.257 .209 -.145 .422
Motivation 1.038 .064 .663 16.269 .000 .873 1.202
a. Dependent Variable: Performance
From the above it can be interpreted that variables are significantly related as shown by
the Modal summary which state that the variables are 54.6% related to each other.
8
Paraphrase This Document
Need a fresh take? Get an instant paraphrase of this document with our AI Paraphraser
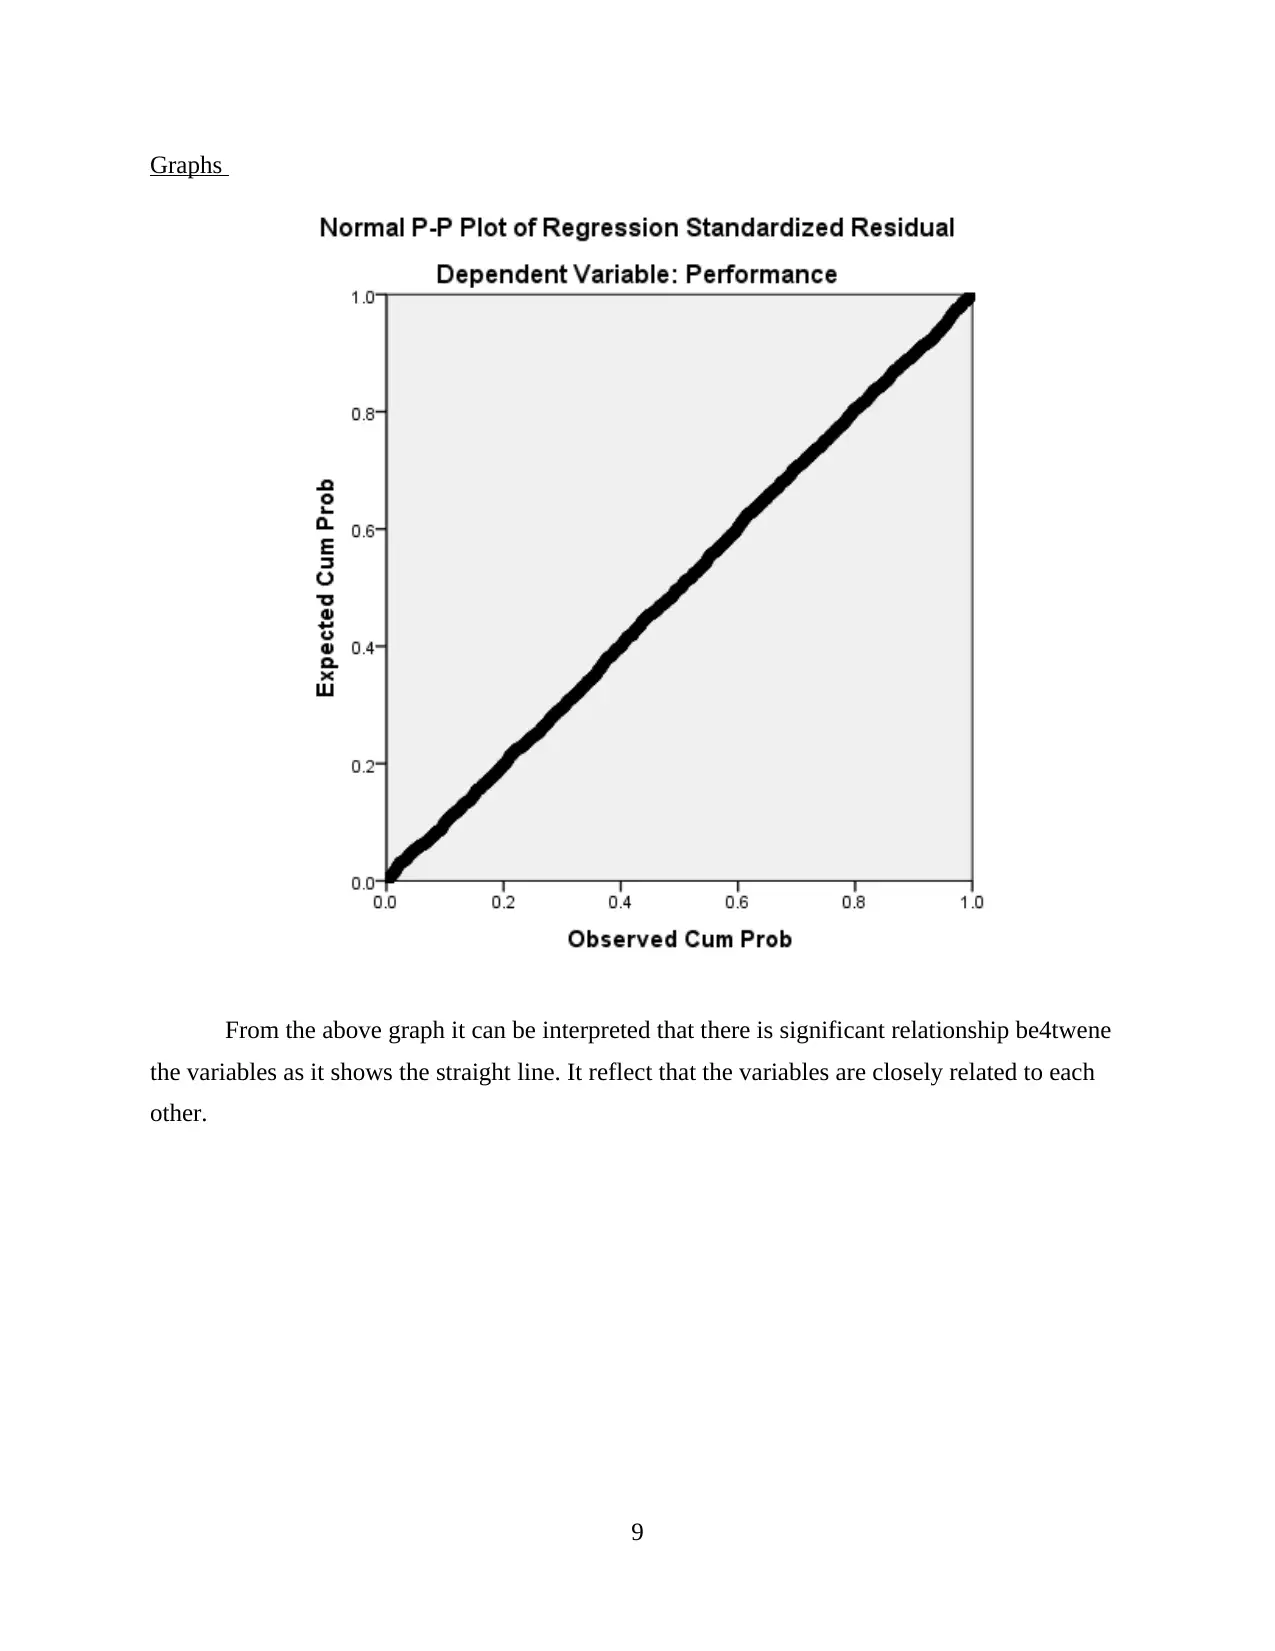
Graphs
From the above graph it can be interpreted that there is significant relationship be4twene
the variables as it shows the straight line. It reflect that the variables are closely related to each
other.
9
From the above graph it can be interpreted that there is significant relationship be4twene
the variables as it shows the straight line. It reflect that the variables are closely related to each
other.
9
10
⊘ This is a preview!⊘
Do you want full access?
Subscribe today to unlock all pages.
Trusted by 1+ million students worldwide
1 out of 16