University Project: Climate Change and Electricity Demand Analysis
VerifiedAdded on 2020/03/01
|15
|2950
|66
Project
AI Summary
This professional project investigates the impact of climate change on electricity demand and supply. It begins with a research aim to determine electricity forecasts under various weather conditions and sets objectives to identify changes in electricity consumption and the effects of changing weather patterns. The project addresses research questions concerning the relationship between weather and electricity consumption. A literature review explores the topic, differentiating between cooling and heating effects, the non-linearity of energy demand, and the techniques used for forecasting electricity demands. The project outlines a research plan, including data sources and a timeline for completion. It proposes an interpretivism research philosophy, deductive approach, and descriptive purpose, utilizing qualitative data analysis of secondary data from electricity distribution companies and government websites. The analysis aims to forecast electricity consumption based on weather and climate data.
Running head: PROFESSIONAL PROJECT
Impact of climate change on electricity demand and supply
Name of the student
Name of the University
Author Note
Impact of climate change on electricity demand and supply
Name of the student
Name of the University
Author Note
Secure Best Marks with AI Grader
Need help grading? Try our AI Grader for instant feedback on your assignments.
1PROFESSIONAL PROJECT
Table of Contents
1.0 Research Aim.............................................................................................................................2
2.0 Research objectives...................................................................................................................2
3.0 Research Questions....................................................................................................................2
4.0 Short literature review...............................................................................................................2
4.1 Cooling versus Heating..........................................................................................................5
4.2 Non-linearity of the energy demand - temperature relationship............................................5
4.3 Techniques for forecasting the electricity demands..............................................................8
5.0 Research plan...........................................................................................................................11
6.0 Proposed method of analysis...................................................................................................11
7.0 Reference List..........................................................................................................................13
2PROFESSIONAL PROJECT
1.0 Research Aim
This research thus aims to determine the electricity forecast and the demand of electricity
in different weather condition.
2.0 Research objectives
To find out the change in electricity consumption depending on the changing weather
To identify the impact of the changing weather on the electricity consumption
To recommend some effective strategies for accurate electricity forecasting
3.0 Research Questions
What is the change in electricity consumption depending on the changing weather?
What are the impacts of the changing weather on the electricity consumption?
4.0 Short literature review
Introduction
The prime objective of the research is to evaluate the impact of climate change on
electricity demand and supply. Gans et al. (2013) stated that in the demand of the electricity is
measured through the units of consumption by the people of a nation. In this literature review,
proper data and research previously made on the similar research topic is highlighted. The
following session shows that in which season the electricity consumption or the demand of the
electricity is high. The process used for forecasting the material is also discussed in the following
literature.
3PROFESSIONAL PROJECT
Literature review
However, the process of measuring the demands changed from conventional time to the
contemporary period. In conventional time, electricity feedback is taken for analyzing the
demand of the electricity. Electricity feedback was carried out mostly by psychologists and
questionnaire containing set of questions is given to the consumers based on which the
evaluation of the electricity consumption is evaluated (Auffhammer & Mansur, 2014). Son and
Kim (2017) depicted that direct and indirect feedback method is used, where assigned electricity
staffs did self-meter-reading, assessing unit numbers in direct displays, keypad meters, meter
reading in presence of energy adviser. On the other hand, in the process of indirect feedback, raw
data processed by the utility and sent out to customers is taken into consideration. These
feedbacks comprises of the data of high among of electricity by the nation’s consumers,
electricity readings along with historical feedback, detailed annual or quarterly energy reports
and disaggregated feedbacks (Moshovel et al., 2015).
It is said that electricity use varies with the weather as depending on the weather and
humidity the demand for the less or more electricity consumption depends. There are majorly
three sectors that consume electricity- residential, commercial and industrial (Eia.gov., 2017).
Secure Best Marks with AI Grader
Need help grading? Try our AI Grader for instant feedback on your assignments.
4PROFESSIONAL PROJECT
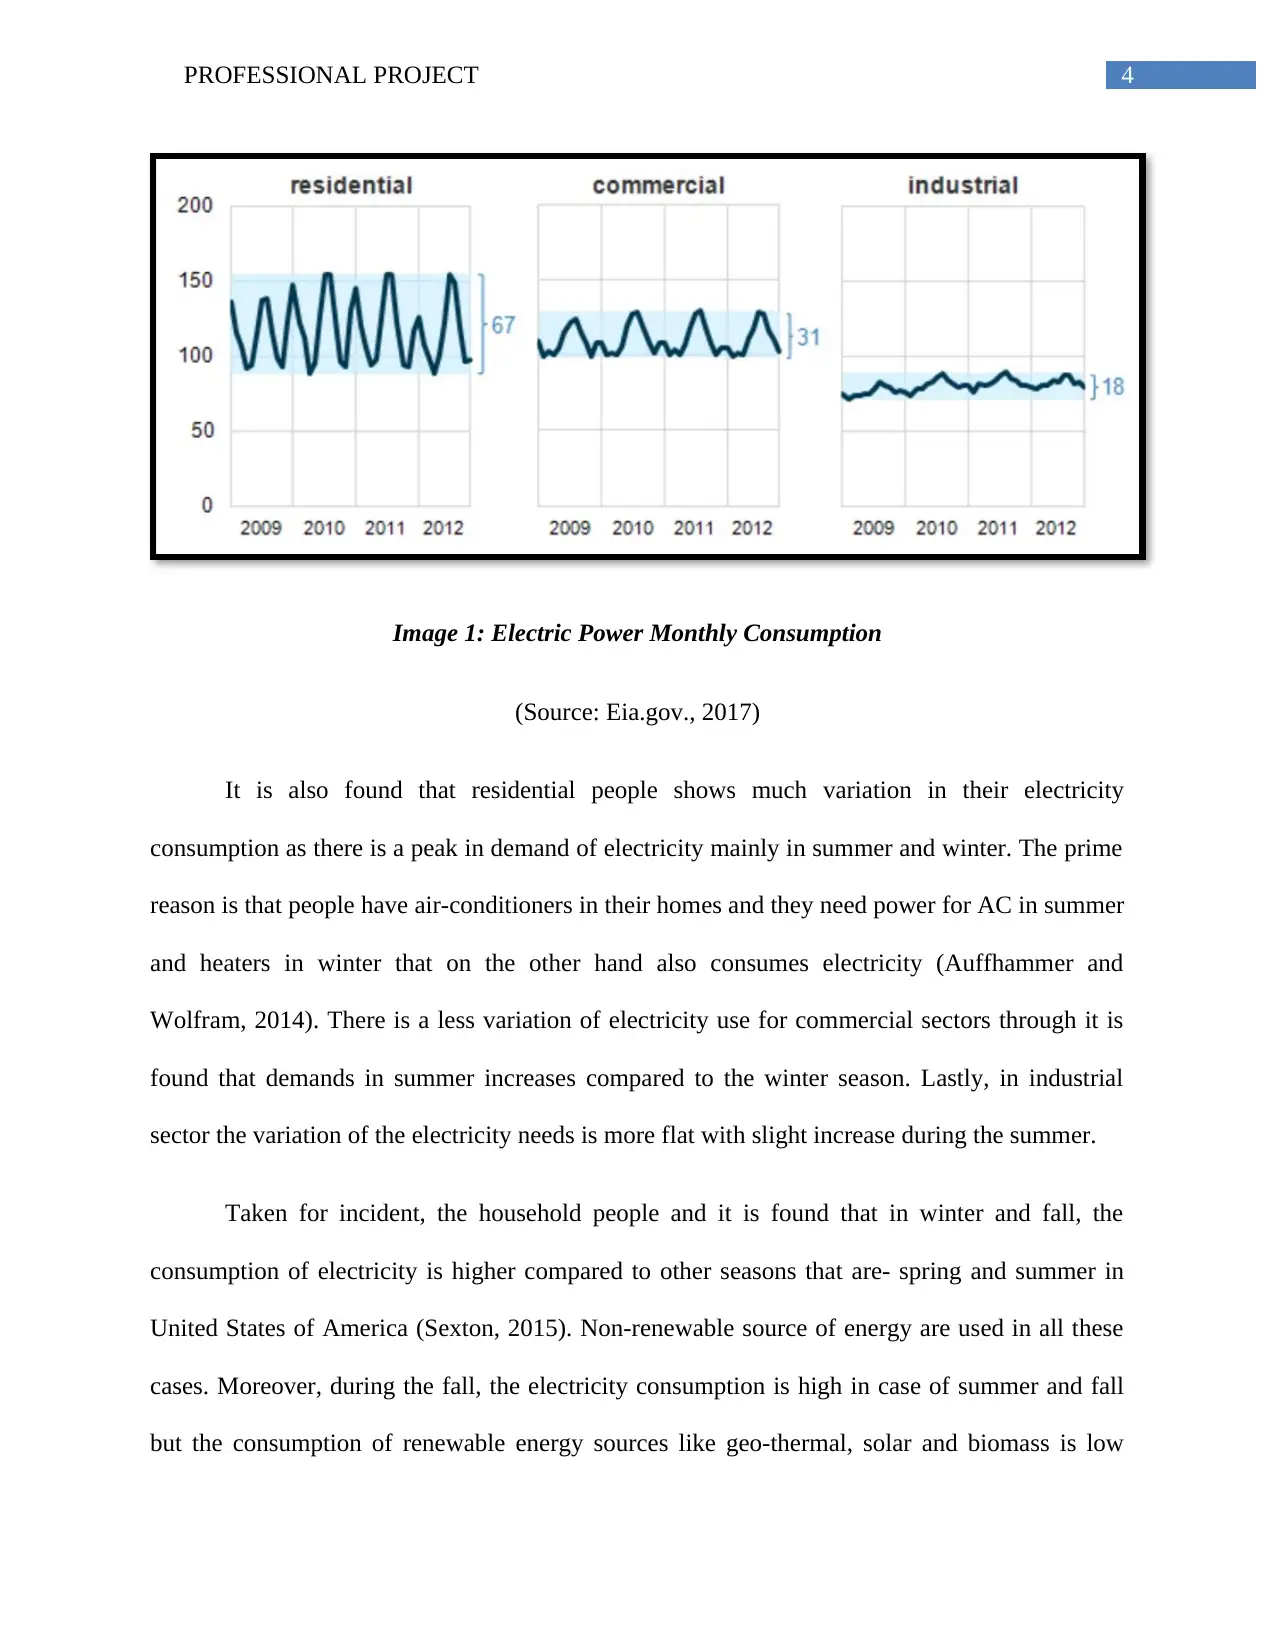
Image 1: Electric Power Monthly Consumption
(Source: Eia.gov., 2017)
It is also found that residential people shows much variation in their electricity
consumption as there is a peak in demand of electricity mainly in summer and winter. The prime
reason is that people have air-conditioners in their homes and they need power for AC in summer
and heaters in winter that on the other hand also consumes electricity (Auffhammer and
Wolfram, 2014). There is a less variation of electricity use for commercial sectors through it is
found that demands in summer increases compared to the winter season. Lastly, in industrial
sector the variation of the electricity needs is more flat with slight increase during the summer.
Taken for incident, the household people and it is found that in winter and fall, the
consumption of electricity is higher compared to other seasons that are- spring and summer in
United States of America (Sexton, 2015). Non-renewable source of energy are used in all these
cases. Moreover, during the fall, the electricity consumption is high in case of summer and fall
but the consumption of renewable energy sources like geo-thermal, solar and biomass is low
5PROFESSIONAL PROJECT
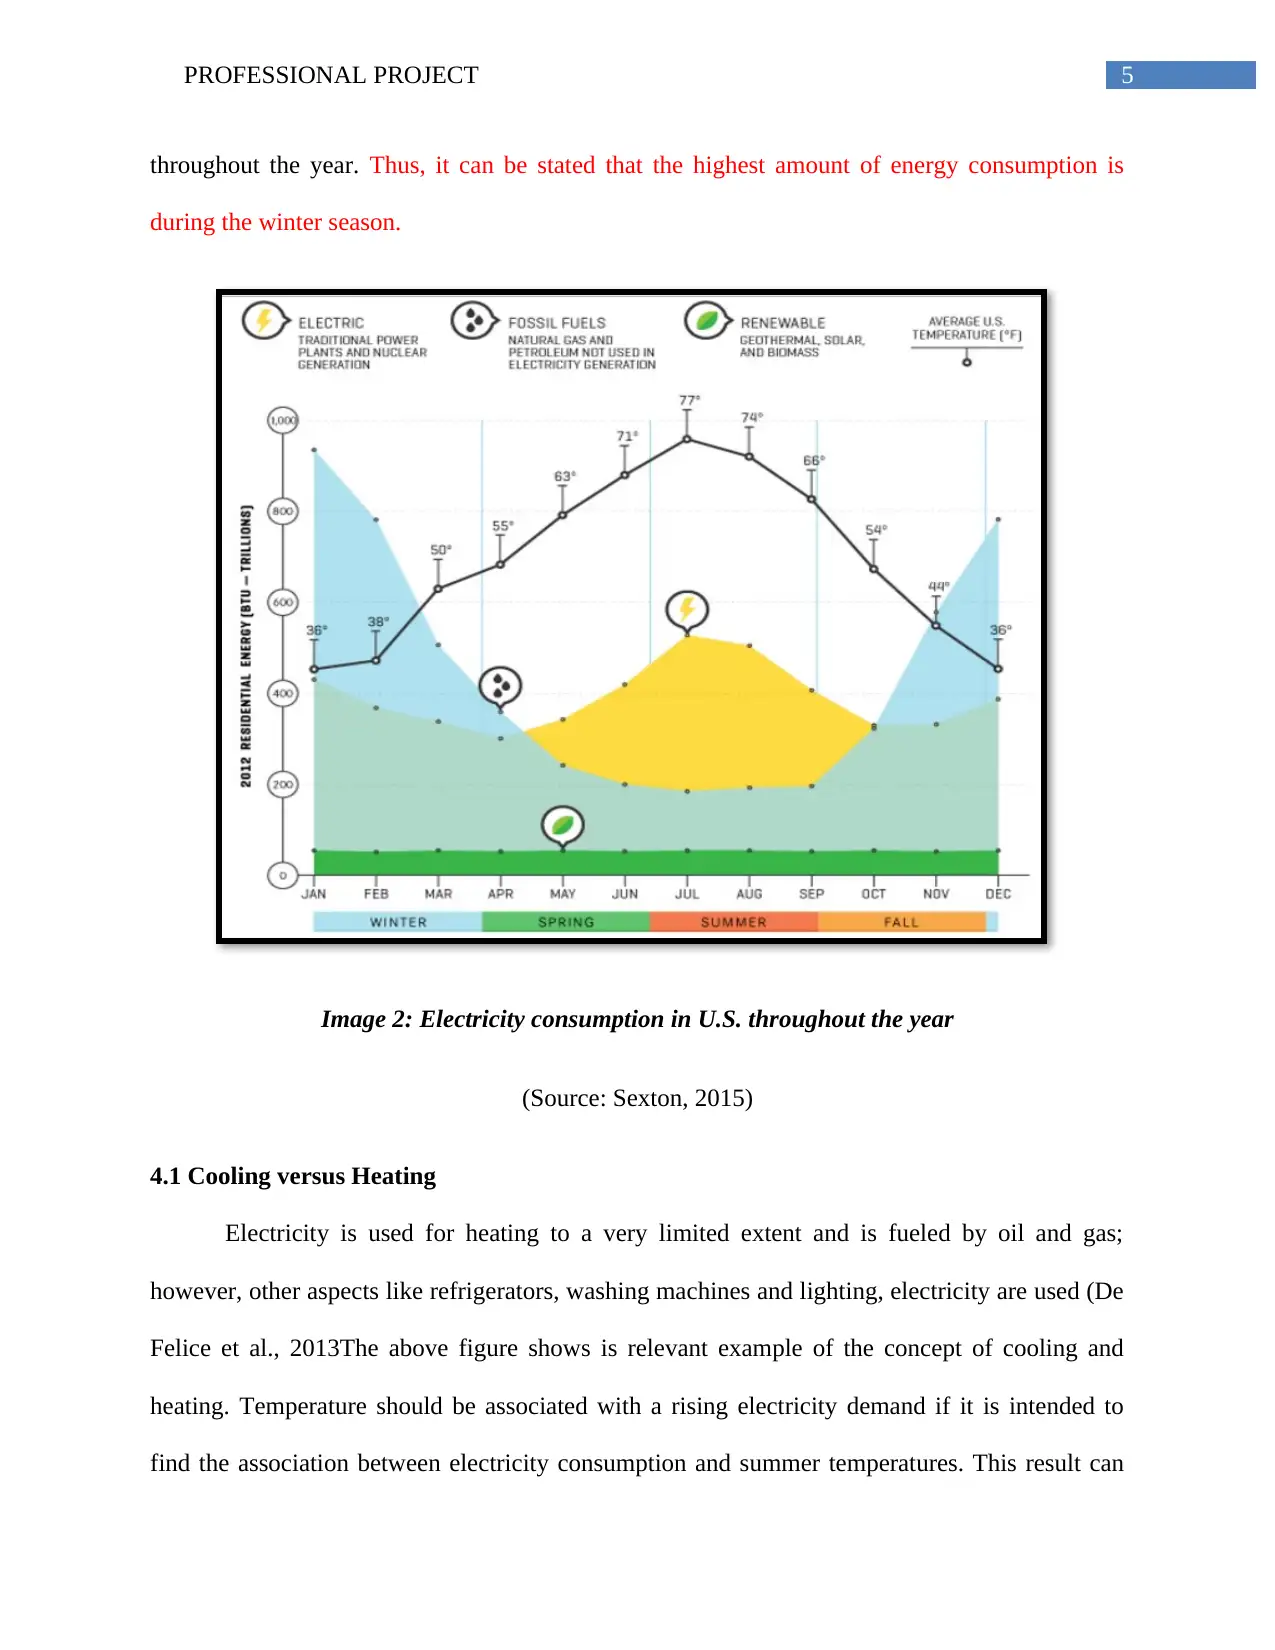
throughout the year. Thus, it can be stated that the highest amount of energy consumption is
during the winter season.
Image 2: Electricity consumption in U.S. throughout the year
(Source: Sexton, 2015)
4.1 Cooling versus Heating
Electricity is used for heating to a very limited extent and is fueled by oil and gas;
however, other aspects like refrigerators, washing machines and lighting, electricity are used (De
Felice et al., 2013The above figure shows is relevant example of the concept of cooling and
heating. Temperature should be associated with a rising electricity demand if it is intended to
find the association between electricity consumption and summer temperatures. This result can
6PROFESSIONAL PROJECT
be better understood in nations with higher base temperatures. The primary reason for this aspect
is that climate discomfort should be convex in temperature levels and the process if known as
cooling effect. On the other hand, the reduction in fuel consumption for heating purposes is
known as heating process. It is also said by Dahl et al. (2017) that higher temperatures in spring
and fall having more impact compared with the winter season. Moreover, gas and oil products
are used for heating and thus it is expected that demands for these energy needs does not possess
a positive relationship with average temperature levels (Da Silva et al., 2014). Thus, it can be
said that the impact of the temperature of climate on the gas and oil products demands can be
predicted but there is an increase in energy demand when the temperature is very low and when
the temperature is very high.
4.2 Non-linearity of the energy demand - temperature relationship
It is mentioned earlier that energy demand may have affect in a non-linear way. De Felice
et al. (2015) stated in the research work that the non-linearity may arise due to the different usage
of different fuels, geographical differences and seasonal variations. Important variables that can
be considered that address the research aims and objectives are- seasonal temperatures and cold-
and-hot country. Bossavy et al. (2013) portrays the evidence of the importance of geographic
variability as cooling and heating effect are felt in hot and colder regions respectively. In
addition to that, cooling should occur during the summer, whereas heating depends on the
duration of the cold season. Another aspect that can be considered is that temperature increases
at the beginning and at the end of the cold season and thus, due to this season change, people
avoid using heating systems.
Paraphrase This Document
Need a fresh take? Get an instant paraphrase of this document with our AI Paraphraser
7PROFESSIONAL PROJECT
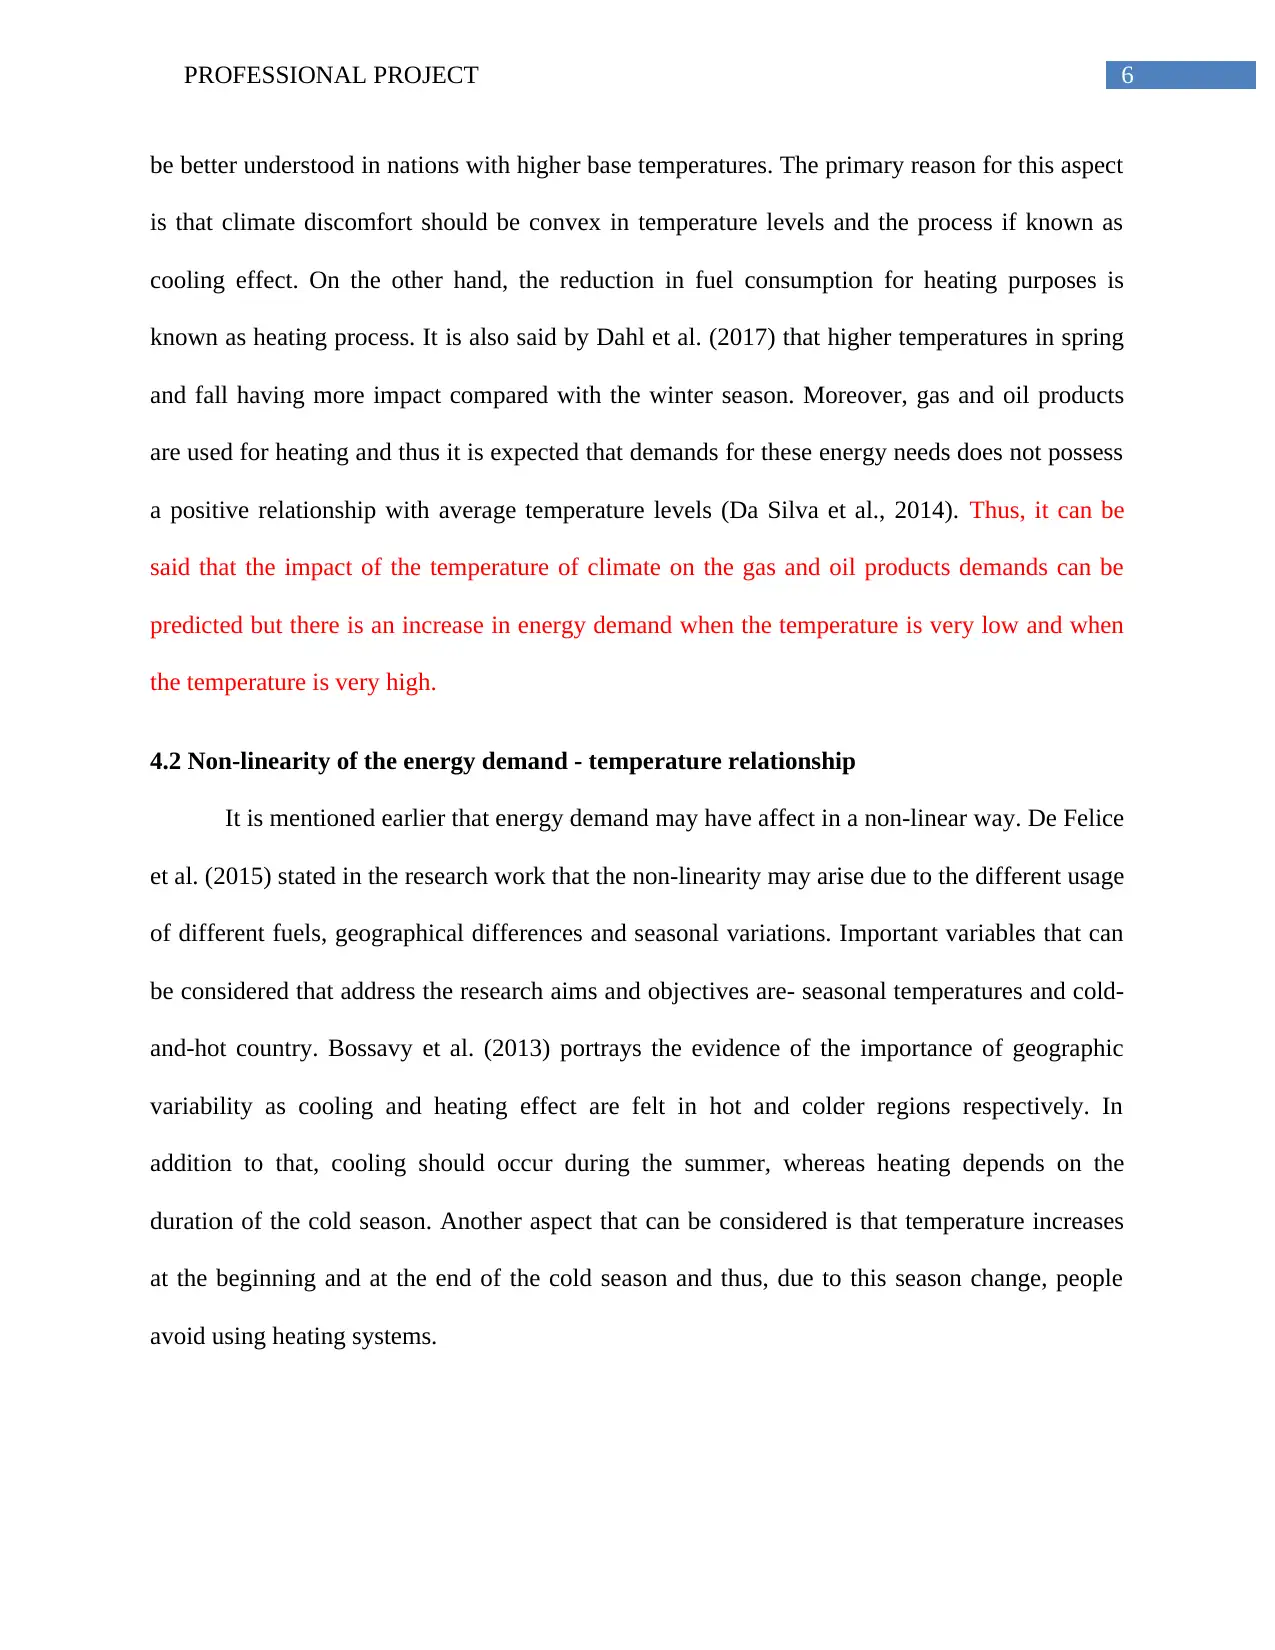
Image 3: Relationships between Energy Demand and Temperature Levels
(Source: Bossavy et al., 2013)
Furthermore, if the research can be made in-depth to the hours in a day for every season,
different graphs have been obtained. However, in the cases, it has been found that at midnight
the consumption of the electricity is low compared to other hours of the day. It is found that in
winter season, the energy consumption is lower people do not use any electricity gadgets but
during the day time, the consumption of electricity due to the use of other appliances like
refrigerators, television, music systems are high (Hong et al., 2014). The electricity demand in
the winter is high in Québec and thus government in such nations helps them to limit the spike in
demand.
8PROFESSIONAL PROJECT
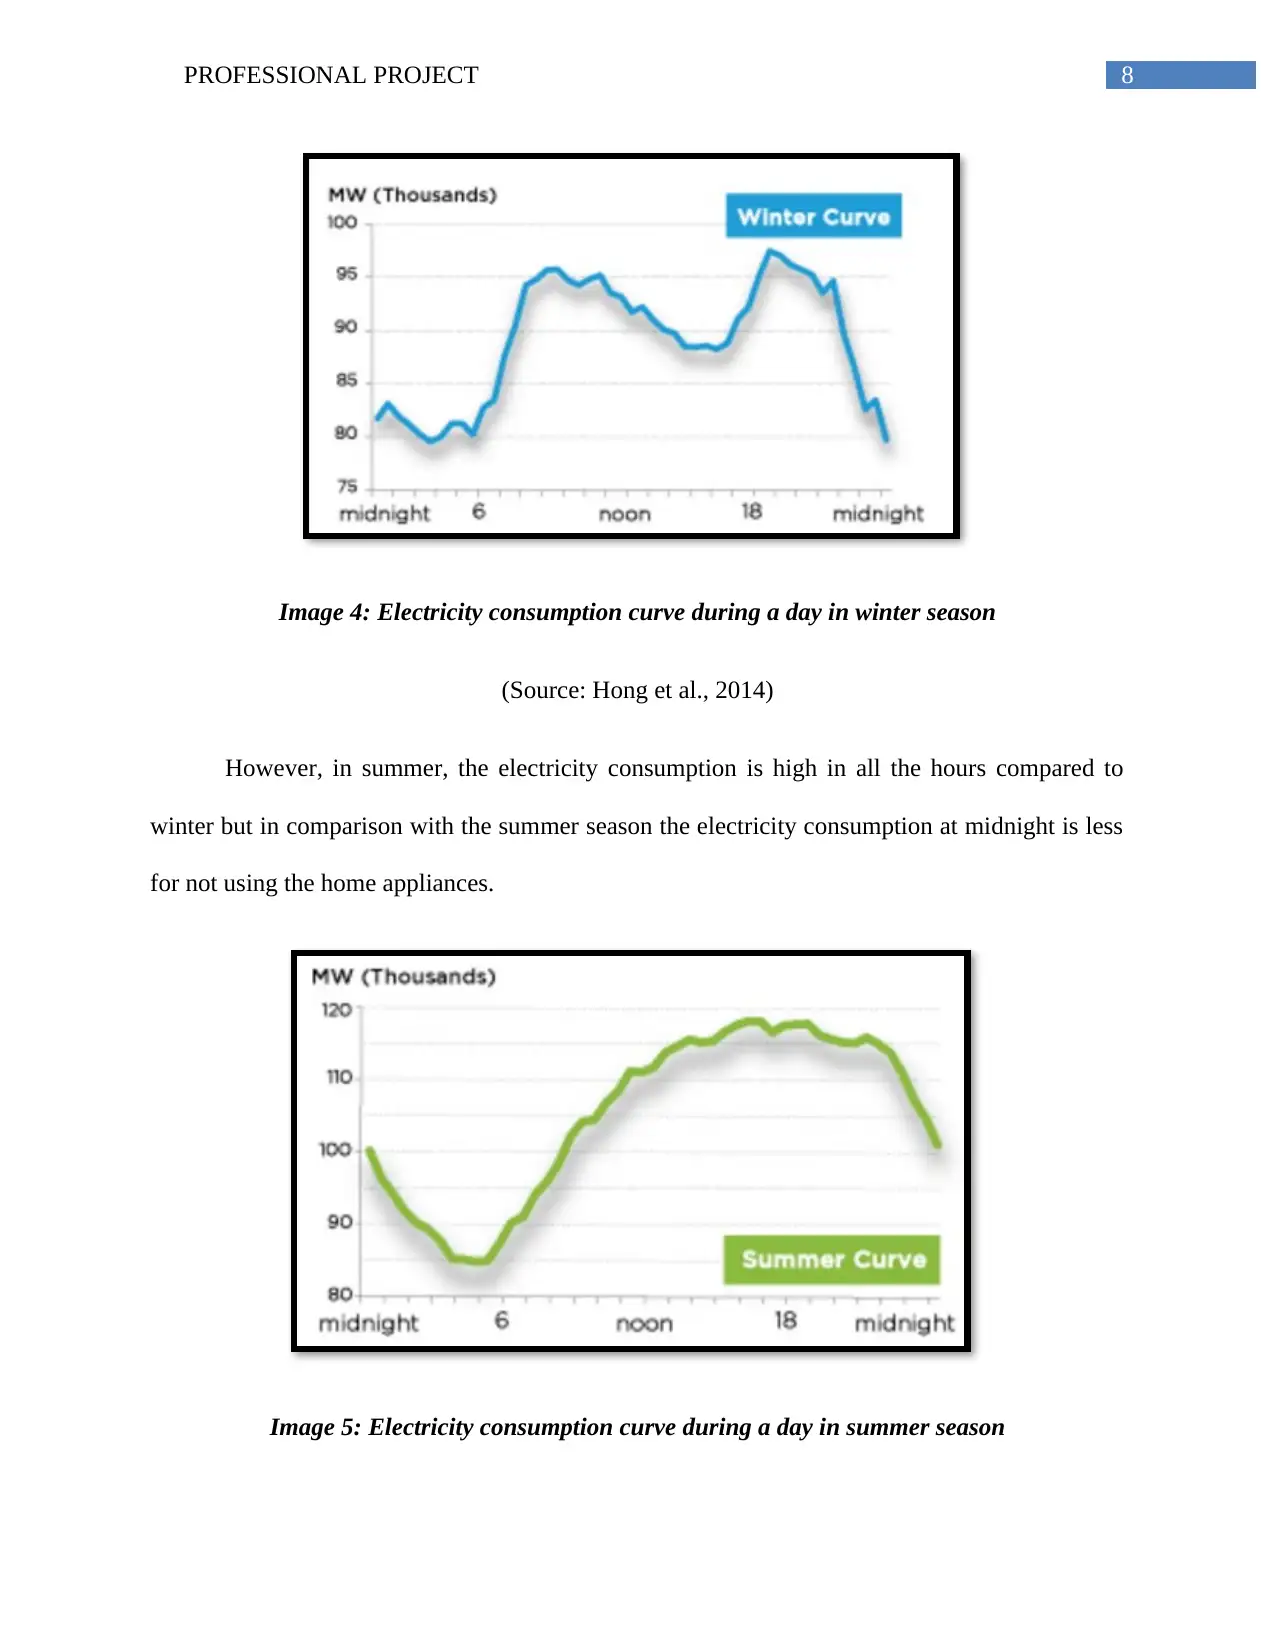
Image 4: Electricity consumption curve during a day in winter season
(Source: Hong et al., 2014)
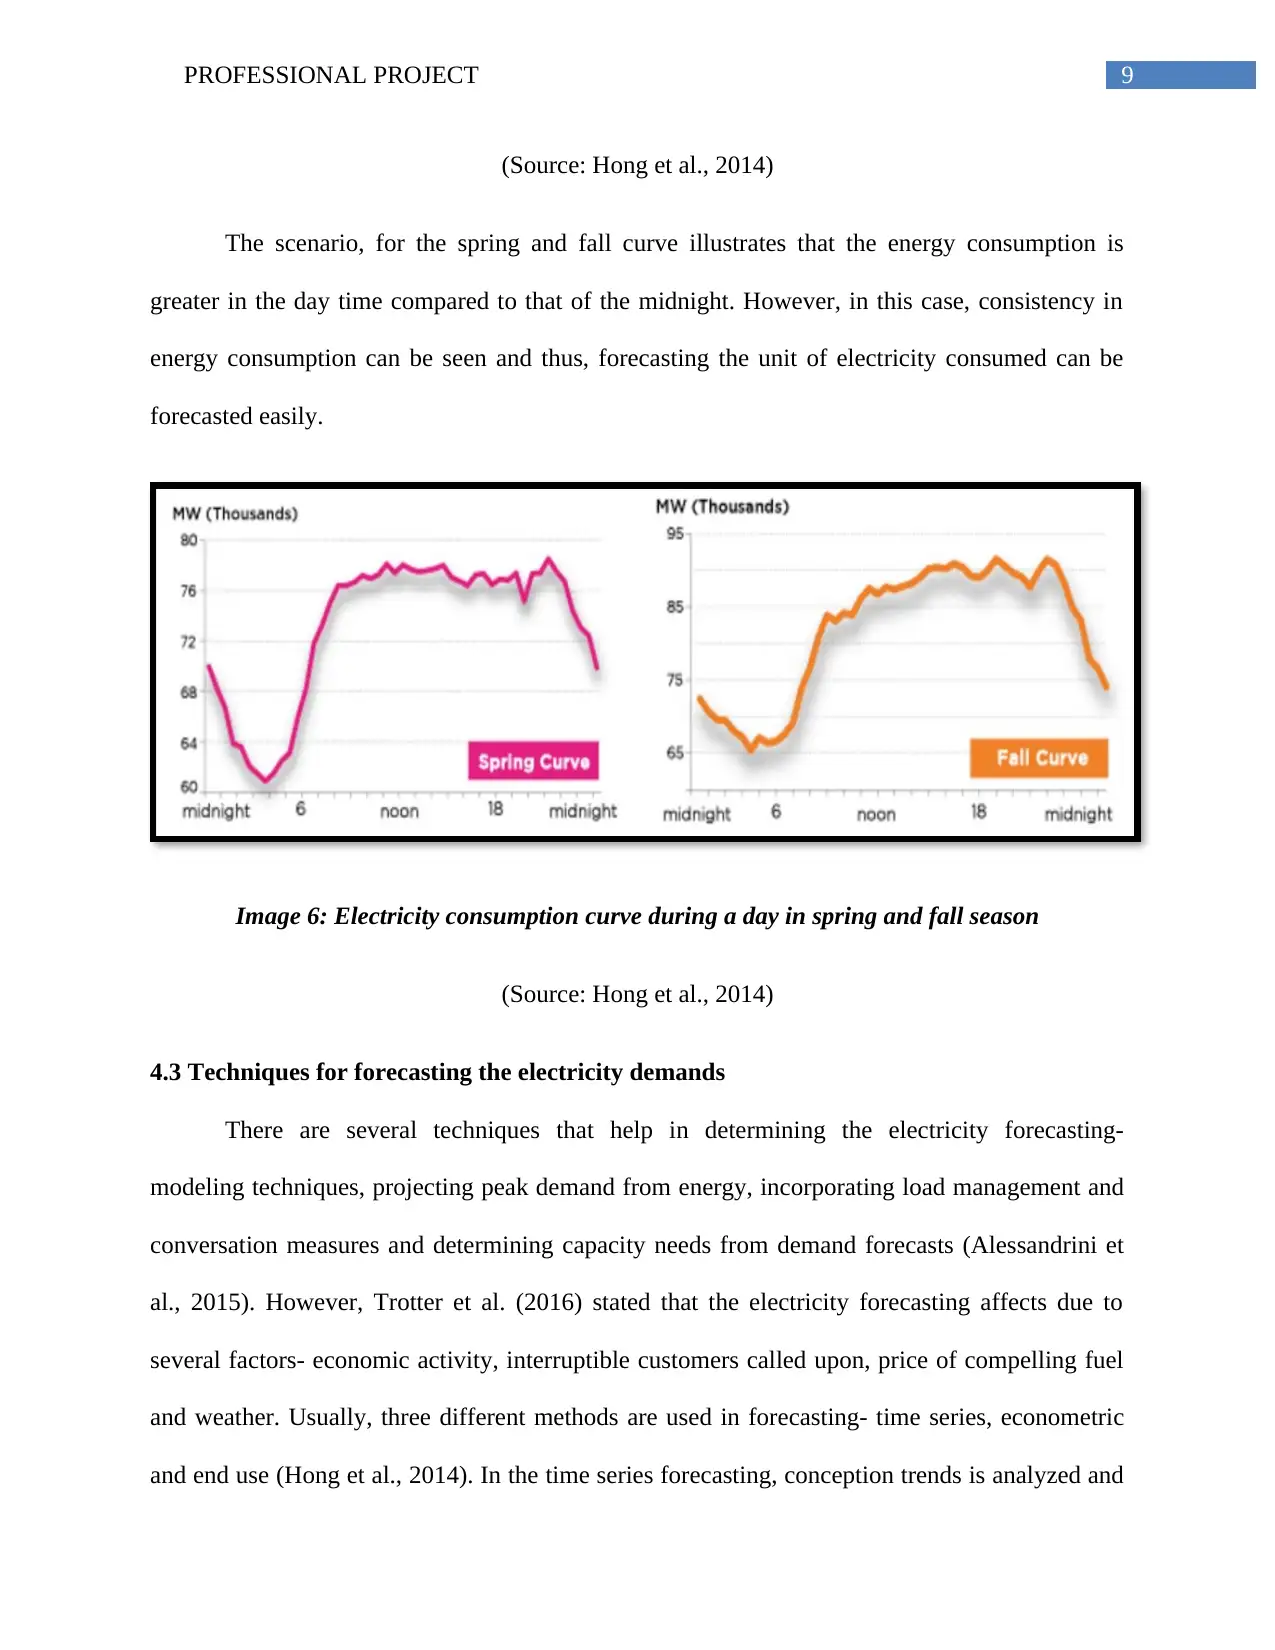
However, in summer, the electricity consumption is high in all the hours compared to
winter but in comparison with the summer season the electricity consumption at midnight is less
for not using the home appliances.
Image 5: Electricity consumption curve during a day in summer season
Image 4: Electricity consumption curve during a day in winter season
(Source: Hong et al., 2014)
However, in summer, the electricity consumption is high in all the hours compared to
winter but in comparison with the summer season the electricity consumption at midnight is less
for not using the home appliances.
Image 5: Electricity consumption curve during a day in summer season
9PROFESSIONAL PROJECT
(Source: Hong et al., 2014)
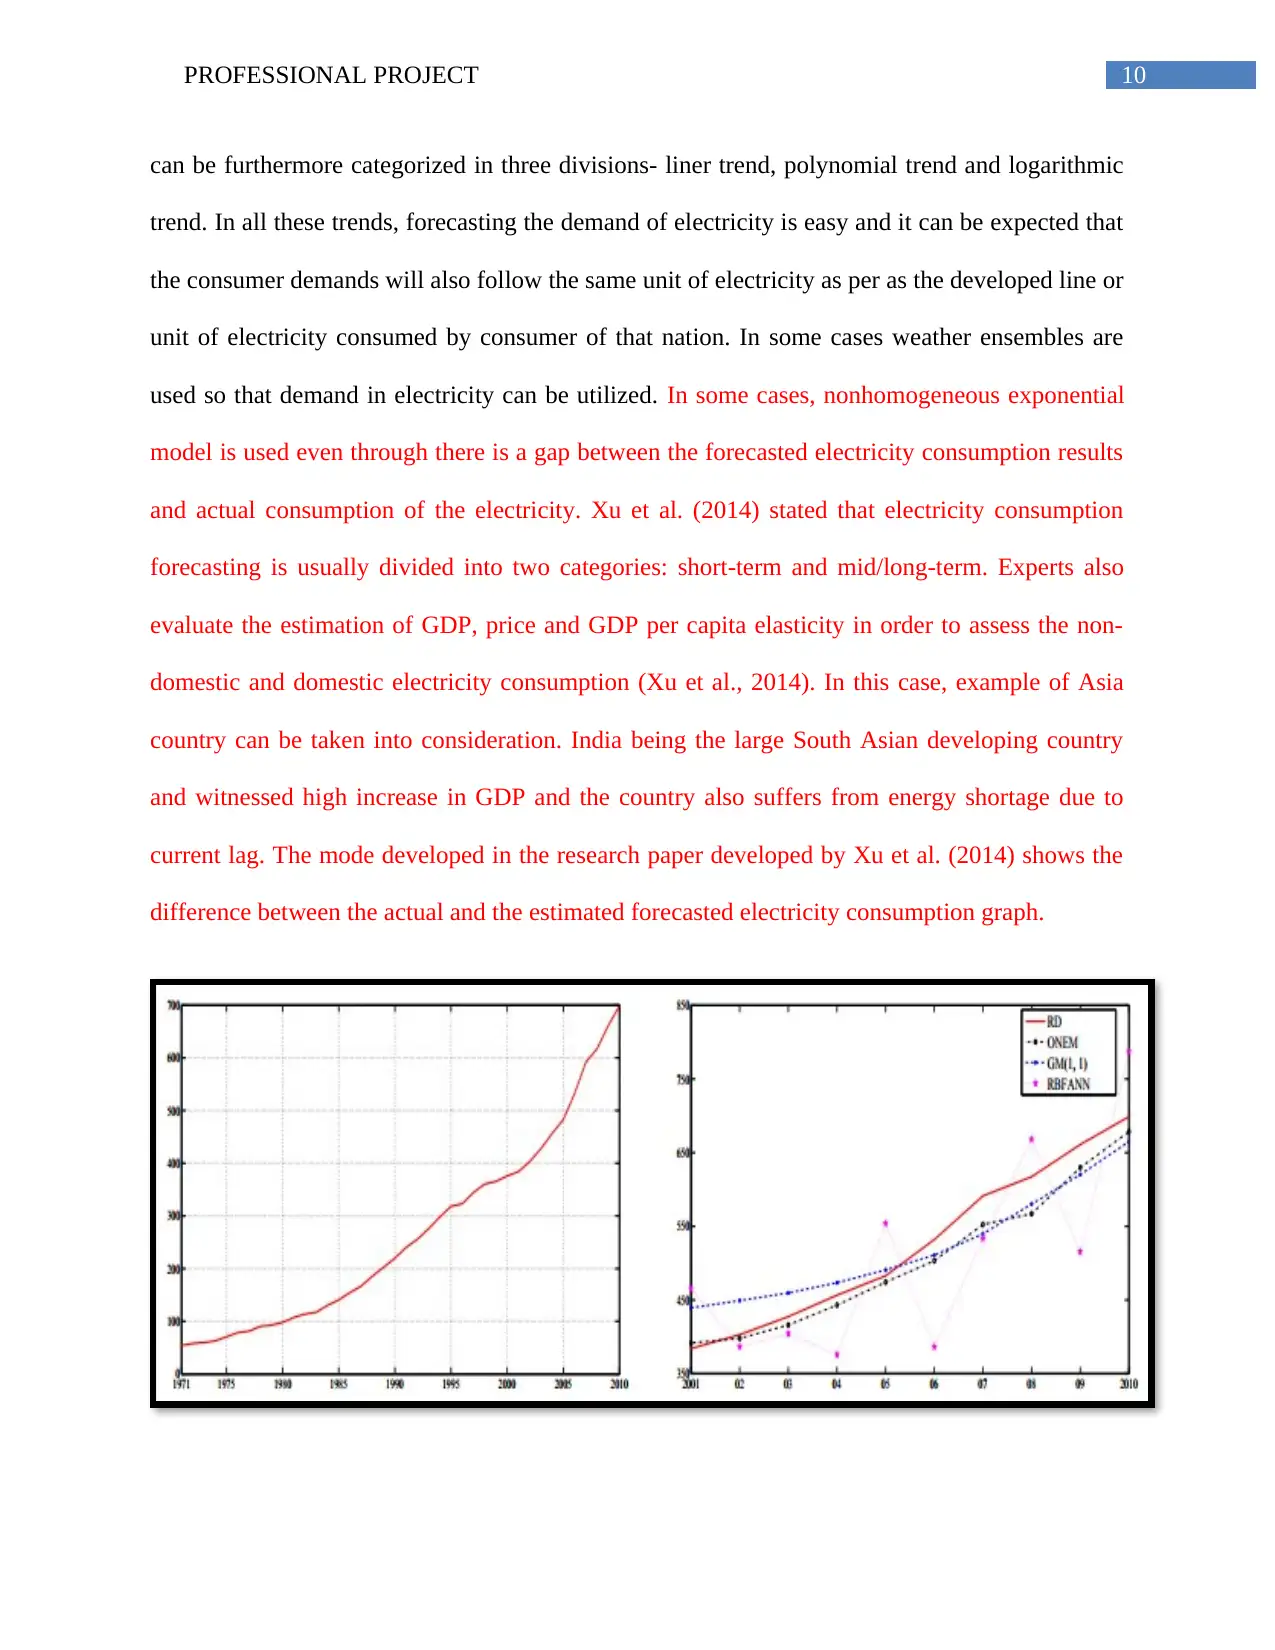
The scenario, for the spring and fall curve illustrates that the energy consumption is
greater in the day time compared to that of the midnight. However, in this case, consistency in
energy consumption can be seen and thus, forecasting the unit of electricity consumed can be
forecasted easily.
Image 6: Electricity consumption curve during a day in spring and fall season
(Source: Hong et al., 2014)
4.3 Techniques for forecasting the electricity demands
There are several techniques that help in determining the electricity forecasting-
modeling techniques, projecting peak demand from energy, incorporating load management and
conversation measures and determining capacity needs from demand forecasts (Alessandrini et
al., 2015). However, Trotter et al. (2016) stated that the electricity forecasting affects due to
several factors- economic activity, interruptible customers called upon, price of compelling fuel
and weather. Usually, three different methods are used in forecasting- time series, econometric
and end use (Hong et al., 2014). In the time series forecasting, conception trends is analyzed and
(Source: Hong et al., 2014)
The scenario, for the spring and fall curve illustrates that the energy consumption is
greater in the day time compared to that of the midnight. However, in this case, consistency in
energy consumption can be seen and thus, forecasting the unit of electricity consumed can be
forecasted easily.
Image 6: Electricity consumption curve during a day in spring and fall season
(Source: Hong et al., 2014)
4.3 Techniques for forecasting the electricity demands
There are several techniques that help in determining the electricity forecasting-
modeling techniques, projecting peak demand from energy, incorporating load management and
conversation measures and determining capacity needs from demand forecasts (Alessandrini et
al., 2015). However, Trotter et al. (2016) stated that the electricity forecasting affects due to
several factors- economic activity, interruptible customers called upon, price of compelling fuel
and weather. Usually, three different methods are used in forecasting- time series, econometric
and end use (Hong et al., 2014). In the time series forecasting, conception trends is analyzed and
Secure Best Marks with AI Grader
Need help grading? Try our AI Grader for instant feedback on your assignments.
10PROFESSIONAL PROJECT
can be furthermore categorized in three divisions- liner trend, polynomial trend and logarithmic
trend. In all these trends, forecasting the demand of electricity is easy and it can be expected that
the consumer demands will also follow the same unit of electricity as per as the developed line or
unit of electricity consumed by consumer of that nation. In some cases weather ensembles are
used so that demand in electricity can be utilized. In some cases, nonhomogeneous exponential
model is used even through there is a gap between the forecasted electricity consumption results
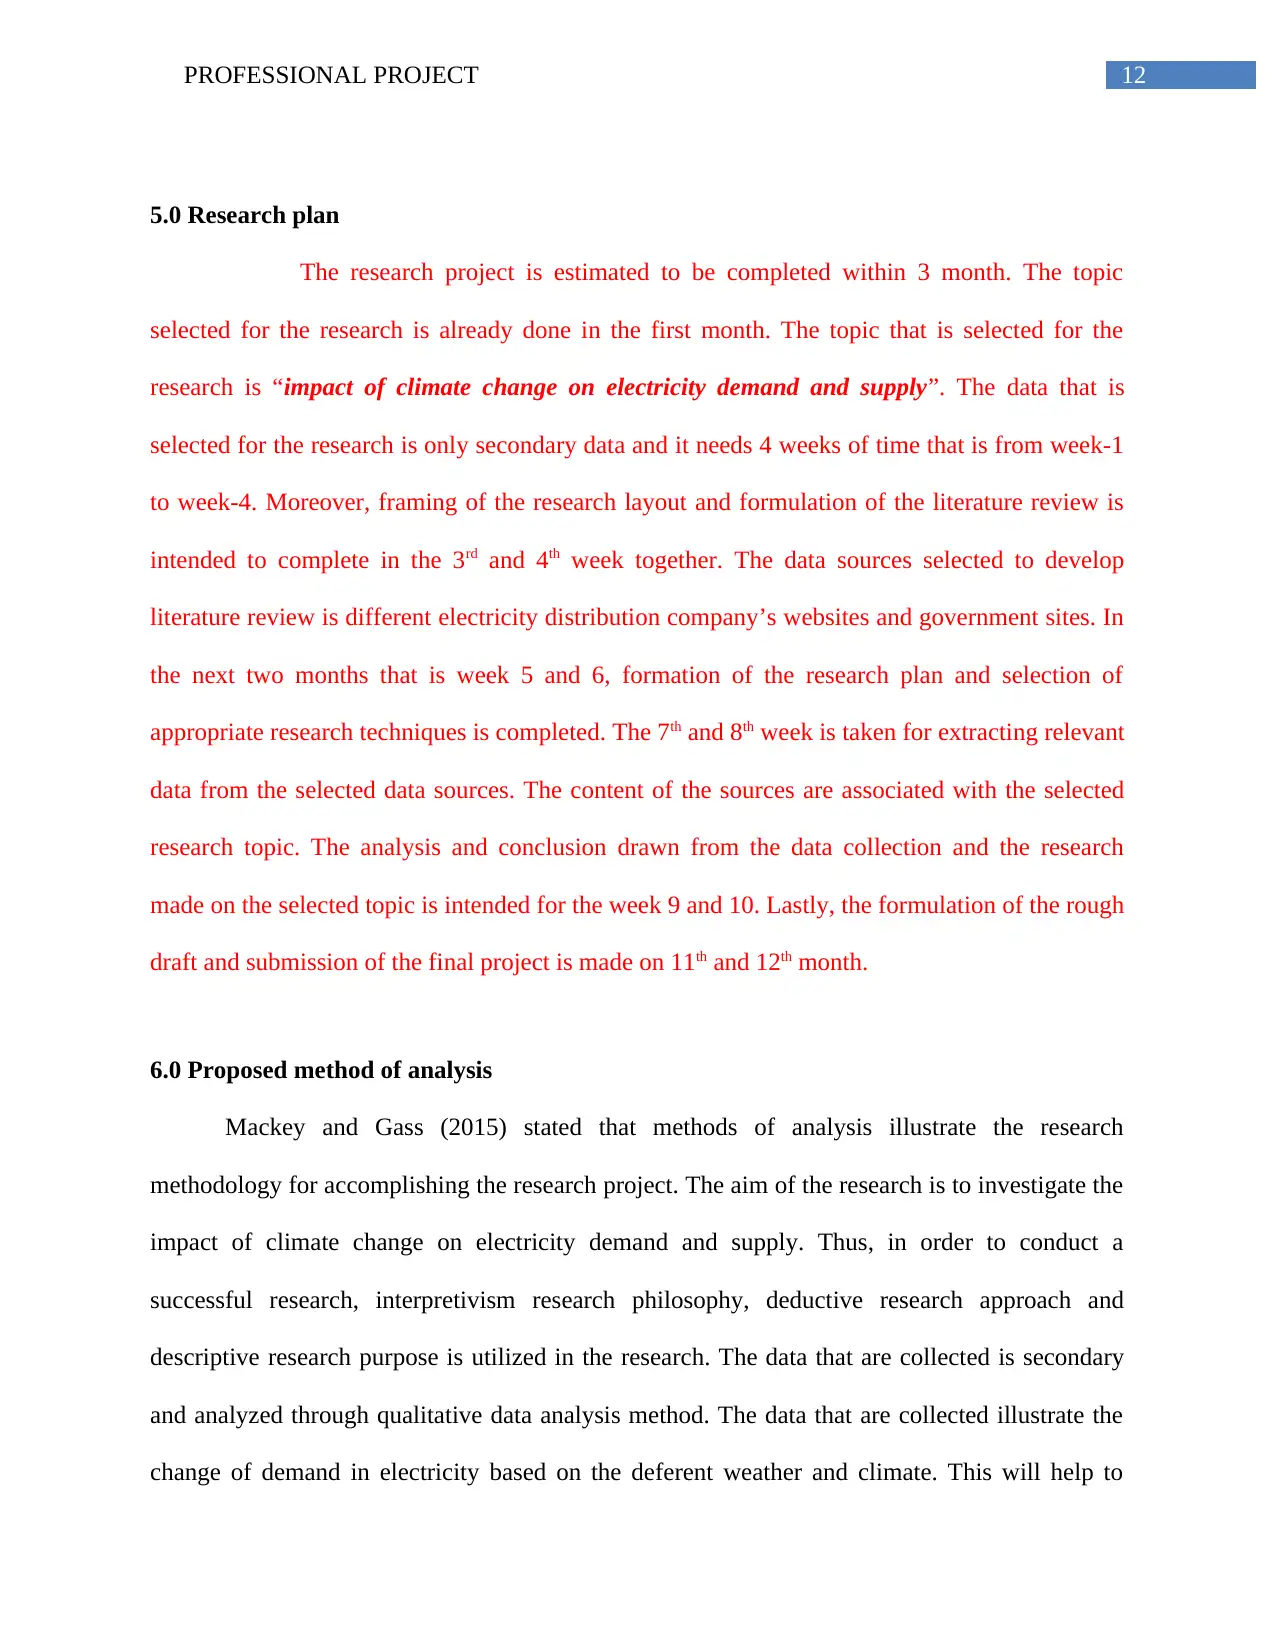
and actual consumption of the electricity. Xu et al. (2014) stated that electricity consumption
forecasting is usually divided into two categories: short-term and mid/long-term. Experts also
evaluate the estimation of GDP, price and GDP per capita elasticity in order to assess the non-
domestic and domestic electricity consumption (Xu et al., 2014). In this case, example of Asia
country can be taken into consideration. India being the large South Asian developing country
and witnessed high increase in GDP and the country also suffers from energy shortage due to
current lag. The mode developed in the research paper developed by Xu et al. (2014) shows the
difference between the actual and the estimated forecasted electricity consumption graph.
can be furthermore categorized in three divisions- liner trend, polynomial trend and logarithmic
trend. In all these trends, forecasting the demand of electricity is easy and it can be expected that
the consumer demands will also follow the same unit of electricity as per as the developed line or
unit of electricity consumed by consumer of that nation. In some cases weather ensembles are
used so that demand in electricity can be utilized. In some cases, nonhomogeneous exponential
model is used even through there is a gap between the forecasted electricity consumption results
and actual consumption of the electricity. Xu et al. (2014) stated that electricity consumption
forecasting is usually divided into two categories: short-term and mid/long-term. Experts also
evaluate the estimation of GDP, price and GDP per capita elasticity in order to assess the non-
domestic and domestic electricity consumption (Xu et al., 2014). In this case, example of Asia
country can be taken into consideration. India being the large South Asian developing country
and witnessed high increase in GDP and the country also suffers from energy shortage due to
current lag. The mode developed in the research paper developed by Xu et al. (2014) shows the
difference between the actual and the estimated forecasted electricity consumption graph.

11PROFESSIONAL PROJECT
Image 7: India’s electricity consumption curve and respective comparison among different
forecasting results
(Source: Xu et al., 2014)
Image 7: India’s electricity consumption curve and respective comparison among different
forecasting results
(Source: Xu et al., 2014)
12PROFESSIONAL PROJECT
5.0 Research plan
The research project is estimated to be completed within 3 month. The topic
selected for the research is already done in the first month. The topic that is selected for the
research is “impact of climate change on electricity demand and supply”. The data that is
selected for the research is only secondary data and it needs 4 weeks of time that is from week-1
to week-4. Moreover, framing of the research layout and formulation of the literature review is
intended to complete in the 3rd and 4th week together. The data sources selected to develop
literature review is different electricity distribution company’s websites and government sites. In
the next two months that is week 5 and 6, formation of the research plan and selection of
appropriate research techniques is completed. The 7th and 8th week is taken for extracting relevant
data from the selected data sources. The content of the sources are associated with the selected
research topic. The analysis and conclusion drawn from the data collection and the research
made on the selected topic is intended for the week 9 and 10. Lastly, the formulation of the rough
draft and submission of the final project is made on 11th and 12th month.
6.0 Proposed method of analysis
Mackey and Gass (2015) stated that methods of analysis illustrate the research
methodology for accomplishing the research project. The aim of the research is to investigate the
impact of climate change on electricity demand and supply. Thus, in order to conduct a
successful research, interpretivism research philosophy, deductive research approach and
descriptive research purpose is utilized in the research. The data that are collected is secondary
and analyzed through qualitative data analysis method. The data that are collected illustrate the
change of demand in electricity based on the deferent weather and climate. This will help to
Paraphrase This Document
Need a fresh take? Get an instant paraphrase of this document with our AI Paraphraser

13PROFESSIONAL PROJECT
forecast the electricity consumption of a particular nation. The sources that are selected for data
collection are from websites of electricity distribution companies and government websites. The
data are collected based on the outcome from the secondary research is then aligned with the
research aims and objectives in order to obtain the research outcome.
14PROFESSIONAL PROJECT
7.0 Reference List
Alessandrini, S., Delle Monache, L., Sperati, S., & Cervone, G. (2015). An analog ensemble for
short-term probabilistic solar power forecast. Applied energy, 157, 95-110.
Ang, B. W., Wang, H., & Ma, X. (2017). Climatic influence on electricity consumption: The
case of Singapore and Hong Kong. Energy, 127, 534-543.
Auffhammer, M., & Wolfram, C. D. (2014). Powering up China: Income distributions and
residential electricity consumption. The American Economic Review, 104(5), 575-580.
Auffhammer, M., Hsiang, S. M., Schlenker, W., & Sobel, A. (2013). Using weather data and
climate model output in economic analyses of climate change. Review of Environmental
Economics and Policy, 7(2), 181-198.
Bossavy, A., Girard, R., & Kariniotakis, G. (2013). Forecasting ramps of wind power production
with numerical weather prediction ensembles. Wind Energy, 16(1), 51-63.
Da Silva, P. G., Ilic, D., & Karnouskos, S. (2014). The impact of smart grid prosumer grouping
on forecasting accuracy and its benefits for local electricity market trading. IEEE
Transactions on Smart Grid, 5(1), 402-410.
Dahl, M., Brun, A., & Andresen, G. B. (2017). Using ensemble weather predictions in district
heating operation and load forecasting. Applied Energy, 193, 455-465.
De Felice, M., Alessandri, A., & Ruti, P. M. (2013). Electricity demand forecasting over Italy:
Potential benefits using numerical weather prediction models. Electric Power Systems
Research, 104, 71-79.
Eia.gov. (2017). U.S. Energy Information Administration (EIA). [online] Available at:
https://www.eia.gov/ [Accessed 22 Aug. 2017].
1 out of 15
Related Documents


Your All-in-One AI-Powered Toolkit for Academic Success.
+13062052269
info@desklib.com
Available 24*7 on WhatsApp / Email
![[object Object]](/_next/static/media/star-bottom.7253800d.svg)
Unlock your academic potential
© 2024 | Zucol Services PVT LTD | All rights reserved.