Financial and Business Performance Running Head: Financial and Business Performance Information
This assignment is about providing financial and business performance information. It covers topics such as forms of business ownership, communication needs of different clients, trade credit, and liquidity and activity ratios. The assignment is part of the assessment for the Diploma of Accounting course at TAFE SA.
28 Pages5156 Words143 Views
Added on 2022-10-14
About This Document
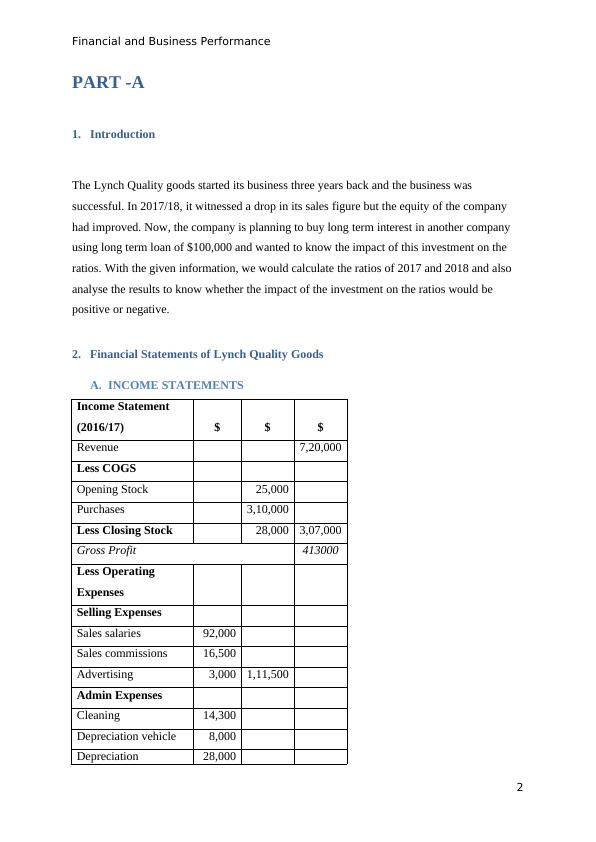
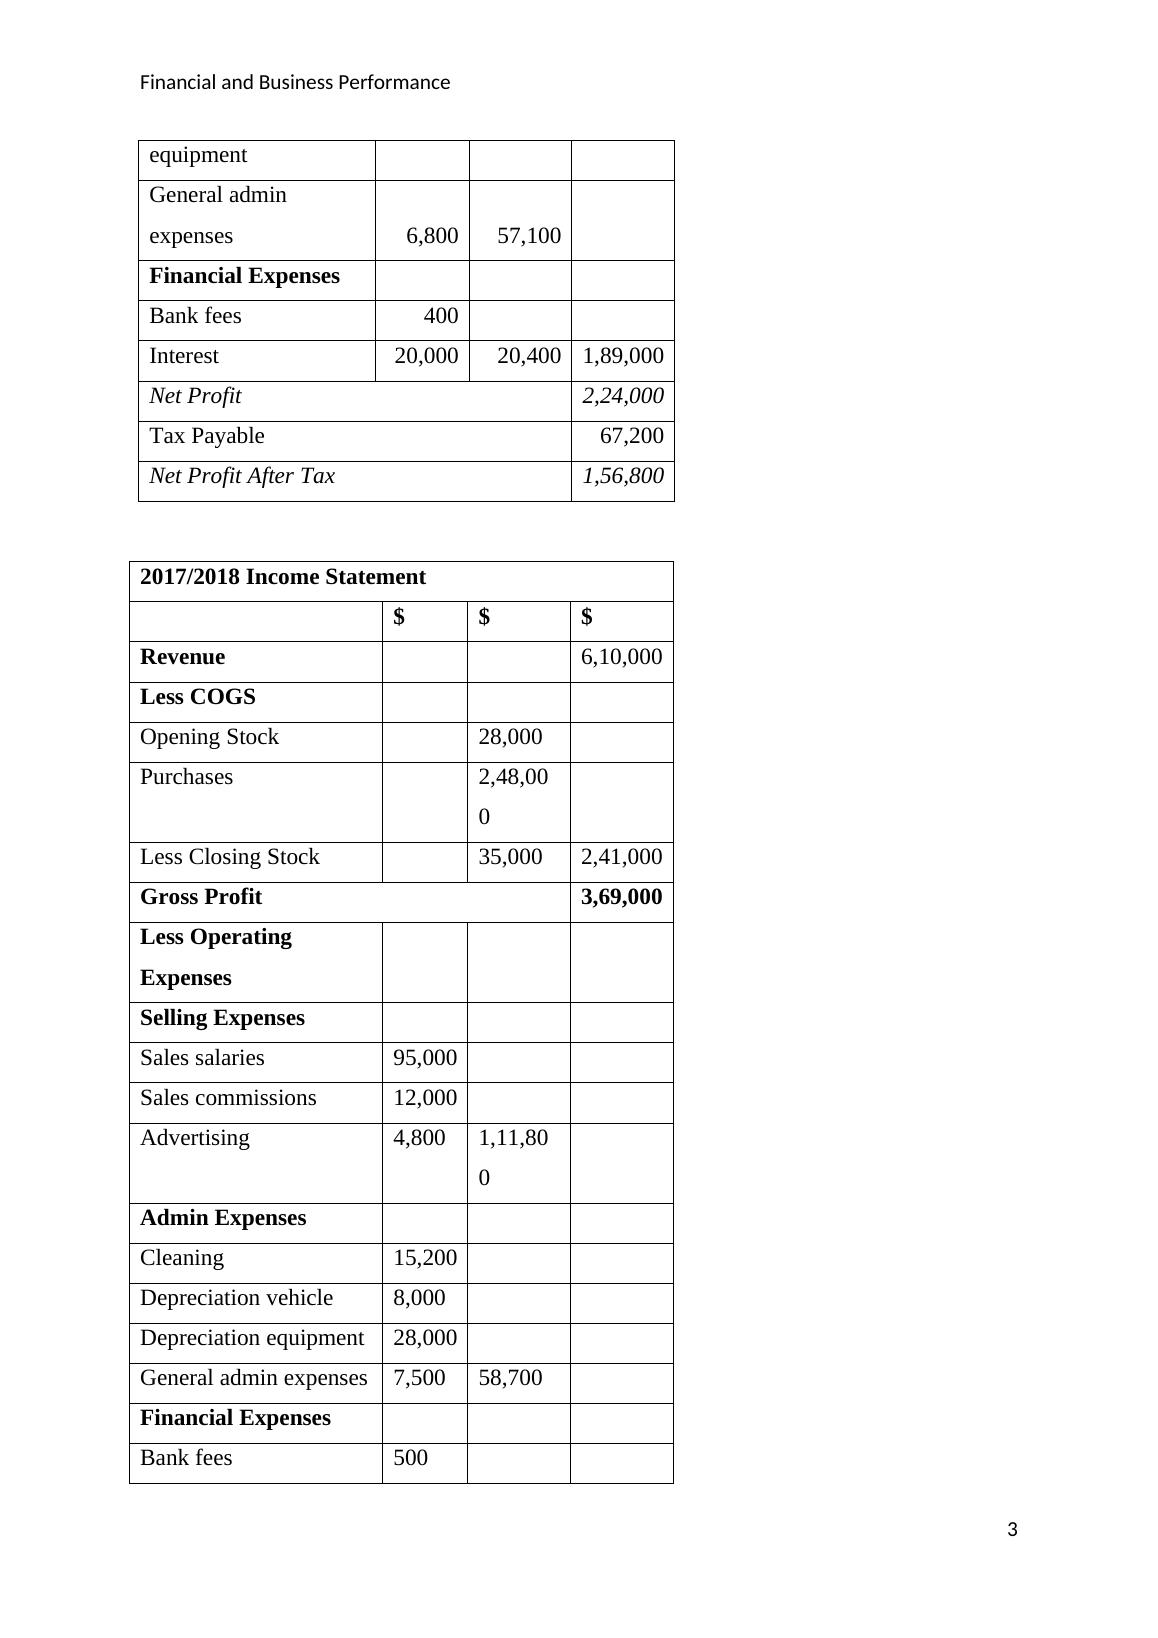
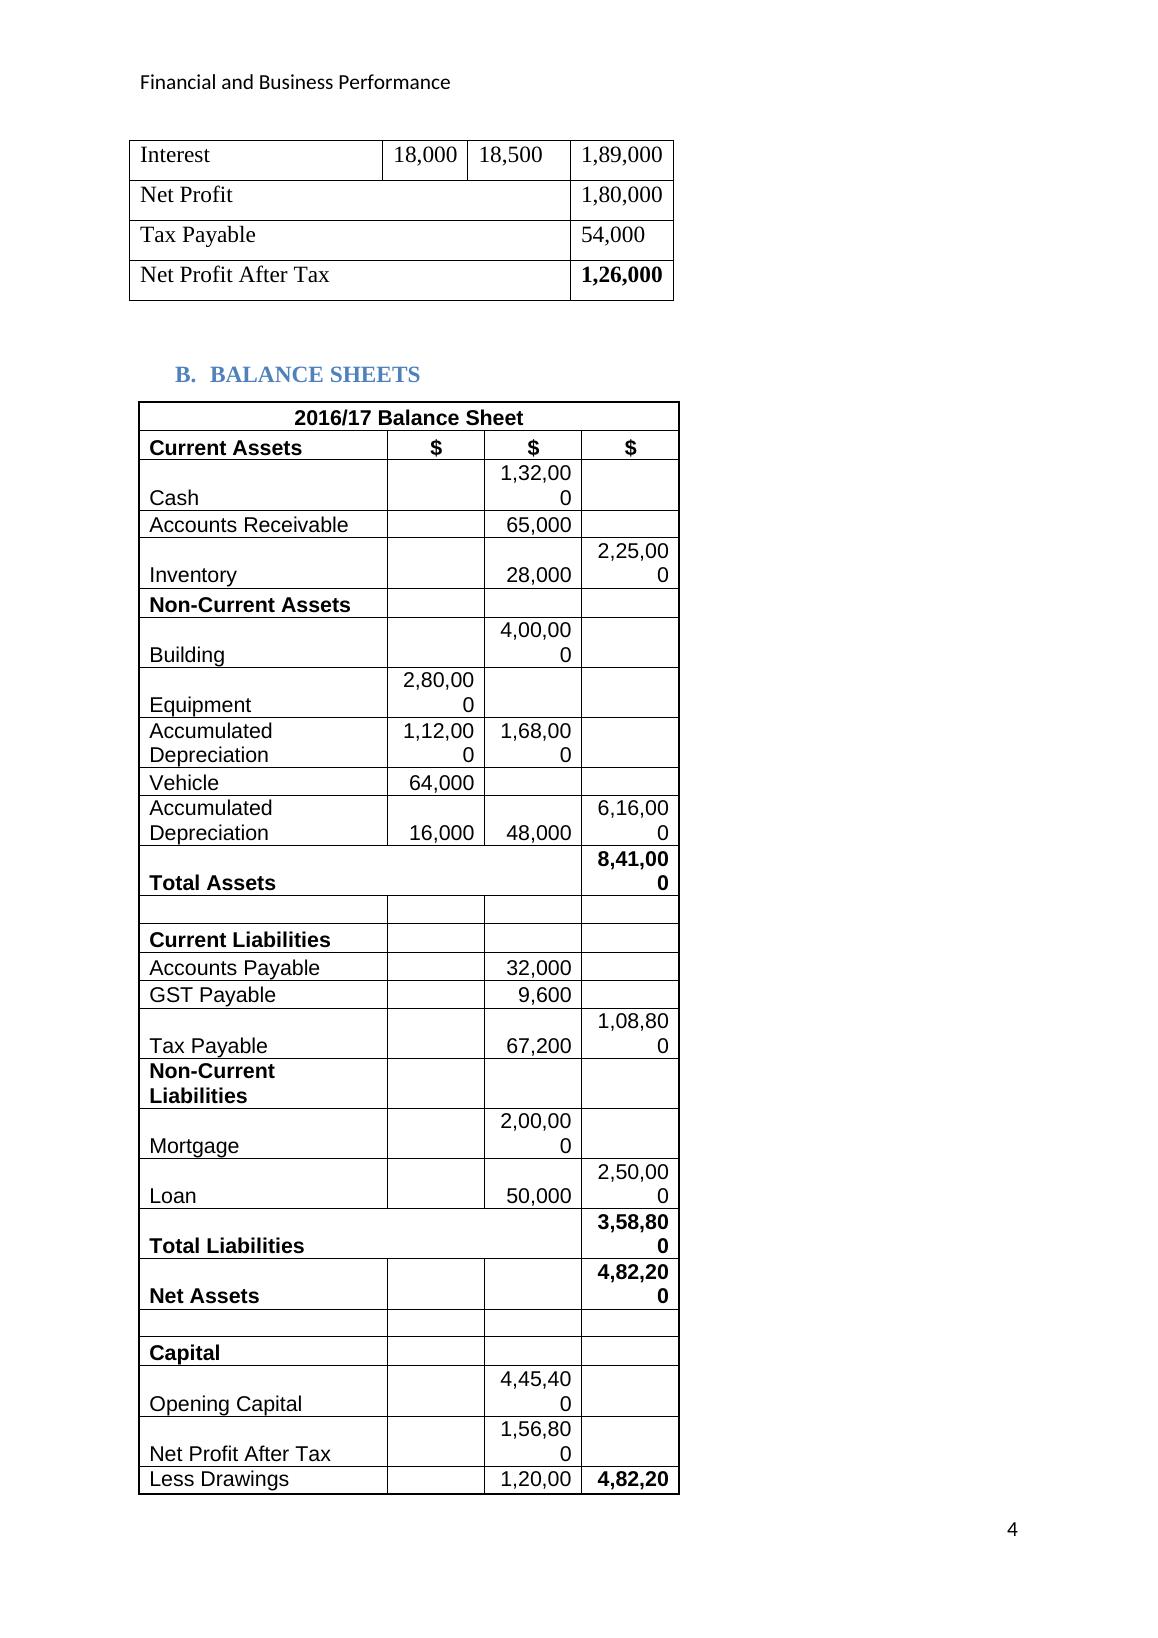
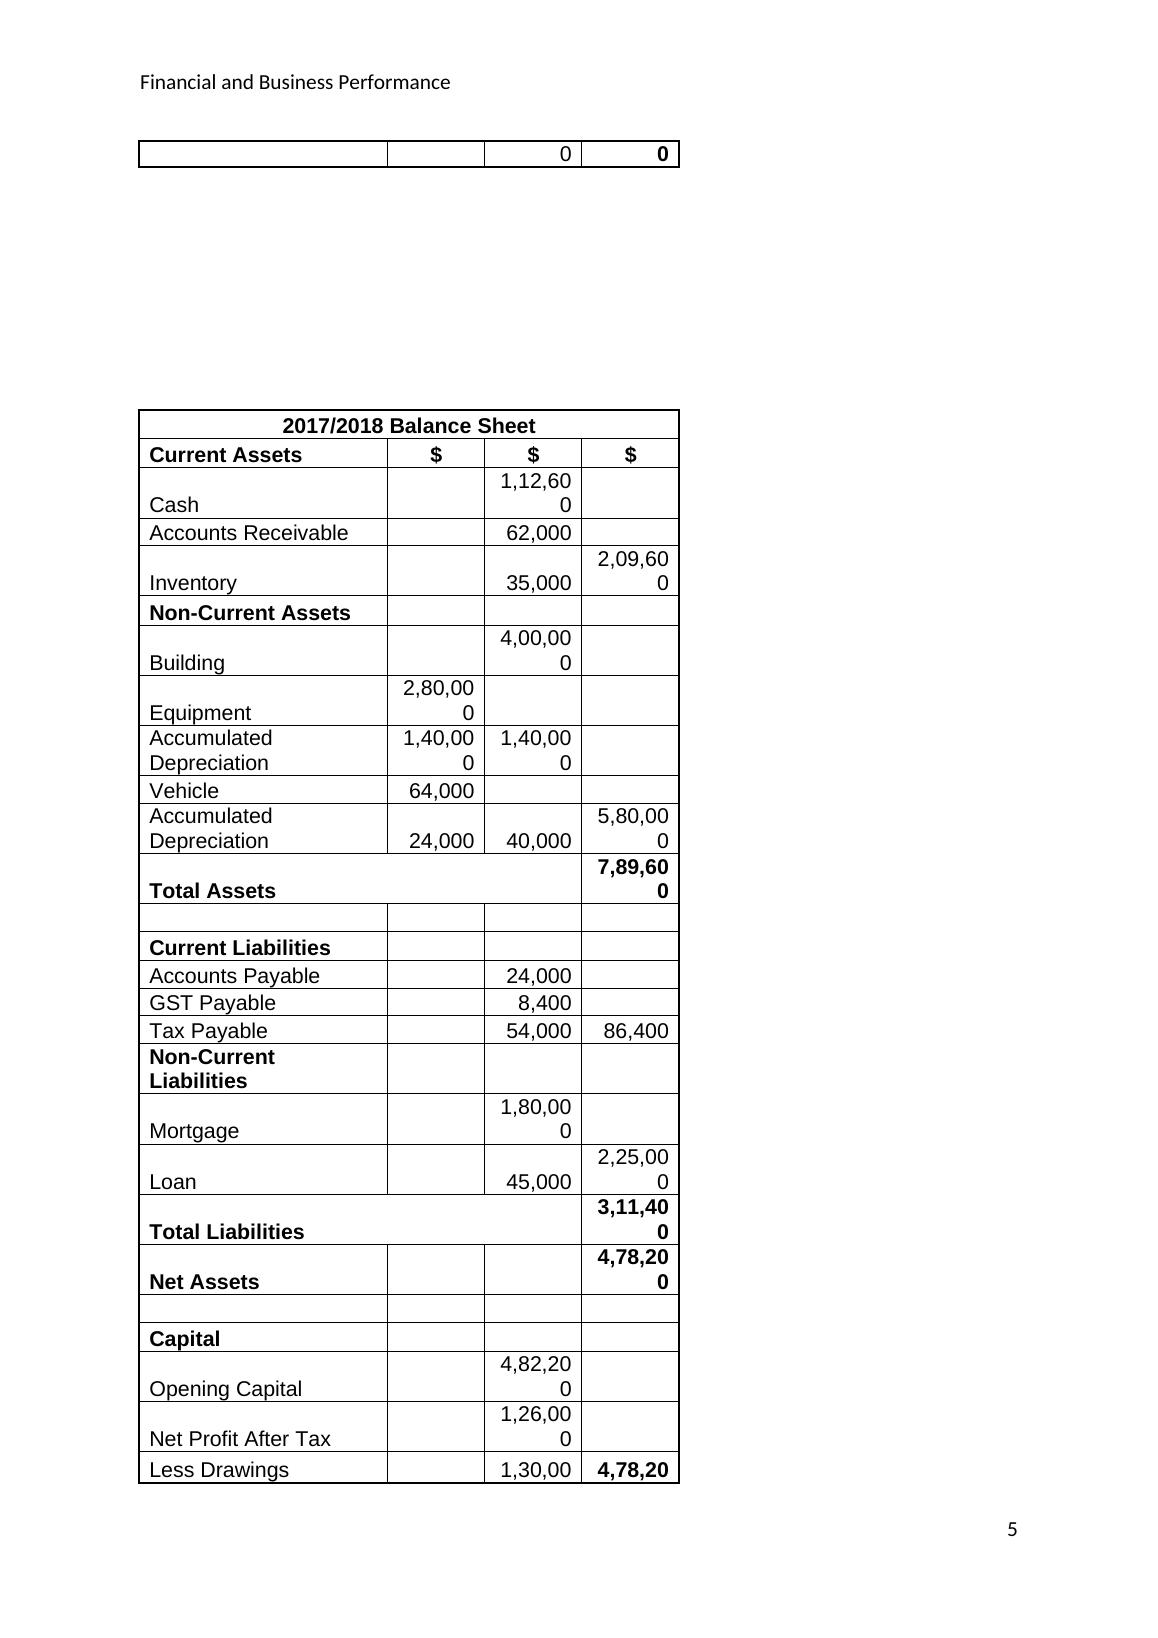
With the given information, we would calculate the ratios of 2017 and 2018 and also analyse the results to know whether the impact of the investment on the ratios would be positive or negative. Financial Statements of Lynch Quality Goods INCOME STATEMENTS Income Statement (2016/17) $ 80,000 $ Revenue 7,20,000 Less COGS Opening Stock 25,000 Purchases 3,10,000 Less Closing Stock 28,000 3,07,000 Gross Profit Loan 4,80,000 RATIO Depreciation 2,200,000 Total Assets Payable RATIO Depreciation 3
Financial and Business Performance Running Head: Financial and Business Performance Information
This assignment is about providing financial and business performance information. It covers topics such as forms of business ownership, communication needs of different clients, trade credit, and liquidity and activity ratios. The assignment is part of the assessment for the Diploma of Accounting course at TAFE SA.
Added on 2022-10-14
ShareRelated Documents
End of preview
Want to access all the pages? Upload your documents or become a member.
International finance Assignment (doc)
|9
|746
|45
EABUS1045 - Mamamia Ltd's Profit Before Tax - Financial Accounting
|8
|682
|42
Journal Entries for Share Application and Allotment
|13
|2414
|95
Financial Performance Evaluation of DP World and PSA Internationals
|14
|3285
|490
Introduction to Financial Accounting
|9
|764
|98
Financial Analysis | Assignment | Answers
|11
|1656
|14