Examination of Financial Distress in Indian Sugar Sector
VerifiedAdded on 2023/04/21
|6
|4297
|222
AI Summary
This research paper examines the extent of financial distress in the Indian sugar sector using Ohlson's 'O' Score model. Findings indicate widespread financial distress in the sector.
Contribute Materials
Your contribution can guide someone’s learning journey. Share your
documents today.
Research Paper IJMSRR
Impact Factor :3.029 E- ISSN - 2349-6746
ISSN -2349-6738
International Journal of Management and Social Science Research Review, Vol.1, Issue.14, Aug - 2015. Page221
EXAMINATION OF FINANCIAL DISTRESS IN INDIAN SUGAR SECTOR – APPLICATION OF OHLSON’S ‘O’
SCORE MODEL
Prof. Jyoti Nair
Assistant Professor, N.L.Dalmia Institute of Management Studies and Research, Mumbai.
Abstract
Financial distress is an indicator of probable bankruptcy and insolvency. A company in distress passes through various
stages of decline in financial health before bankruptcy sets in. Bankruptcy or insolvency not only leads to erosion of net
worth of the company but also adversely affects all the corporate stakeholders viz investors, lenders, employees , creditors ,
government and society in general. It becomes very crucial to identify distress signals well in advance so that so that
remedial steps can be taken for company turnaround. Indian sugar sector have been facing distress in recent times. The
profitability of companies in sugar sector is greatly affected by climatic conditions, price trends in international markets, oil
prices, government policies w.r.t cane and sugar pricing. This paper purports to examine the extent of financial distress in
Indian sugar sector. Identification of distress will enable the companies to review the business operations and policies and
develop strategies to combat financial distress. 58 listed companies in sugar sector were studied for the period 2011-12 to
2013-14. Ohlson (1980) model for bankruptcy prediction using logistic regression was applied to the selected companies to
identify distress and probability of bankruptcy. The results of the study indicates widespread financial distress in sugar
sector.
Key Words: Financial Distress, Bankruptcy, Sugar Sector, Ohlson’s ‘O’ Score.
1. INTRODUCTION
Financial distress in companies indicates a situation where the company is not able to meet its contractual obligations due to
dismal financial performance. Such distress is seen through gradual reduction in sales and other income, low margins of
profit, underutilization of assets and a challenging working capital. This leads to delay in payment to banks, suppliers,
employees and government. Sustenance and survival of a distressed company becomes difficult. However a financially
distressed company can turnaround itself through remedial measures taken at appropriate times. This is possible if the distress
signals are identified in advance by the company’s management. When financial distress cannot be mitigated, bankruptcy or
insolvency sets in. (Avenhuis, 2013).
It is generally accepted that financial statements contains relevant information which can help a stakeholder identify signals
of financial decay in a company. Such identification will help all the stake holders to protect their interest with minimum
losses. There are many distress prediction models developed by researchers which can be applied albeit with caution (Grice
and Dugan, 2001). The most commonly used models are:
1. Altman (1968) ‘z’ Score model using Multivariant Discriminant Analysis
2. Ohlson ( 1980) ‘o’ score model using Logit Analysis
3. Zmijewski ( 1984) model using Probit Analysis
4. Shumway (2001) model using Discrete Hazard Analysis.
5. Hillegeist (2004) model using the Black Scholes Probability theory.
FINANCIAL DISTRESS IN INDIA
The important indicators of financial distress leading to bankruptcies are debt default, negative net worth, negative operating
margins. The stressed advances of scheduled banks have shown an increasing trend over the last few years. Of the broad
sectors, 44.8% of the total advances have been made to industry sector. 17.9% of the total advances to industry sector has
been classified as stressed (Financial Stability report of RBI, June 2015). Industrial sickness in India has resulted in loss of
employment to millions of people. (Murty and Misra, 2004). It becomes imperative to adopt mechanisms which can serve as
early warning system for companies to take remedial measures. Applying prediction models using information from financial
statements can indicate distress on companies. Analysing the financial information of a business on a regular basis can
provide valuable insight about the state of affairs of the business. (Bhunia and Sarkar, 2011). This study aims to investigate
the extent of distress in Indian sugar sector.
SUGAR SECTOR IN INDIA
India is the second largest producer of sugar in the world contributing to around 14% of global sugar production. Sugar is a
critical agro based industry in India providing sustenance to around 50 million sugar cane farmers. This industry provides
employment to more than 20 lakh skilled and semi- skilled workers. The industry comprises of public sector units, private
Secure Best Marks with AI Grader
Need help grading? Try our AI Grader for instant feedback on your assignments.
Research Paper IJMSRR
Impact Factor :3.029 E- ISSN - 2349-6746
ISSN -2349-6738
International Journal of Management and Social Science Research Review, Vol.1, Issue.14, Aug - 2015. Page222
sector units and cooperative societies. The profitability of this sector is highly cyclical in nature. Climatic conditions, price
trends in international markets, oil prices, government policies w.r.t cane and sugar pricing affects the performance of the
sector.
Over a period of time sugar sector has witnessed crisis due to increase in cane prices proportionately more than sugar prices.
(CRISIL Opinion, 2014). Surplus production and fall in international prices have also contributed to low performance and
consequent decline in the financial health of companies in sugar industry.
Hence there is a need to examine the extent of financial distress in Indian sugar sector so that the stakeholders can take
appropriate measures to mitigate and minimize the adverse effects of financial crisis.
2. LITERATURE REVIEW
Research on corporate distress have always attracted and challenged researchers and practioners alike. Extensive literature is
available on study of corporate distress. The earliest study can be traced back to 1930’s. In 1966 Beaver developed a model
for predicting bankruptcy using univariate analysis. Later Altman in 1968 developed the very popular ‘z’ score bankruptcy
prediction model using Multi variate Discriminant Analysis (Avenhuis, 2013). Some of the recent important studies in this
subject are discussed below:
Kane et al (2006) have examined the usefulness of financial reporting data to predict the probability of a firm recovering
from financial distress. Marc Le Clere (2006) studied the relationship between different sets of financial variables used in
financial distress. Abad et al (2007) identified the unique features of failed companies and the syndromes leading to such
failures. Wang and Li (2007) used a rough set model was used to construct a distress prediction model of Chinese companies.
Smith and Liou (2007) in their study tested the applicability one model across all sectors and whether ratios indicating
financial distress differ sector wise was investigated. Sharpe and Stadnik (2007) tried to identify Australian general insurers
experiencing financial distress: The relationship between indirect financial distress cost borne by a companies under distress
and corporate governance was studied by Hui and Jing-Jing (2008). Coyne et al (2008) analysed financial ratios of 13
bankrupt health care systems and 7 solvent health care systems. Salehi and Bizhan (2009) studied financial distress of
companies listed in Tehran SE. Wang and Campbell (2010) applied Altman’s z-score model to predict financial distress in
publicly listed Chinese companies. Julien le Maux and Morin (2011) tried to analyse whether Lehman’Bros. Downfall could
have been predicted. Hodgkin and Marchesini (2011) studied companies which has defaulted on loan payments. Zaki (2011)
developed distress prediction models for commercial and Islamic banks in UAE. The Malaysian companies were reviewed by
Ong et al (2011). Polemis and Gounopoulos (2012) tried to identify financial characteristics of companies in financial
distress. Dave (2012) in his study tries to establish relationship between financial management and profitability. The
extensive literature accepts the usefulness of financial ratios in predicting financial distress.
There has been some studies conducted in the area of financial distress in Indian companies. Bhunia and Sarkar (2011)
analysed financial ratios of companies in pharma sector. Arun and Kasilingam (2011) applied Altman (1968) ‘z’ score model
to IT companies in India. The financial health of Indian automobile sector was studied by Sarbapriya Ray (2012) by applying
Altman ‘z’ score model. Bardia (2012) examined the long term solvency of Indian steel companies using Altman ‘z’ score
model. Reddy and Reddy (2012) investigated distress in Indian sugar sector by applying the ‘z’ score model.
As seen from the discussion above there has been numerous studies conducted on financial distress using different statistical
techniques. However most of the studies in Indian context has been done using Altman ‘z’ score model.
Wu et al. (2010) in Avenhius, 2014 tested Altman (1968), Ohlson (1980), Zmijewski (1984), Hillegiest (2004) for their
applicability in US firms for the period 1980-2006. The study revealed that Ohlson (1980) model has the highest
discriminating ability. Avenhius (2013) also reviewed Altman (1968), Ohlson (1980) and Zmijewski (1984) models and
observed that accuracy rate of Ohlson’s model is highest and logit regression as the statistical tool gives the best explanat ory
variables for distress prediction. Kumar and Kumar (2011) compared the predictive accuracy of Altman ‘z’ score model and
Ohlson’s ‘o’ score model when applied to Indian companies. Ohlson’s ‘o’ score model was found to be most accurate since it
used logistic regression. This paper applies Ohlson’s ‘o’ score model to companies in sugar sector in India.
3. RESEARCH OBJECTIVE
In view of the critical nature of sugar sector in India, the objective of this paper is to examine financial distress in sugar sector
in India using Ohlson (1980) ‘o’ score model.
Research Paper IJMSRR
Impact Factor :3.029 E- ISSN - 2349-6746
ISSN -2349-6738
International Journal of Management and Social Science Research Review, Vol.1, Issue.14, Aug - 2015. Page223
4. RESEARCH METHODOLOGY
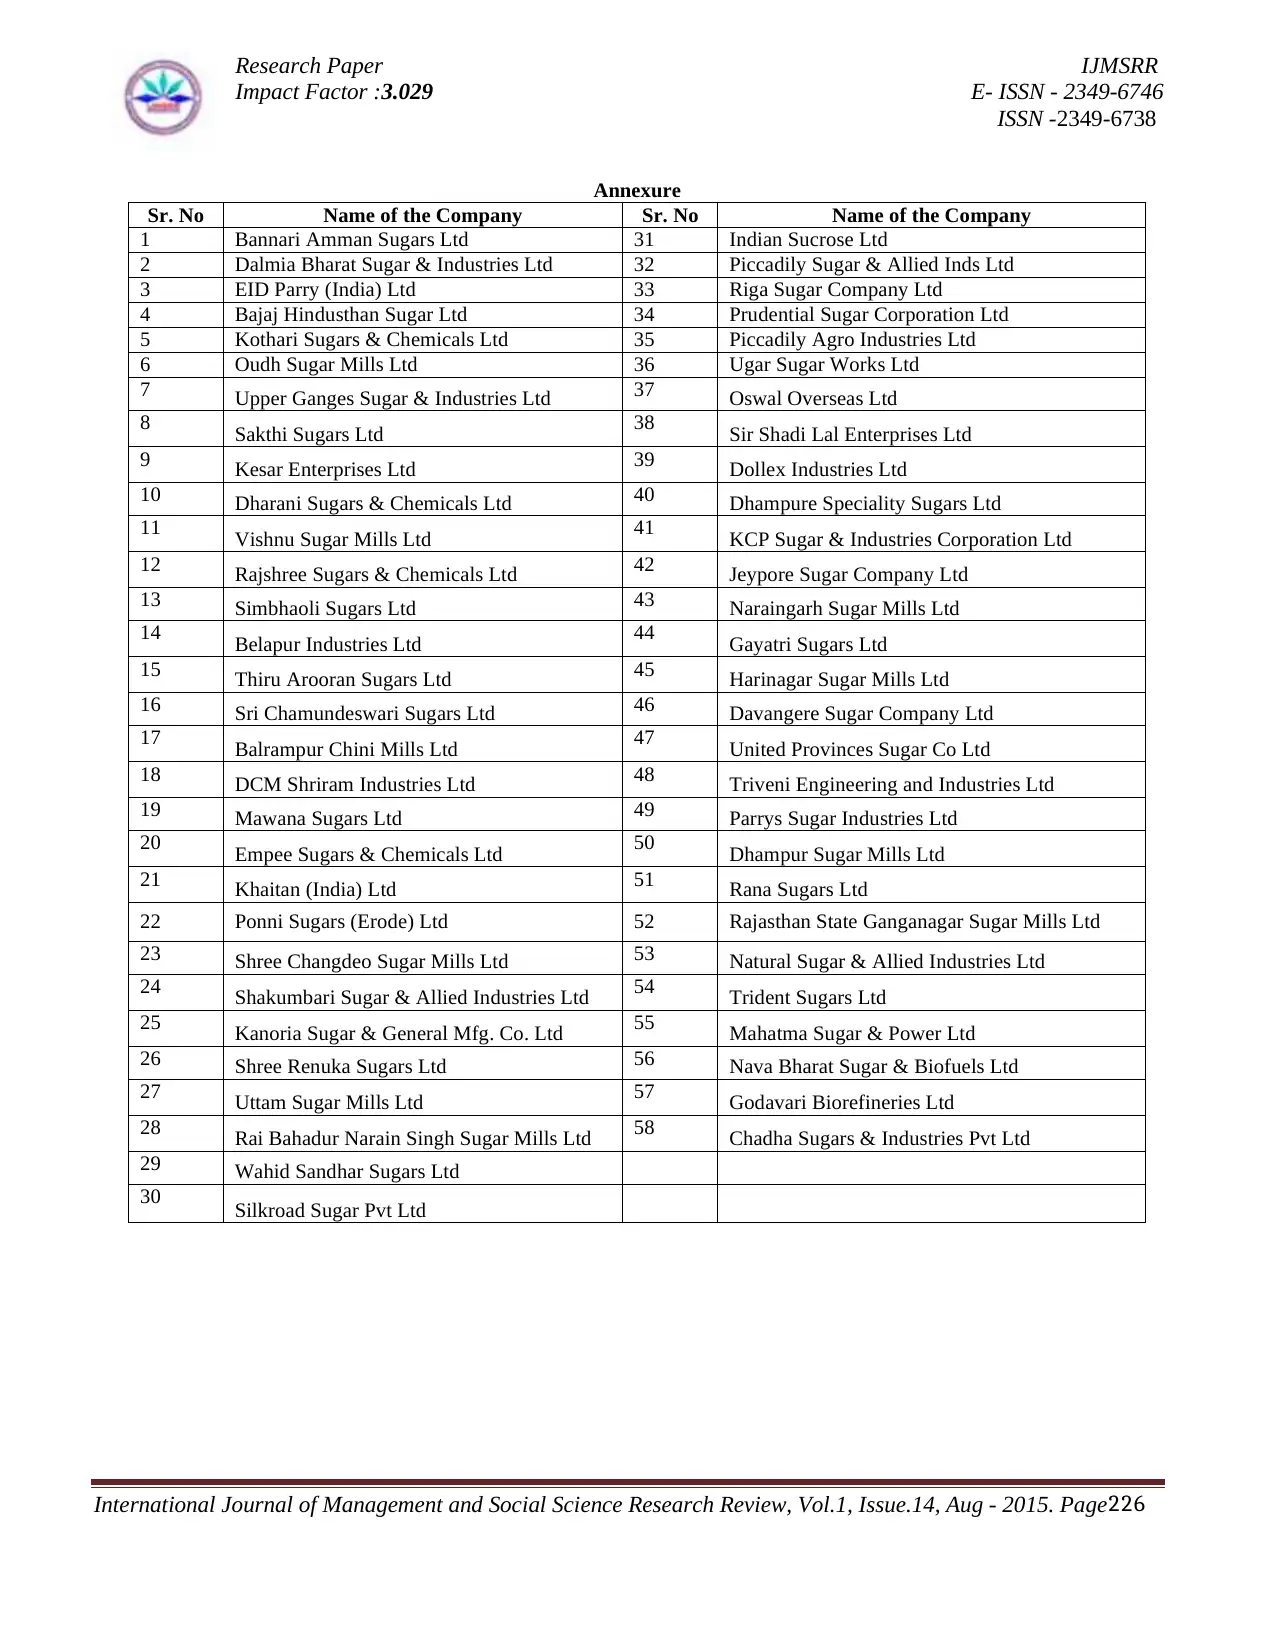
1. Data: The data comprises of 58 listed companies in sugar sector. The period of study is 2011-12 to 2013-14 (3
years). Refer Annexure for list of companies.
2. Data Source: The financial data for these companies have been extracted from Capitaline database.
3. Statistical model used: For examining the financial health of selected companies, Ohlson (1980) ‘o’ score model
has been used. Ohlson (1980) used logit regression.to develop bankruptcy prediction model from a sample of 105
bankrupt and 2058 non- bankrupt companies in US.
Model specification
Y = -1.3 – 0.4Y1+ 6.0Y2- 1.4Y3+ 0.1Y4- 2.5Y5- 1.8Y6+ 0.3Y7- 1.7Y8- 0.5Y9
Where Y1 = log (Total Assets/GNP price level index)
Y2 = Total Liabilities/Total Assets
Y3 = Working capital /Total Assets
Y4 = Current Liabilities / Current Assets
Y5 = 1 if Total liabilities > Total Assets else Y5 = 0
Y6 = Net Income/Total Assets
Y7 = Funds from operations/ Total Liabilities
Y8 = 1 if Net Income for 2 preceding years is negative else Y8= 0
Y9 = measure of change in Net Income
5. INTERPRETATION OF VARIABLES
Independent Variables
Y1 – Size of the company. Smaller companies tend to have greater probability of failure. GNP price level index has been
determined using 2011-12 as base year.
Y2 – The ratio of total liabilities to total assets indicates the extent to which the liabilities of the company are covered by
its assets. It also reflects the leverage of the company. A high total liabilities to assets ratio indicates higher risks for the
company.
Y3 – The ratio of working capital to total assets explains working capital adequacy and short term solvency and liquidity of
the company. A high ratio would indicate high levels of liquidity.
Y4 – The ratio of current liabilities to current assets reflects the extent of current asset coverage available to meet the
current liabilities of the company. This ratio is also a measure of short term solvency. A high current liability to current
ratio would indicate a poor solvency condition.
Y5 –Dummy variable for correction of extreme leverage. This value is used for discontinuity correction for the ratio total
liabilities to total assets. A value of 1 would mean a very high probability of bankruptcy (Ohlson, 1980).
Y6- Net Income to Total assets describes the overall profitability of the company. It also measures the return on its total
investment in asset terms.
Y7 – Funds from operations to total liabilities indicates the operating profit coverage for total liabilities. A high ratio
reflects adequacy of operating profits to meet the liabilities. This ratio is a measure of operating performance of the
company.
Y8 – Dummy variable for correction of continuing profits. A value of 1 indicates high probability of bankruptcy.
Y9 – Change in income over the preceding period calculated as N1- N0
|N1|+|N0|
Where N1 is Net income for current year and N0 is Net income for previous year. The change in net income is measured by
this ratio. The denominator acts as a level indicator. (Ohlson, 1980). A positive ratio is an indicator of improved profitability.
A negative ratio signifies distress.
All the above variables are indicators of different aspects of a business. These variables reflect profitability, leverage,
efficiency in asset utilization and liquidity of a company.
Impact Factor :3.029 E- ISSN - 2349-6746
ISSN -2349-6738
International Journal of Management and Social Science Research Review, Vol.1, Issue.14, Aug - 2015. Page223
4. RESEARCH METHODOLOGY
1. Data: The data comprises of 58 listed companies in sugar sector. The period of study is 2011-12 to 2013-14 (3
years). Refer Annexure for list of companies.
2. Data Source: The financial data for these companies have been extracted from Capitaline database.
3. Statistical model used: For examining the financial health of selected companies, Ohlson (1980) ‘o’ score model
has been used. Ohlson (1980) used logit regression.to develop bankruptcy prediction model from a sample of 105
bankrupt and 2058 non- bankrupt companies in US.
Model specification
Y = -1.3 – 0.4Y1+ 6.0Y2- 1.4Y3+ 0.1Y4- 2.5Y5- 1.8Y6+ 0.3Y7- 1.7Y8- 0.5Y9
Where Y1 = log (Total Assets/GNP price level index)
Y2 = Total Liabilities/Total Assets
Y3 = Working capital /Total Assets
Y4 = Current Liabilities / Current Assets
Y5 = 1 if Total liabilities > Total Assets else Y5 = 0
Y6 = Net Income/Total Assets
Y7 = Funds from operations/ Total Liabilities
Y8 = 1 if Net Income for 2 preceding years is negative else Y8= 0
Y9 = measure of change in Net Income
5. INTERPRETATION OF VARIABLES
Independent Variables
Y1 – Size of the company. Smaller companies tend to have greater probability of failure. GNP price level index has been
determined using 2011-12 as base year.
Y2 – The ratio of total liabilities to total assets indicates the extent to which the liabilities of the company are covered by
its assets. It also reflects the leverage of the company. A high total liabilities to assets ratio indicates higher risks for the
company.
Y3 – The ratio of working capital to total assets explains working capital adequacy and short term solvency and liquidity of
the company. A high ratio would indicate high levels of liquidity.
Y4 – The ratio of current liabilities to current assets reflects the extent of current asset coverage available to meet the
current liabilities of the company. This ratio is also a measure of short term solvency. A high current liability to current
ratio would indicate a poor solvency condition.
Y5 –Dummy variable for correction of extreme leverage. This value is used for discontinuity correction for the ratio total
liabilities to total assets. A value of 1 would mean a very high probability of bankruptcy (Ohlson, 1980).
Y6- Net Income to Total assets describes the overall profitability of the company. It also measures the return on its total
investment in asset terms.
Y7 – Funds from operations to total liabilities indicates the operating profit coverage for total liabilities. A high ratio
reflects adequacy of operating profits to meet the liabilities. This ratio is a measure of operating performance of the
company.
Y8 – Dummy variable for correction of continuing profits. A value of 1 indicates high probability of bankruptcy.
Y9 – Change in income over the preceding period calculated as N1- N0
|N1|+|N0|
Where N1 is Net income for current year and N0 is Net income for previous year. The change in net income is measured by
this ratio. The denominator acts as a level indicator. (Ohlson, 1980). A positive ratio is an indicator of improved profitability.
A negative ratio signifies distress.
All the above variables are indicators of different aspects of a business. These variables reflect profitability, leverage,
efficiency in asset utilization and liquidity of a company.
Research Paper IJMSRR
Impact Factor :3.029 E- ISSN - 2349-6746
ISSN -2349-6738
International Journal of Management and Social Science Research Review, Vol.1, Issue.14, Aug - 2015. Page224
Dependent Variable
The value of dependent variable Y is the ‘o’ score. Since Ohlson has used logistic regression to determine the coefficients of
independent variables, ‘o’ score is the log odds of the company being financially distressed.
Hence Y (‘o’ score) = log (p/1-p)
This can be converted to probability as under:
Probability of failure = exp (‘o’score)
1+exp (‘o’score)
Ohlson (1980) gave the cut off at 50%.
P(Y) > 0.50 indicates failed, P(Y) < 0.50 indicates non- failed
6. OBSERVATIONS AND CONCLUSION
The nine predictor variables as defined by Ohlson (1980) in his model, the ‘o’ score and probability of bankruptcy was
calculated for the 58 companies selected for the study. The values calculated are shown in Table 1.
Table 1,Ohlson (1980) ‘o’ score determinants
Year Y1 Y2 Y3 Y4 Y5 Y6 Y7 Y8 Y9 Y score P(Y)
2014 0.25 0.88 0.23 0.73 0 -0.04 0.06 0 -0.53 2.77 0.89
2013 0.33 0.83 0.26 0.67 0 0.00 0.11 0 0.14 2.16 0.84
2012 0.32 0.83 0.25 0.63 0 0.00 0.10 0 0.00 2.28 0.87
As seen from Table 1, the companies in sugar sector exhibit very high degrees of financial distress. Table 2 below
summarizes the observations and the indicators.
Table - 2Financial Distress Indicators
Sr. No Observation Indicator
1 Widespread financial distress All companies have a probability score of more than 0.5
2 Adverse Long term solvency Very high total liabilities in relation to total assets.
3 Low operating profitability Very low operating profits in relation to total liabilities
4 Poor efficiency in utilization of assets Very low net income in relation to total assets.
5 Continuous reduction in profitability Decreasing net income from 2011-12 to 2013-14.
From the above observations, it can be concluded that not only the profitability of companies in sugar sector is decreasing
continuously, but the efficiency in operations and long term solvency is also adversely affected.
7. RECOMMENDATIONS
Immediate steps will have to be taken to ensure profitability and survival of the companies. One very important step in this
direction would be to rationalize pricing policy of sugar and cane sugar. The possibility of export of surplus sugar needs to be
explored.
REFERENCES
1. Abad, Cristina, José.L, Arquero, & Sergio, M. Jiménez (2007). Syndromes Leading To Failure: An
Exploratory Research. Investment Management & Financial Innovations, 4(3), 23-32
2. Avenhuis, Jeroen Oude (2013).Testing the generalizability of the bankruptcy prediction models of Altman,
Ohlson and Zmijewski for Dutch listed and large non-listed firms. Thesis submitted to School of Management
and Governance, University of Twente, Netherlands.
3. Bhunia, A., & Sarkar, Bagchi (2011). A study of financial distress based on MDA. Journal of Management
Research, 3(2), 1-11.
Secure Best Marks with AI Grader
Need help grading? Try our AI Grader for instant feedback on your assignments.
Research Paper IJMSRR
Impact Factor :3.029 E- ISSN - 2349-6746
ISSN -2349-6738
International Journal of Management and Social Science Research Review, Vol.1, Issue.14, Aug - 2015. Page225
4. Coyne, Joseph S., Singh, Sher.G & Smith, Gary J.(2008).The Early Indicators of Financial Failure: A Study of
Bankrupt and Solvent Health Systems. Journal of Healthcare Management, 53(5), 333-346.
5. Dave, A. R. (2012). Financial management as a determinant of profitability: A study of Indian Pharma sector.
South Asian Journal of Management, 19(1), 124-137.
6. Ehab, Zaki (2011). Assessing probabilities of financial distress of banks in UAE. Journal of Managerial
Finance .7(3), 304-320
7. Ganesalingam, S., & Kumar, Kuldeep. (2001).Detection of financial distress via multivariate statistical
analysis. Managerial Finance, 27(4), 45-55
8. Grice, John Stephen., & Dugan, Michael T. (2001).The Limitations of Bankruptcy Prediction Models: Some
Cautions for the Researcher. Review of Quantitative Finance and Accounting. 17(2), 151-166
9. Hodgin, R. F., & Marchesini, R. (2011). Financial distress models: How pertinent are sampling bias
criticisms?. The Journal of Applied Business and Economics, 12(4), 29-35.
10. Hui, Huang.Jing-Jing (2008).Relationship between Corporate Governance and Financial Distress: An
empirical study of distressed companies in China, International Journal of Management; 25(4), 654-664
11. Julien le Maux & Danielle Morin. (2011). Black and white and red all over: Lehman Brothers’ inevitable
bankruptcy splashed across its financial statement. International Journal of Business and Social Science,
2(20), 39-65.
12. Kane, G. D., Richardson, F. M., & Velury, U. (2006). The relevance of stock and flow-based reporting
information in assessing the likelihood of emergence from corporate financial distress. Review of Quantitative
Finance and Accounting, 26(1), 5-22.
13. Mahdi, Salehi., & Bizhan, Abedini (2009).Financial Distress Prediction in Emerging Market: Empirical
Evidences from Iran. Interdisciplinary Journal of Contemporary Research in Business, 1(1), 6-26.
14. Marc J. LeClere (2006). Bankruptcy studies and ad hoc variable selection: a canonical correlation analysis.
Review of Accounting and Finance .5(4), 410-422
15. Murty, A. V .N, & Misra, D. P (2004). Cash Flow Ratios as Indicators of Corporate Failure. Finance India,
18(3), 1315-1325
16. N. Ramana Reddy & K.Hari Prasad Reddy (2010). Financial status of select sugar manufacturing units - z
score model. International Journal of Marketing, Financial Services & Management Research. 1(4), 64-69.
17. Ohlson, James. (1980). Financial ratios and probabilistic prediction of bankruptcy. Journal of Accounting
Research, 18(1), 109-131.
18. Ong, S., Voon, C. Y., & Roy W.L. Khong. (2011).Corporate failure prediction: A study of public listed
companies in Malaysia. Managerial Finance, 37(6), 553-564.
19. Polemis, D., & Gounopoulos, D. (2012). Prediction of distress and identification of potential M&A’s targets in
UK. Managerial Finance, 38(11), 1085-1104.
20. Radha Ganesh Kumar & Kishore Kumar (2012). A comparison of bankruptcy models. International Journal of
Marketing, Financial services & Management Research .1(4), 76-86.
21. R. Arun., & P. Kasilingam (2011). Predicting solvency: Indian IT companies. SCMS Journal of Management,
81-95
22. Sarbapriya Ray (2011). Assessing Corporate Financial Distress in Automobile Industry of India: An
Application of Altman’s Model. Research Journal of Finance and Accounting .2(3), 55-168.
23. S C Bardia (2012). Predicting Financial Distress and Evaluating Long-Term Solvency: An Empirical Study
The IUP Journal of Accounting Research & Audit Practices. 11(1), 47-61
24. Sharpe, Ian. G. & Andrei Stadnik. (2007). Financial distress in Australian General Insurers. Journal of Risk
and Insurance, 7(2), 377-399.
25. Smith, Malcolm, & Dah- Kwei, Liou (2007). Industrial sector and financial distress.Managerial Auditing
Journal, 22(4), 376-391
26. Wang, Ying & Campbell .Michael (2010).Business Failure Prediction for Publicly Listed Companies in China.
Journal of Business and Management. 16(1), 75-88.
27. http://planningcommission.nic.in/data/datatable/index.php
28. https://www.crisil.com/Ratings/Brochureware/News/CRISIL%20Research_Opinion_Sugar-Prices_13Feb
2014 .pdf
29. https://www.rbi.org.in/Scripts/PublicationReportDetails.aspx.
Research Paper IJMSRR
Impact Factor :3.029 E- ISSN - 2349-6746
ISSN -2349-6738
International Journal of Management and Social Science Research Review, Vol.1, Issue.14, Aug - 2015. Page226
Annexure
Sr. No Name of the Company Sr. No Name of the Company
1 Bannari Amman Sugars Ltd 31 Indian Sucrose Ltd
2 Dalmia Bharat Sugar & Industries Ltd 32 Piccadily Sugar & Allied Inds Ltd
3 EID Parry (India) Ltd 33 Riga Sugar Company Ltd
4 Bajaj Hindusthan Sugar Ltd 34 Prudential Sugar Corporation Ltd
5 Kothari Sugars & Chemicals Ltd 35 Piccadily Agro Industries Ltd
6 Oudh Sugar Mills Ltd 36 Ugar Sugar Works Ltd
7 Upper Ganges Sugar & Industries Ltd 37 Oswal Overseas Ltd
8 Sakthi Sugars Ltd 38 Sir Shadi Lal Enterprises Ltd
9 Kesar Enterprises Ltd 39 Dollex Industries Ltd
10 Dharani Sugars & Chemicals Ltd 40 Dhampure Speciality Sugars Ltd
11 Vishnu Sugar Mills Ltd 41 KCP Sugar & Industries Corporation Ltd
12 Rajshree Sugars & Chemicals Ltd 42 Jeypore Sugar Company Ltd
13 Simbhaoli Sugars Ltd 43 Naraingarh Sugar Mills Ltd
14 Belapur Industries Ltd 44 Gayatri Sugars Ltd
15 Thiru Arooran Sugars Ltd 45 Harinagar Sugar Mills Ltd
16 Sri Chamundeswari Sugars Ltd 46 Davangere Sugar Company Ltd
17 Balrampur Chini Mills Ltd 47 United Provinces Sugar Co Ltd
18 DCM Shriram Industries Ltd 48 Triveni Engineering and Industries Ltd
19 Mawana Sugars Ltd 49 Parrys Sugar Industries Ltd
20 Empee Sugars & Chemicals Ltd 50 Dhampur Sugar Mills Ltd
21 Khaitan (India) Ltd 51 Rana Sugars Ltd
22 Ponni Sugars (Erode) Ltd 52 Rajasthan State Ganganagar Sugar Mills Ltd
23 Shree Changdeo Sugar Mills Ltd 53 Natural Sugar & Allied Industries Ltd
24 Shakumbari Sugar & Allied Industries Ltd 54 Trident Sugars Ltd
25 Kanoria Sugar & General Mfg. Co. Ltd 55 Mahatma Sugar & Power Ltd
26 Shree Renuka Sugars Ltd 56 Nava Bharat Sugar & Biofuels Ltd
27 Uttam Sugar Mills Ltd 57 Godavari Biorefineries Ltd
28 Rai Bahadur Narain Singh Sugar Mills Ltd 58 Chadha Sugars & Industries Pvt Ltd
29 Wahid Sandhar Sugars Ltd
30 Silkroad Sugar Pvt Ltd
1 out of 6


Your All-in-One AI-Powered Toolkit for Academic Success.
+13062052269
info@desklib.com
Available 24*7 on WhatsApp / Email
![[object Object]](/_next/static/media/star-bottom.7253800d.svg)
Unlock your academic potential
© 2024 | Zucol Services PVT LTD | All rights reserved.