Comprehensive Statistical Analysis of Crime Data: Research Project
VerifiedAdded on 2023/01/11
|7
|1130
|70
Report
AI Summary
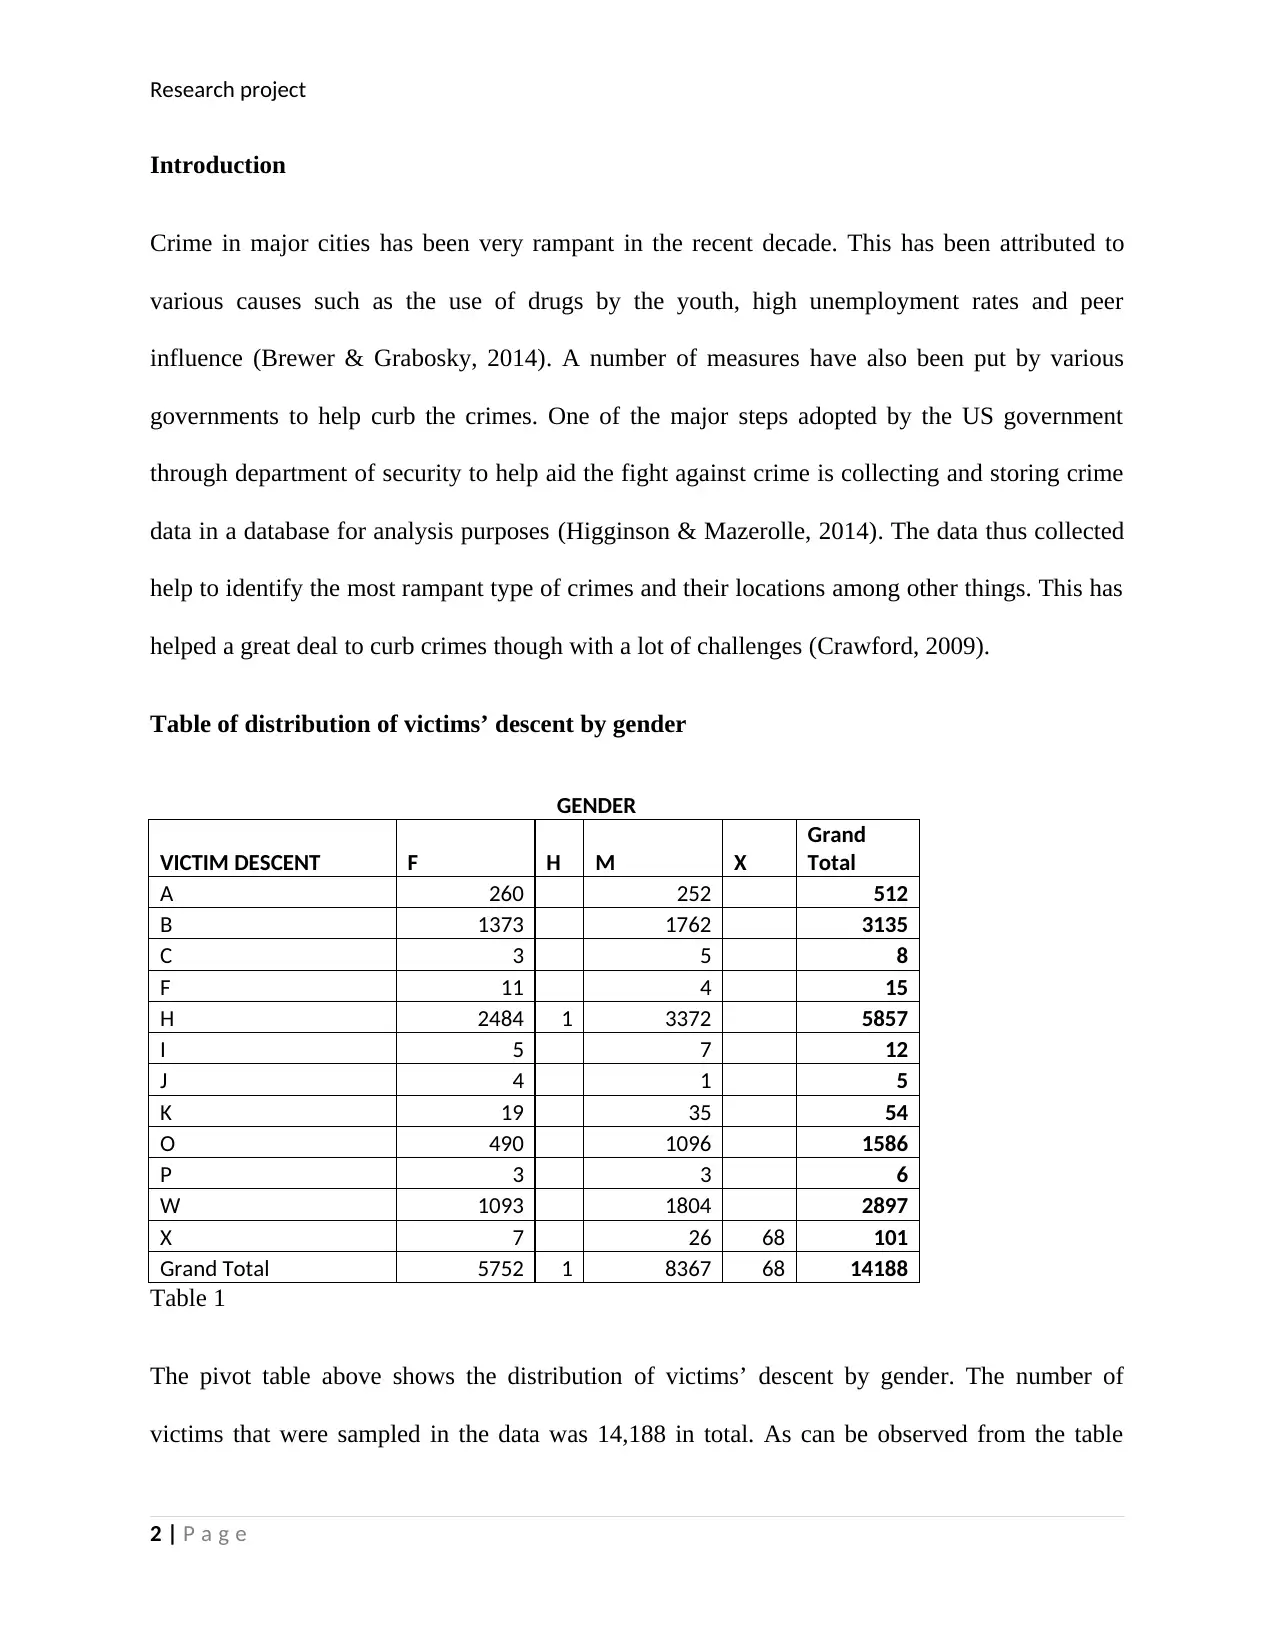
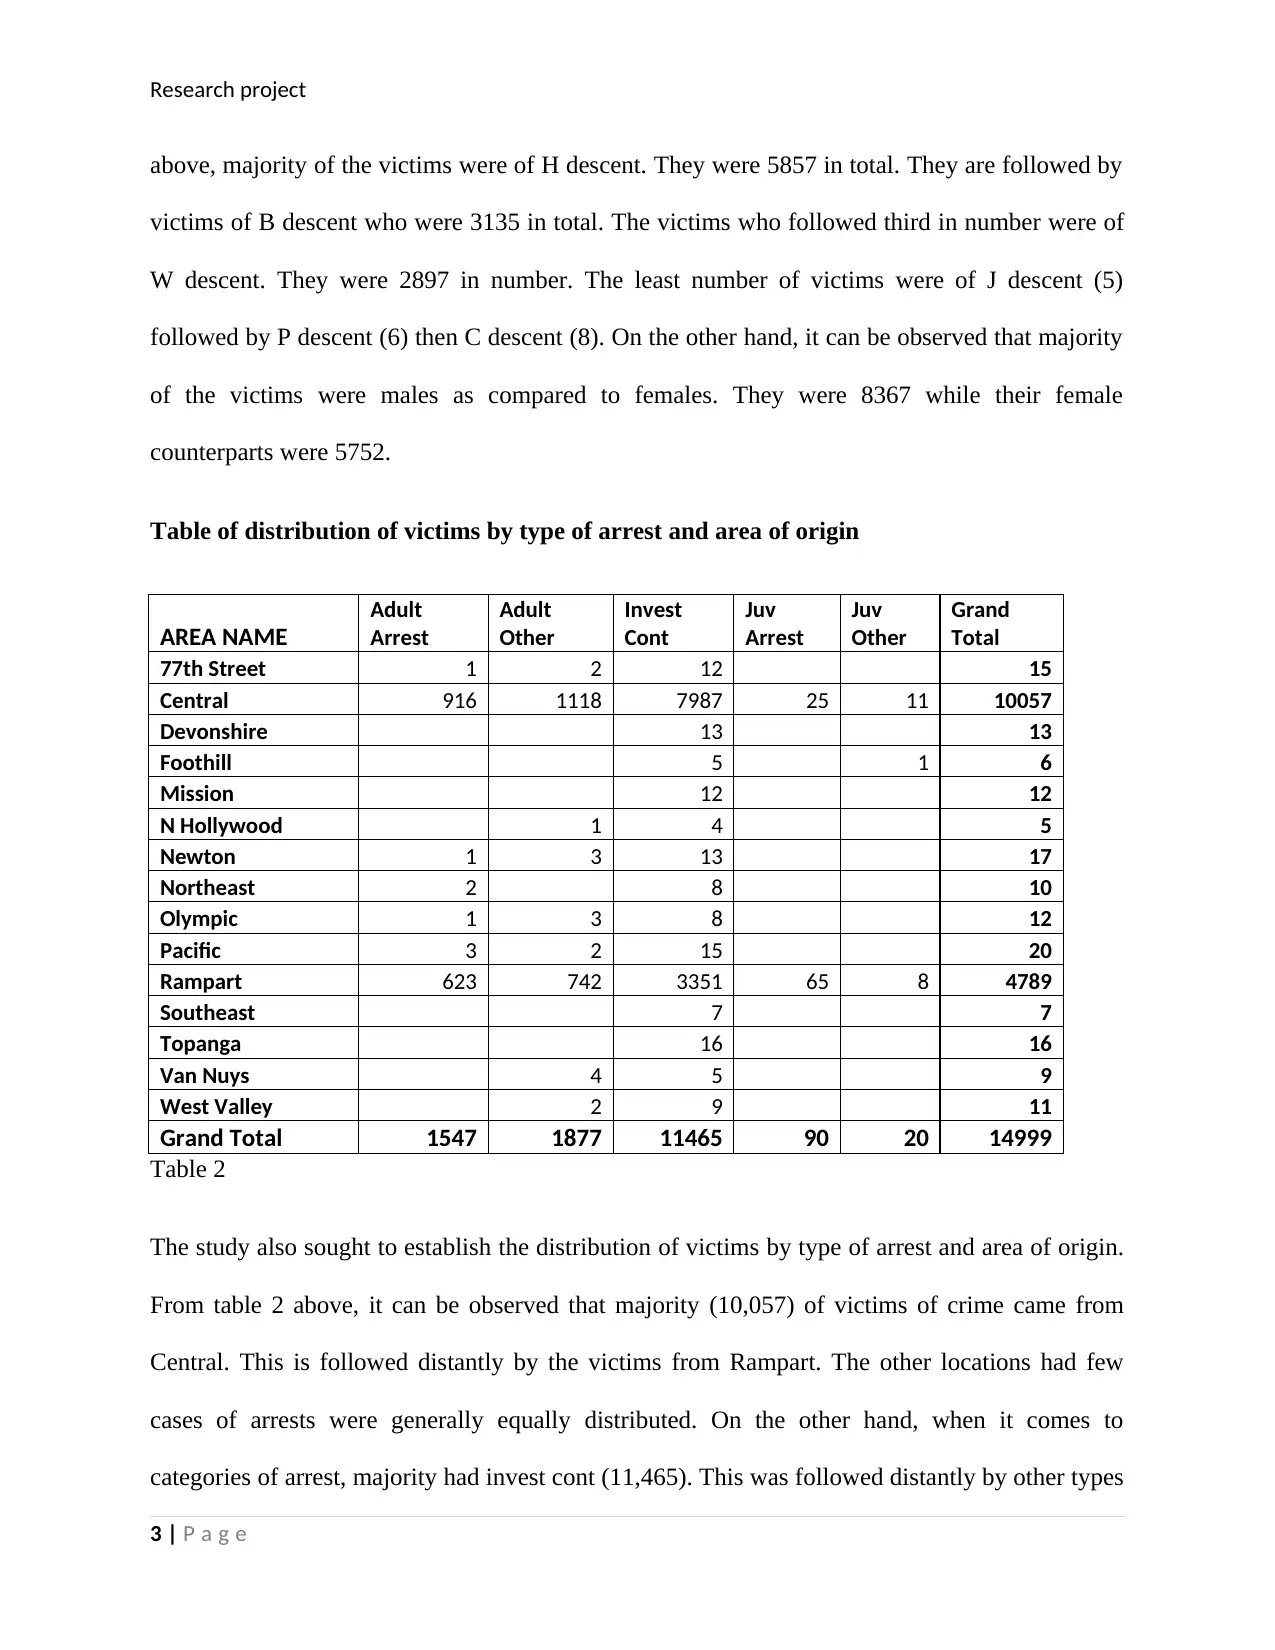
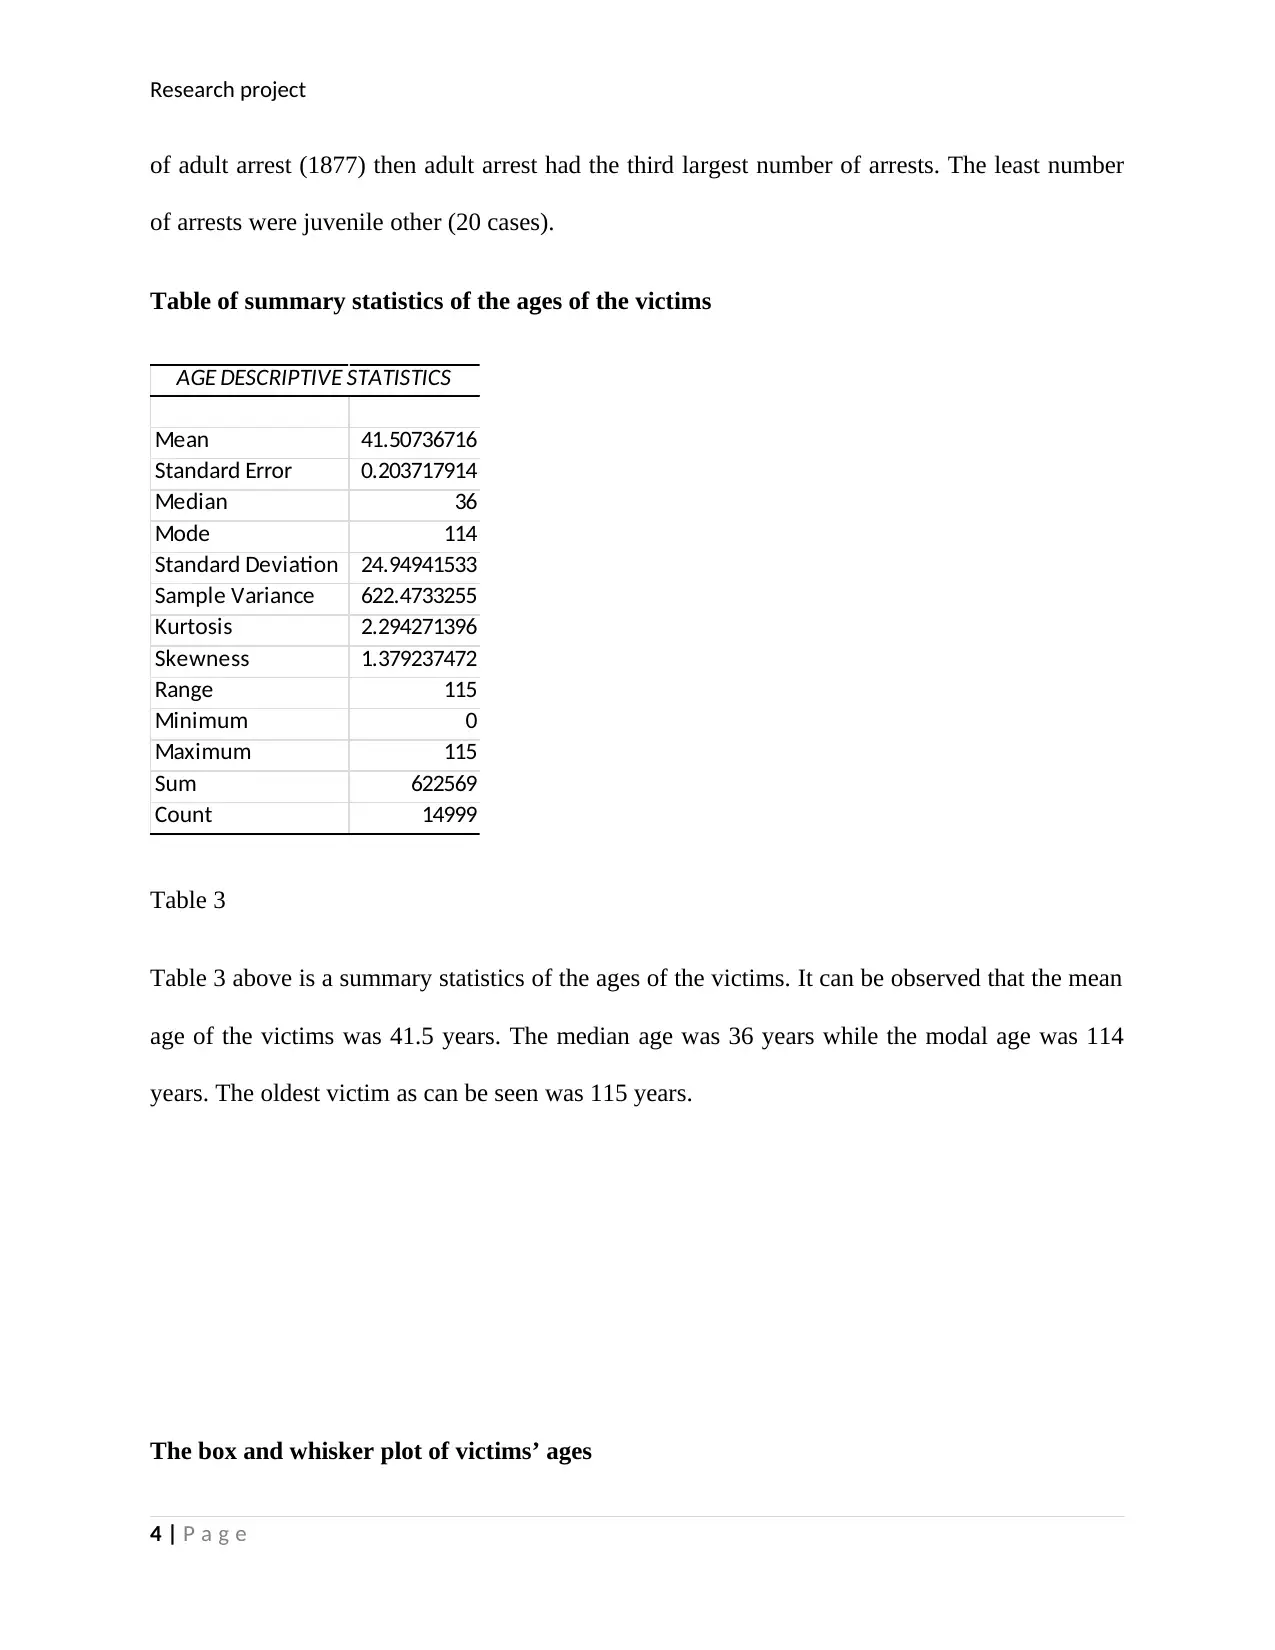
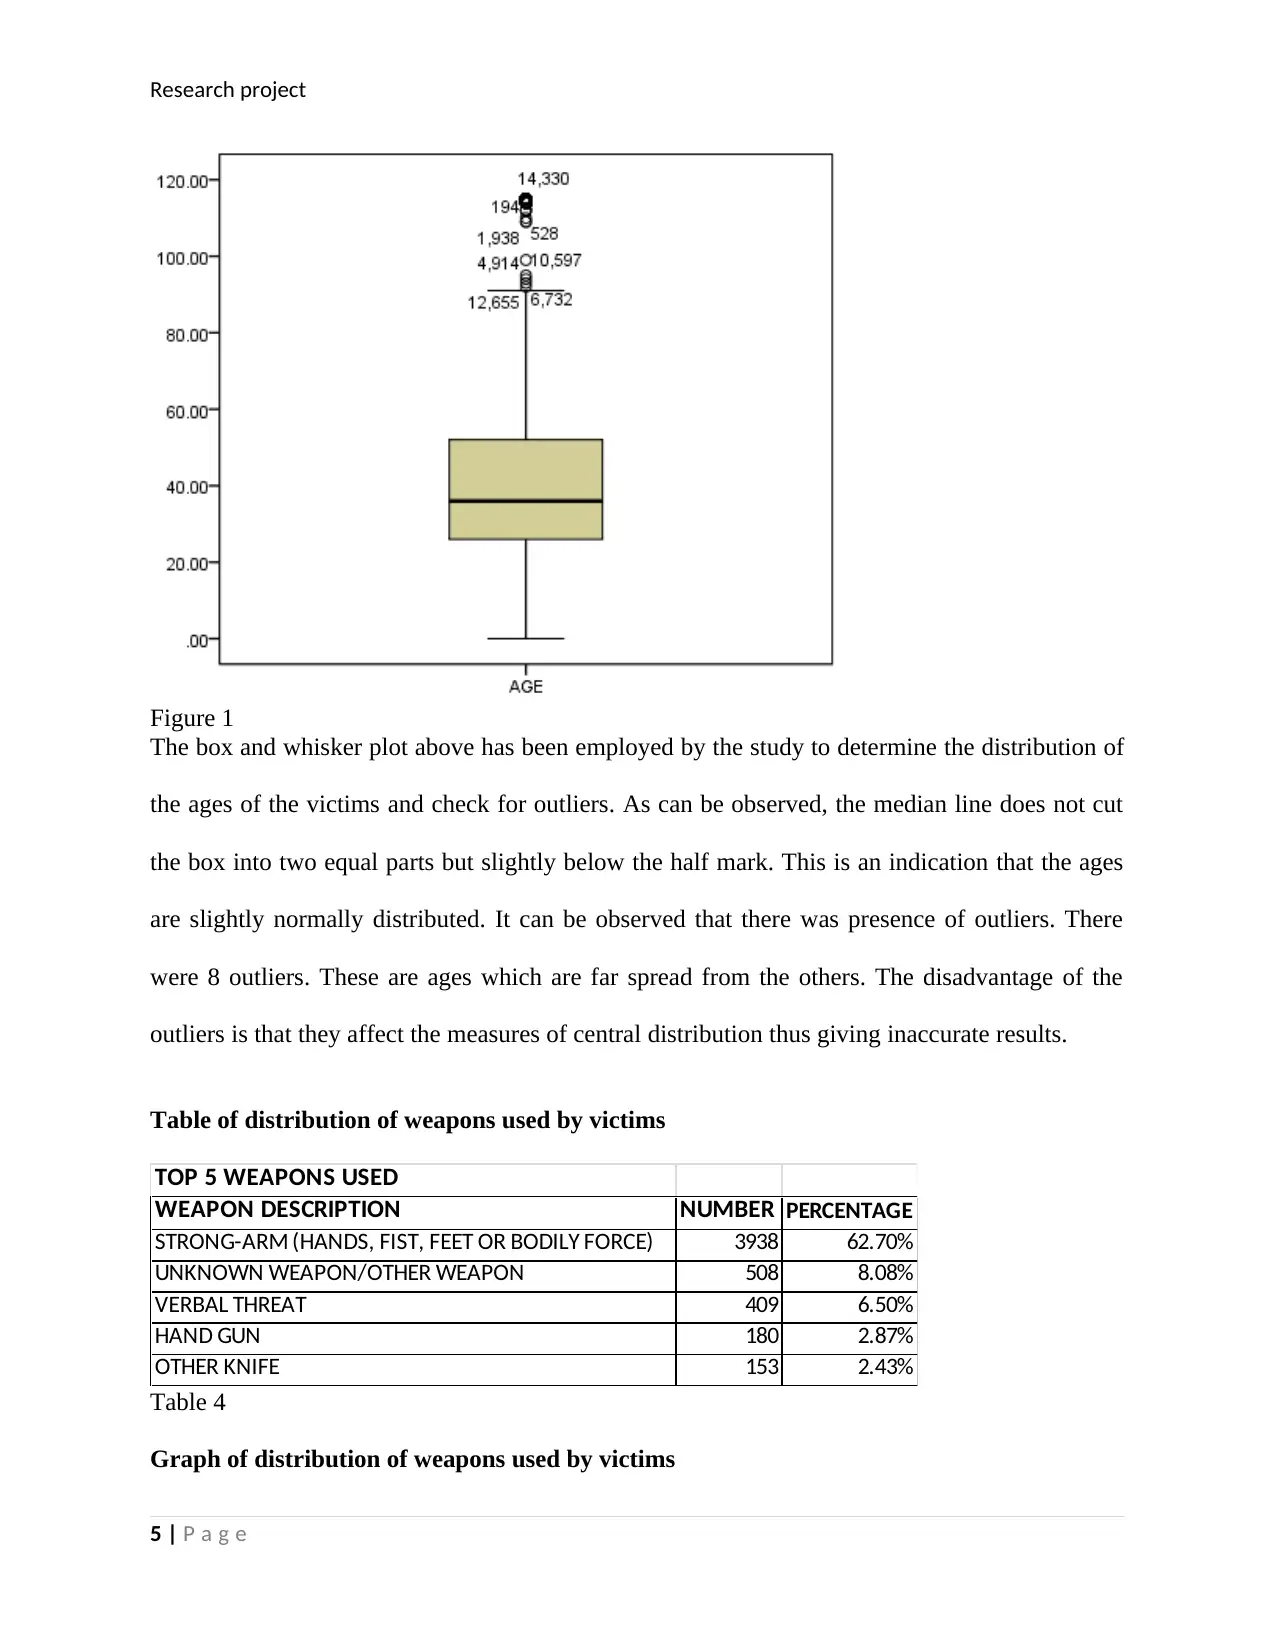
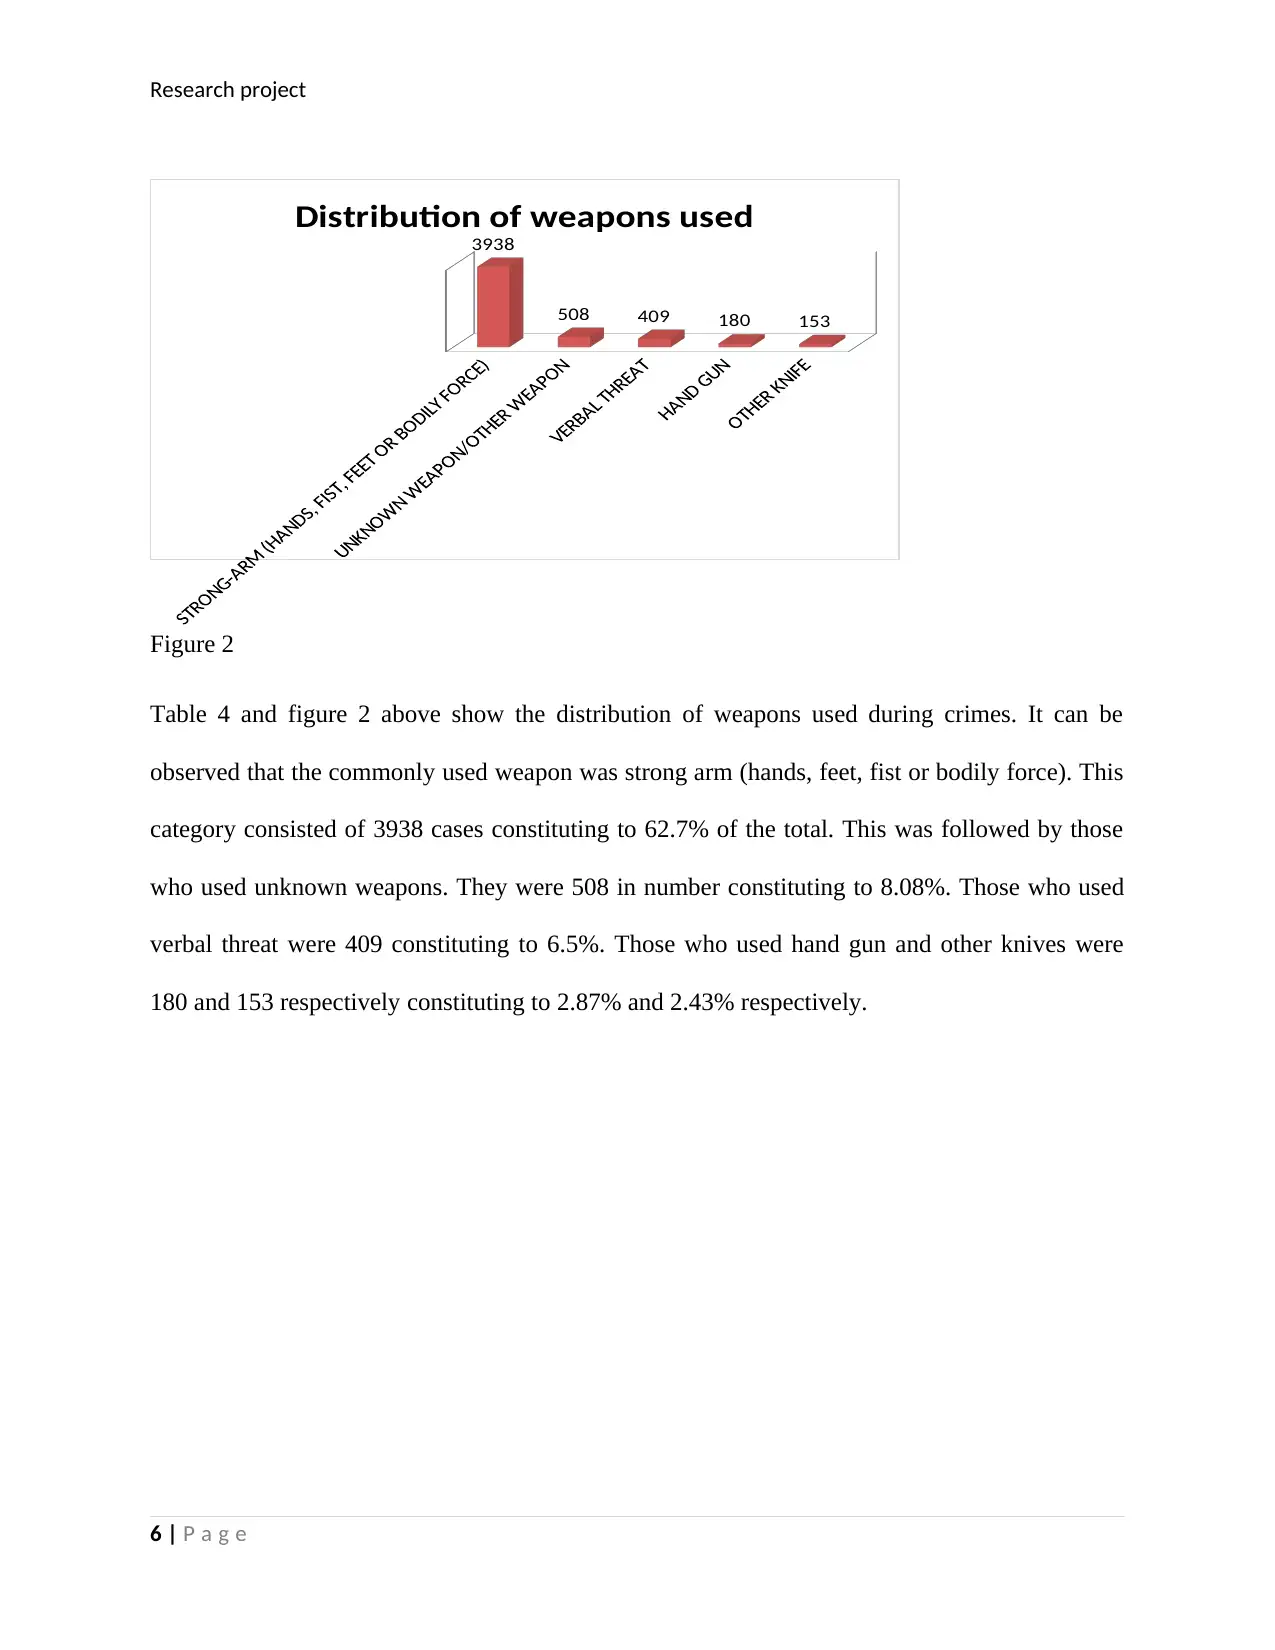
This research project presents a statistical analysis of crime data, examining various aspects such as victim demographics, arrest types, and weapon usage. The report begins with an introduction discussing the increasing crime rates in major cities and the measures taken by governments, including the collection and storage of crime data for analysis. The study analyzes data from a sample of 14,188 victims, presenting the distribution of victims' descent by gender, revealing that a majority of victims are of H descent and male. Further analysis explores the distribution of victims by arrest type and area of origin, highlighting that Central had the highest number of victims. The report includes a summary of victim ages, with a mean age of 41.5 years and the presence of outliers. Finally, the distribution of weapons used during crimes is presented, revealing that strong-arm tactics are the most commonly used weapon. The report provides tables, a box and whisker plot, and a graph to illustrate the statistical findings.
1 out of 7
Related Documents


Your All-in-One AI-Powered Toolkit for Academic Success.
+13062052269
info@desklib.com
Available 24*7 on WhatsApp / Email
![[object Object]](/_next/static/media/star-bottom.7253800d.svg)
© 2024 | Zucol Services PVT LTD | All rights reserved.