Data Analysis: Student Awareness of Environmental Issues Research

Verified

Added on  2020/05/11

|23
|2695
|29
Report
AI Summary
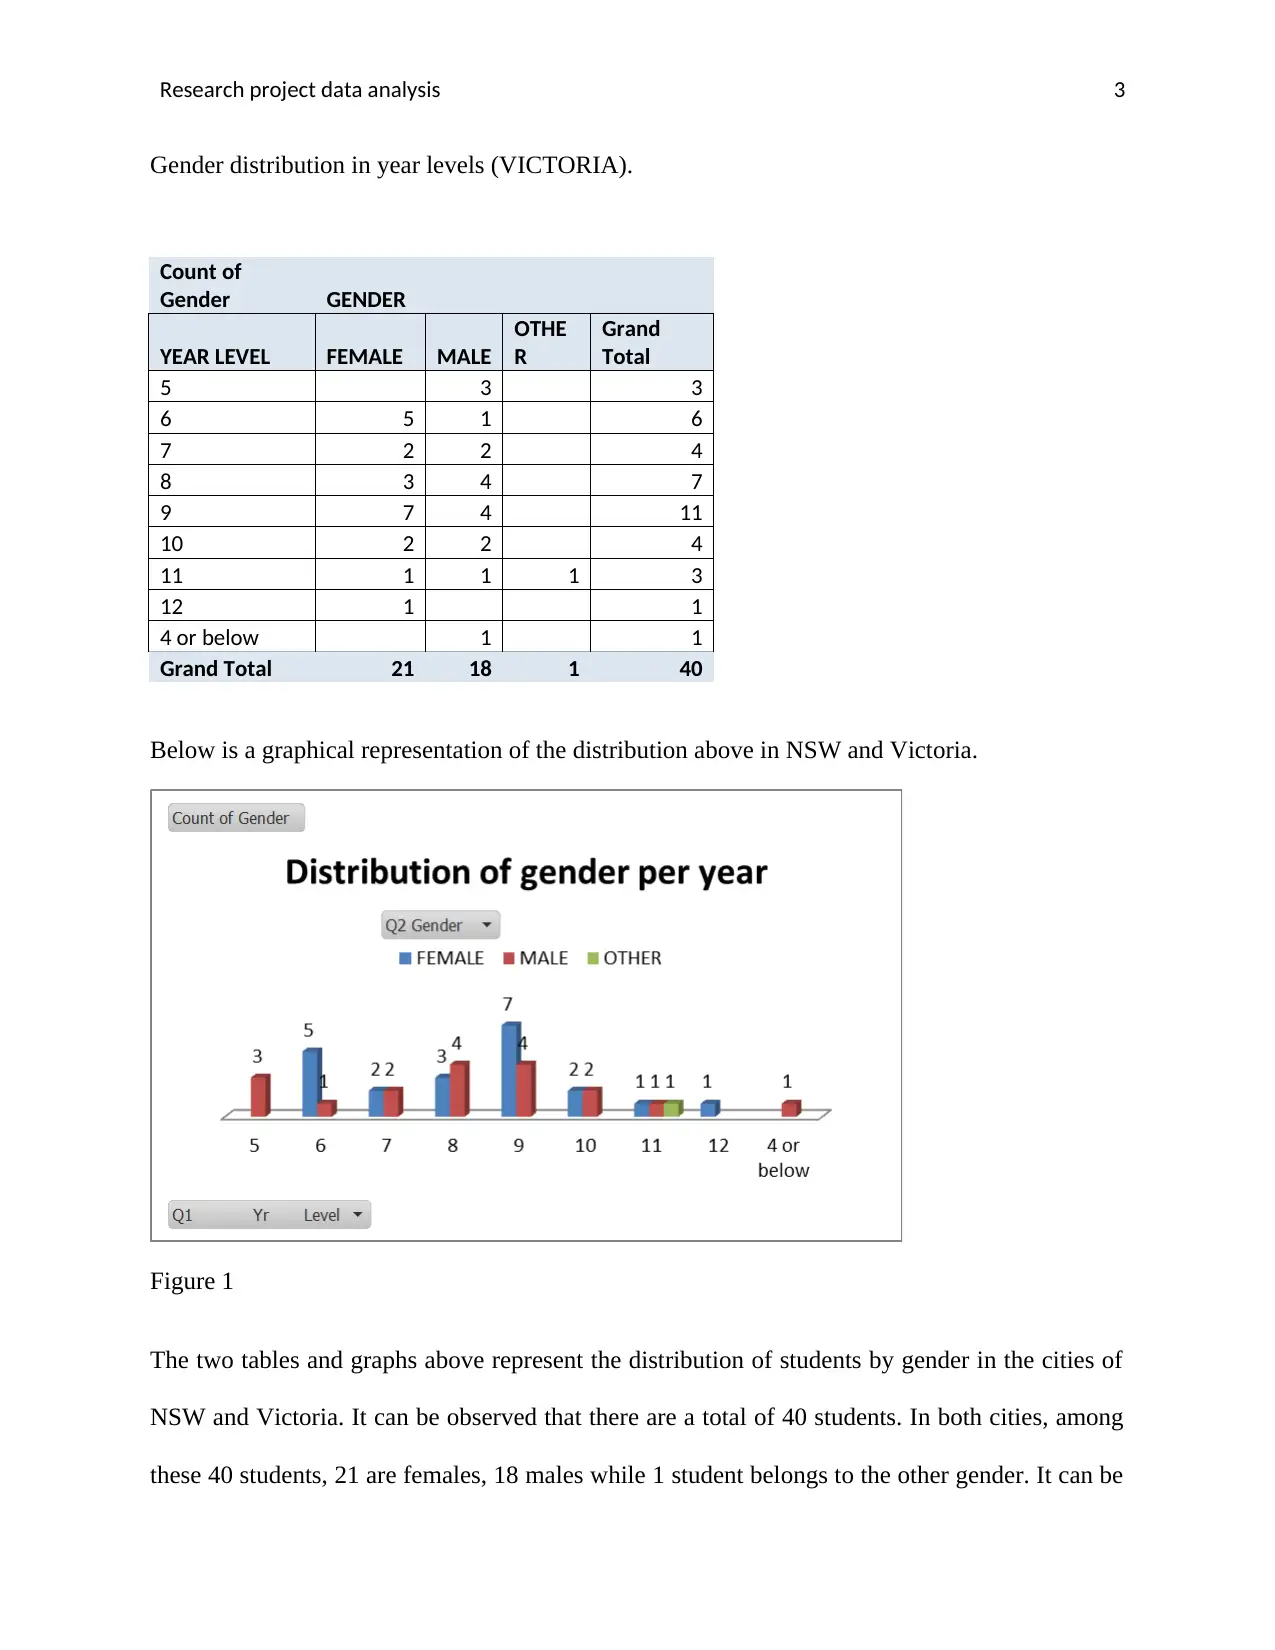
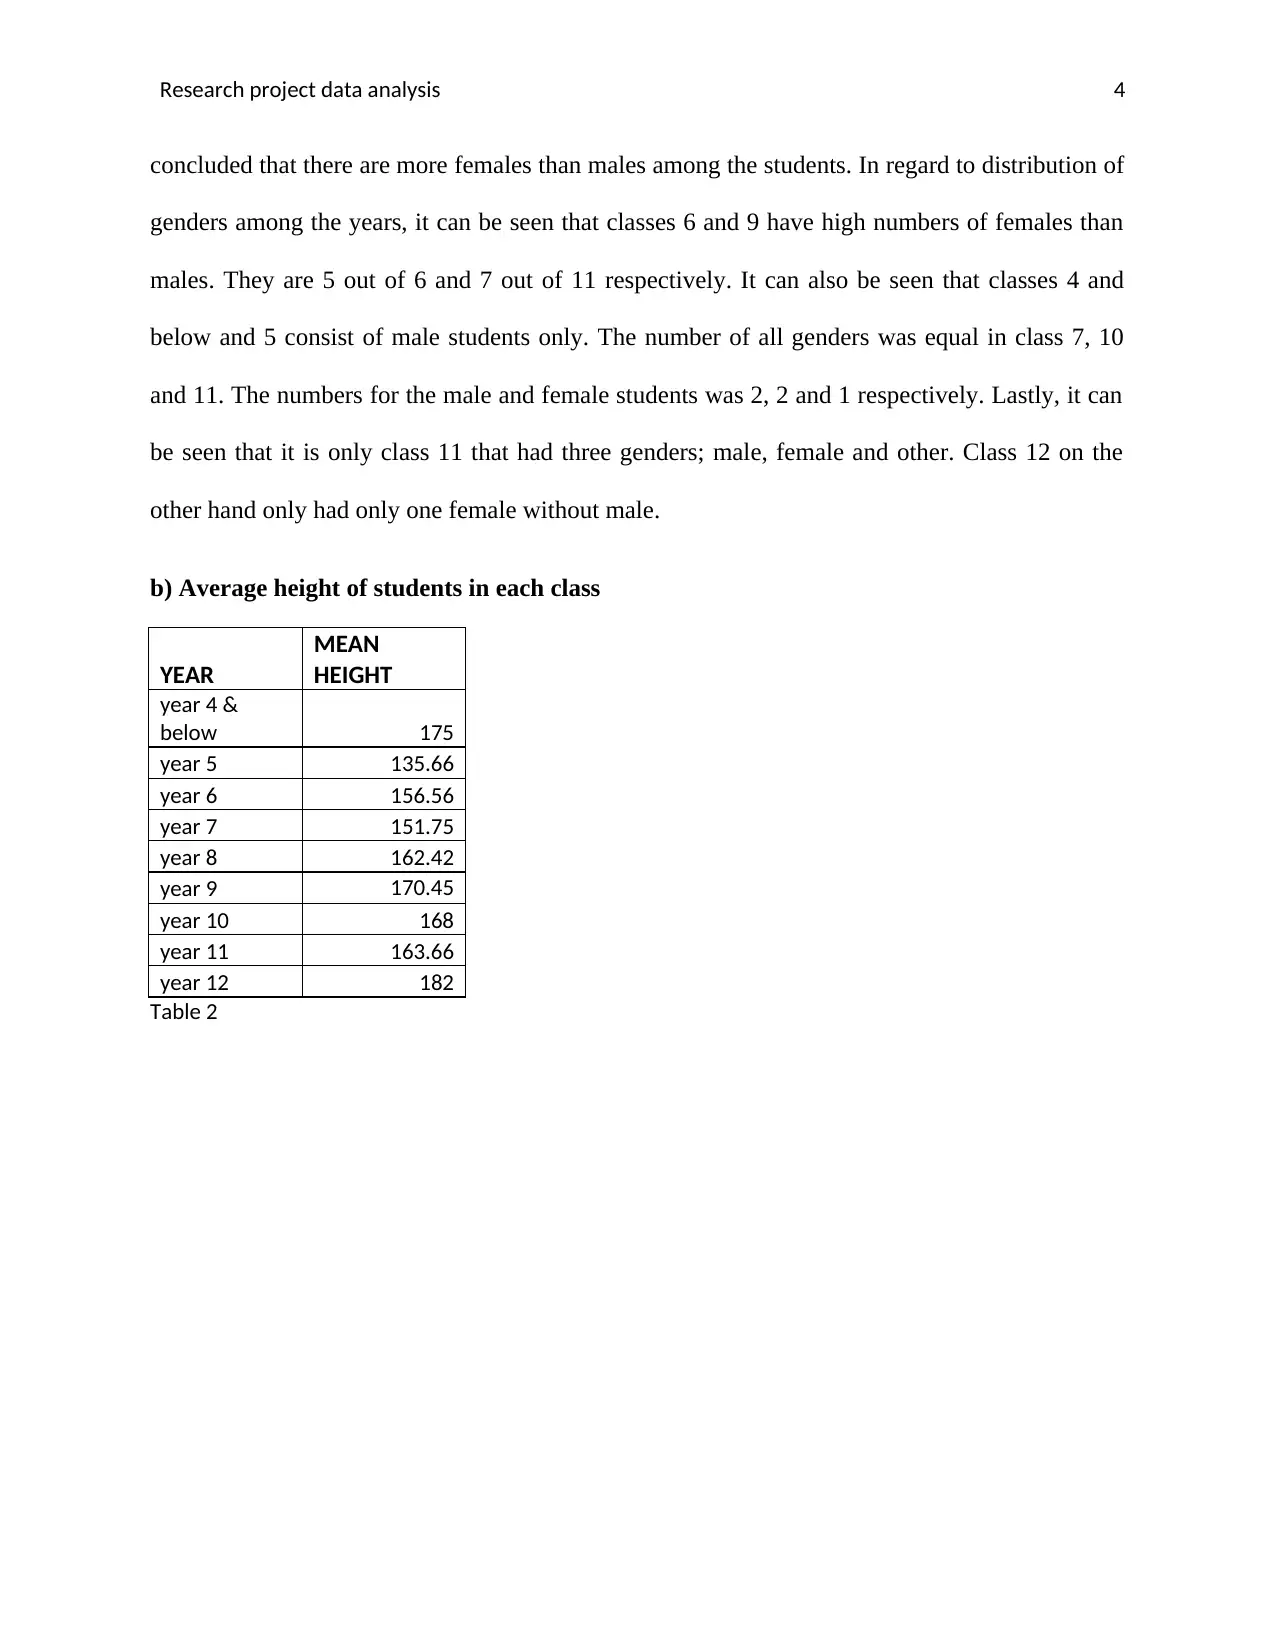
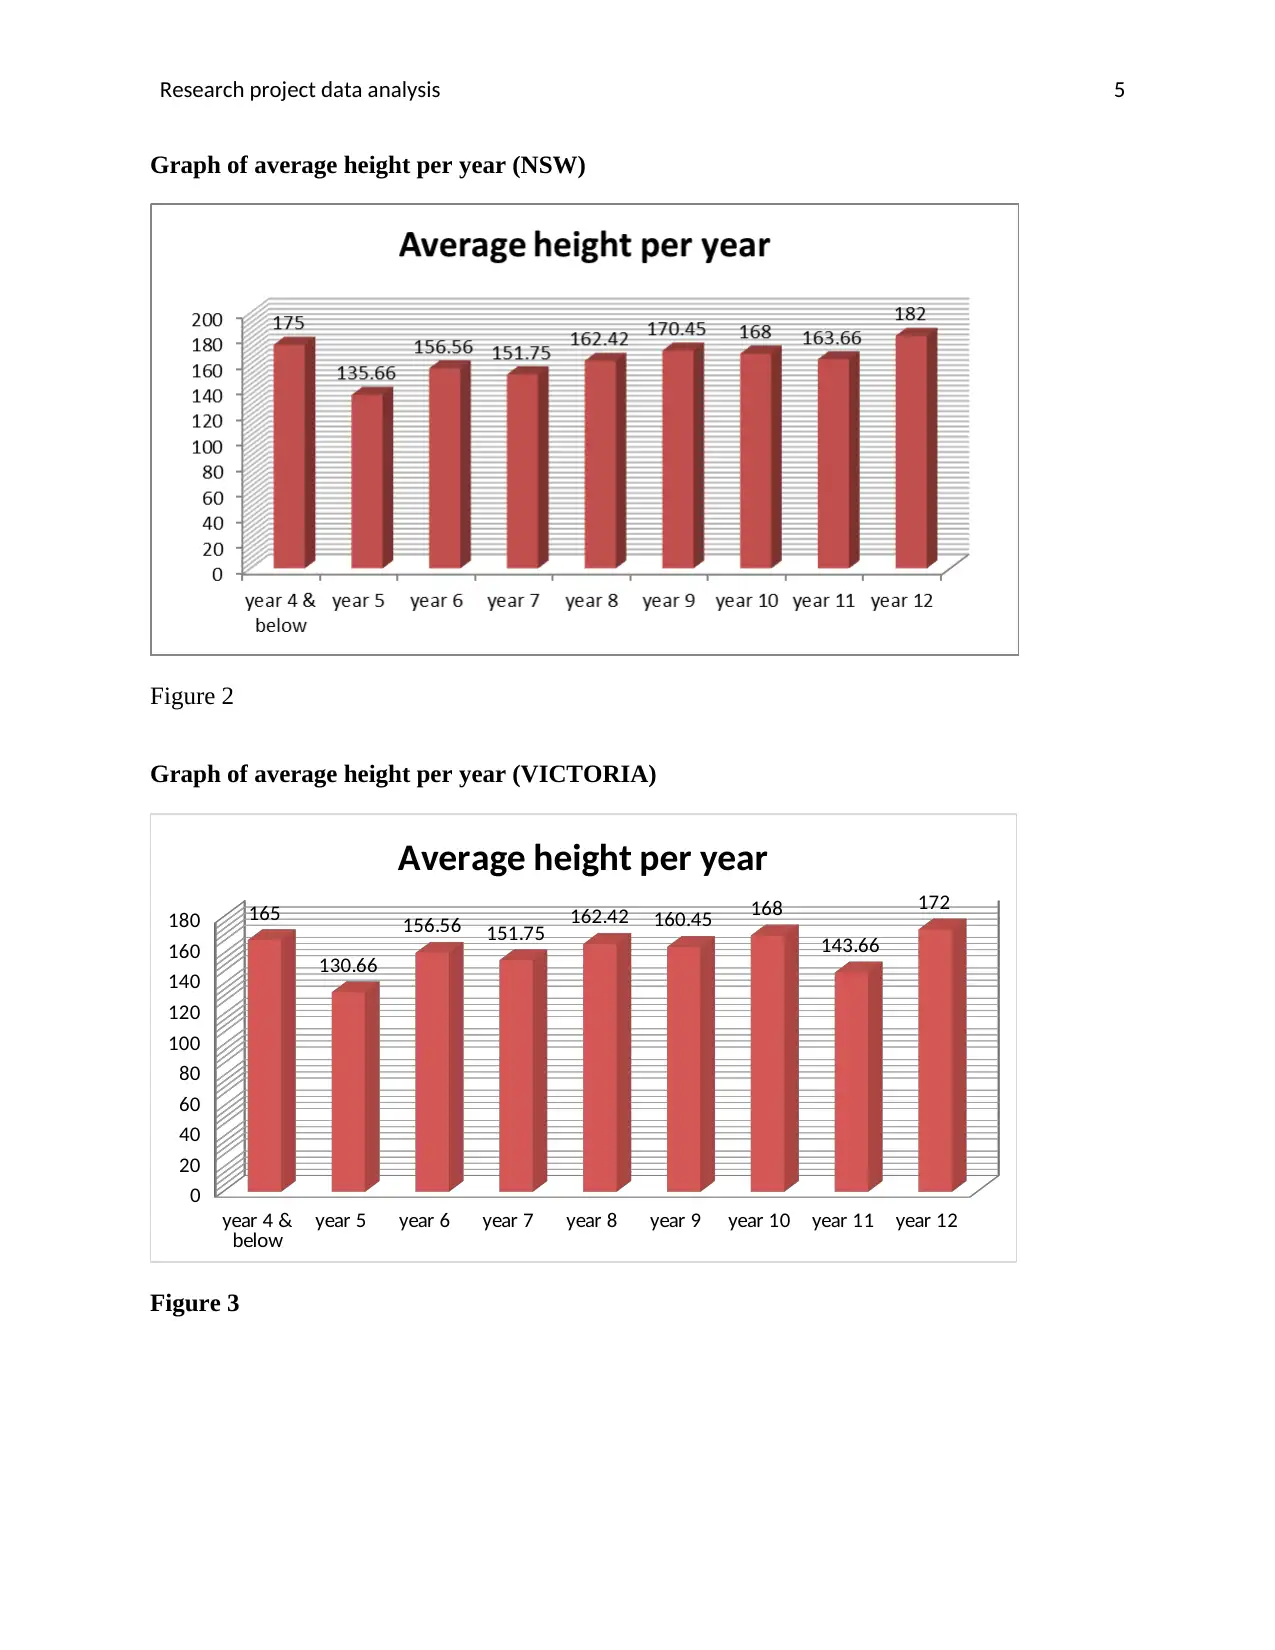
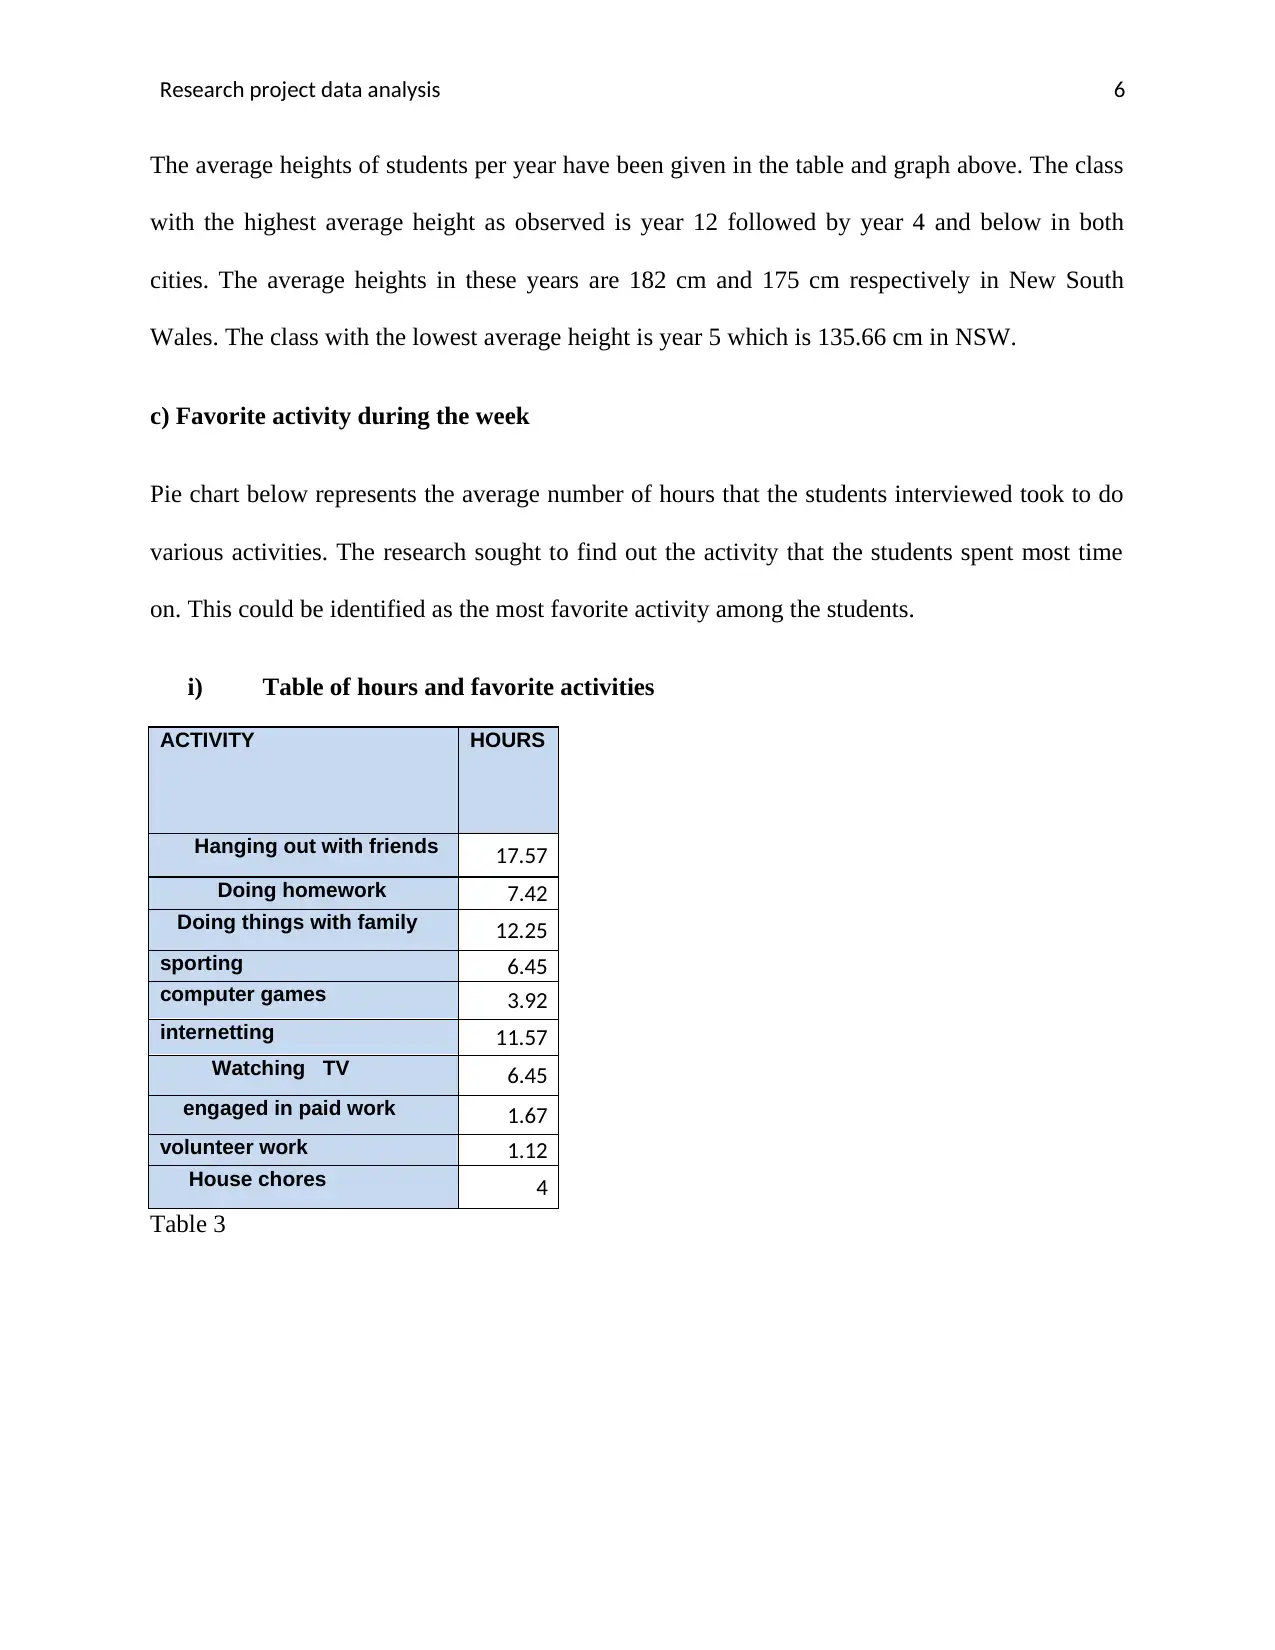
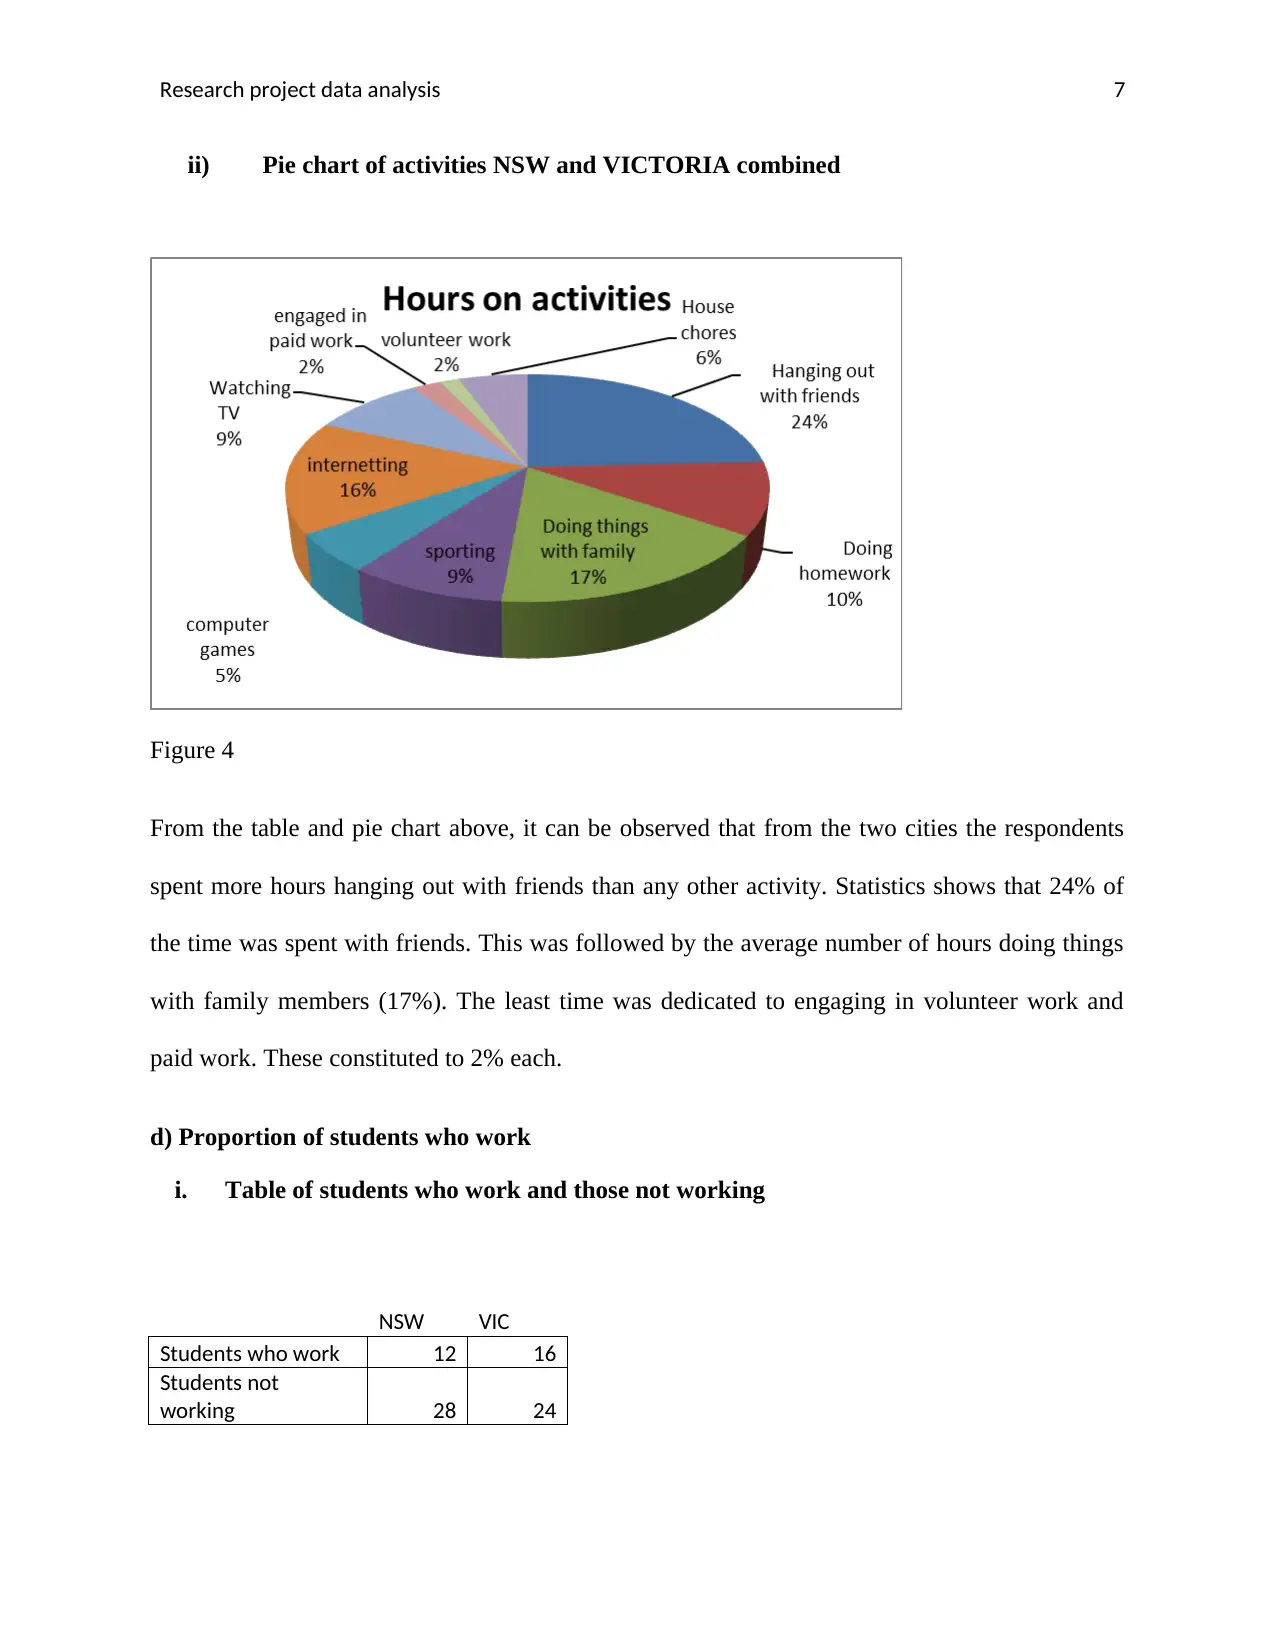
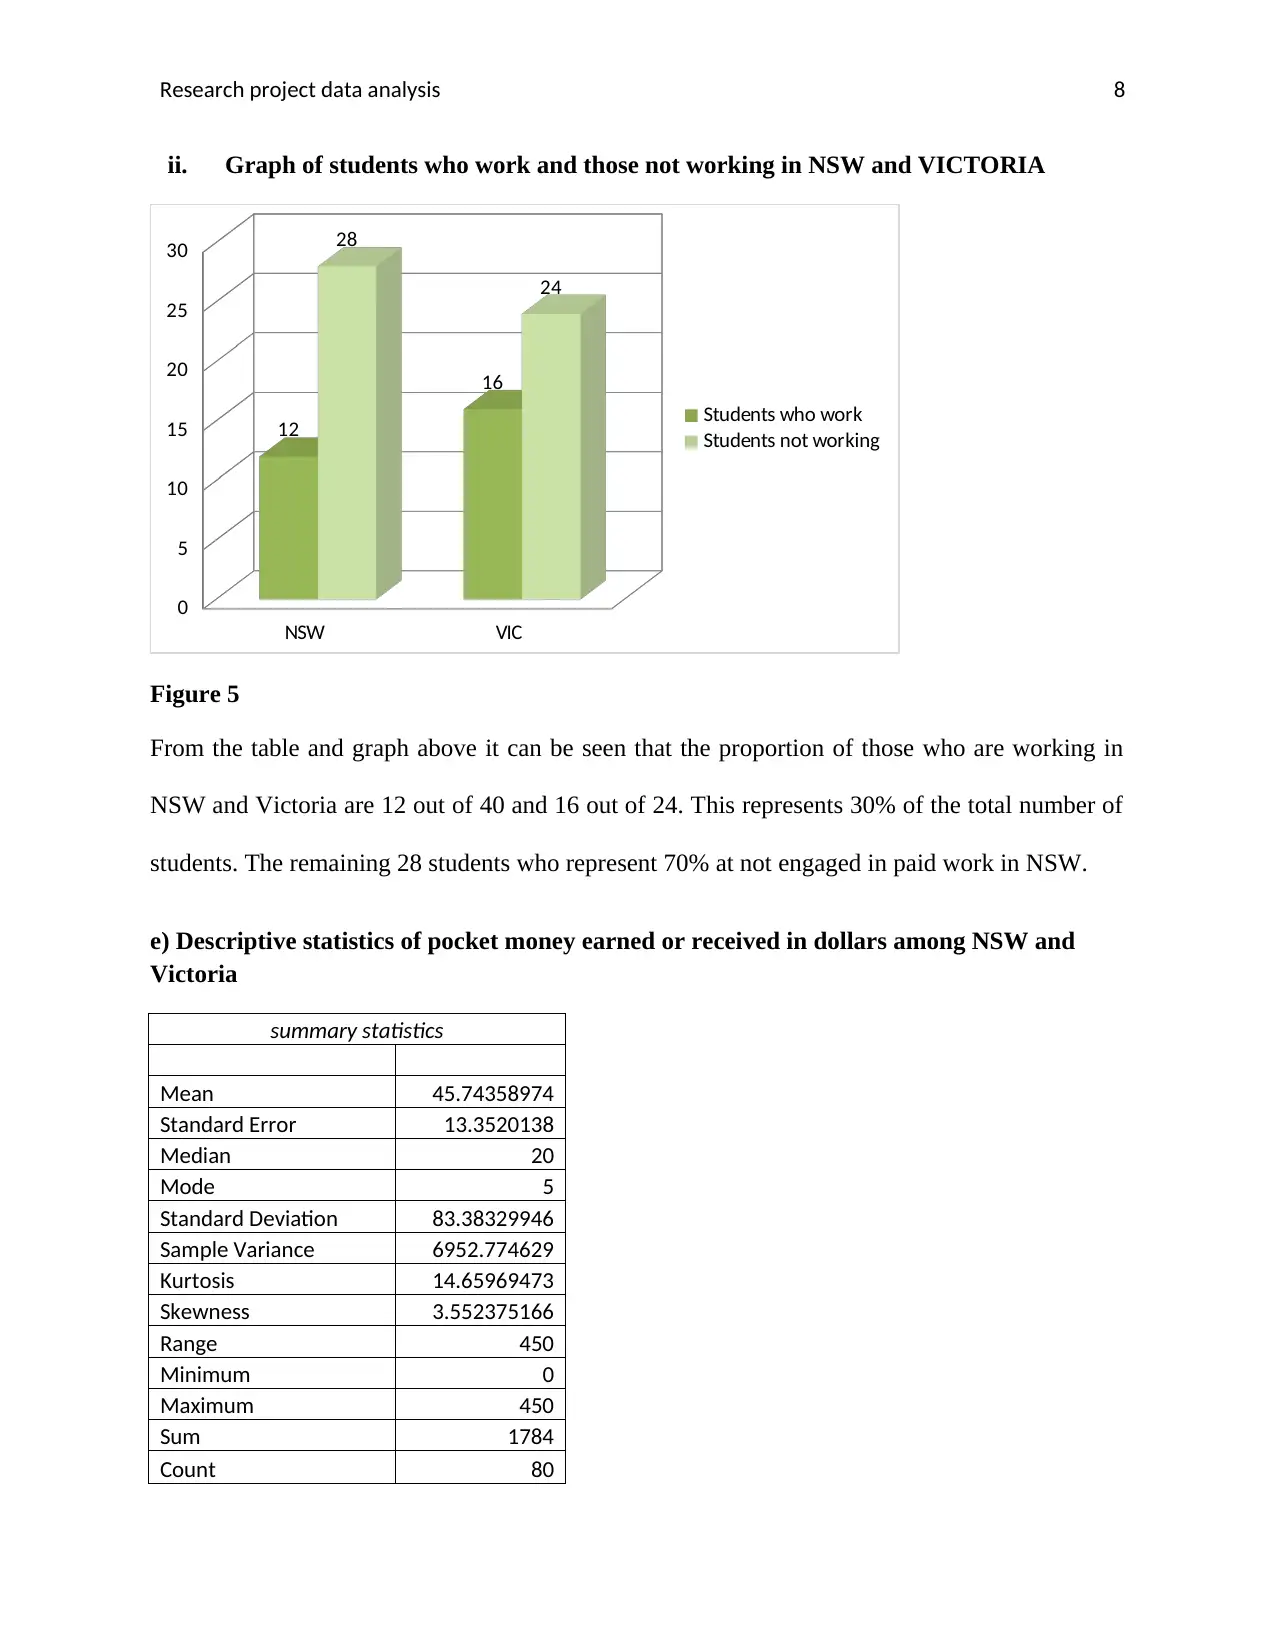
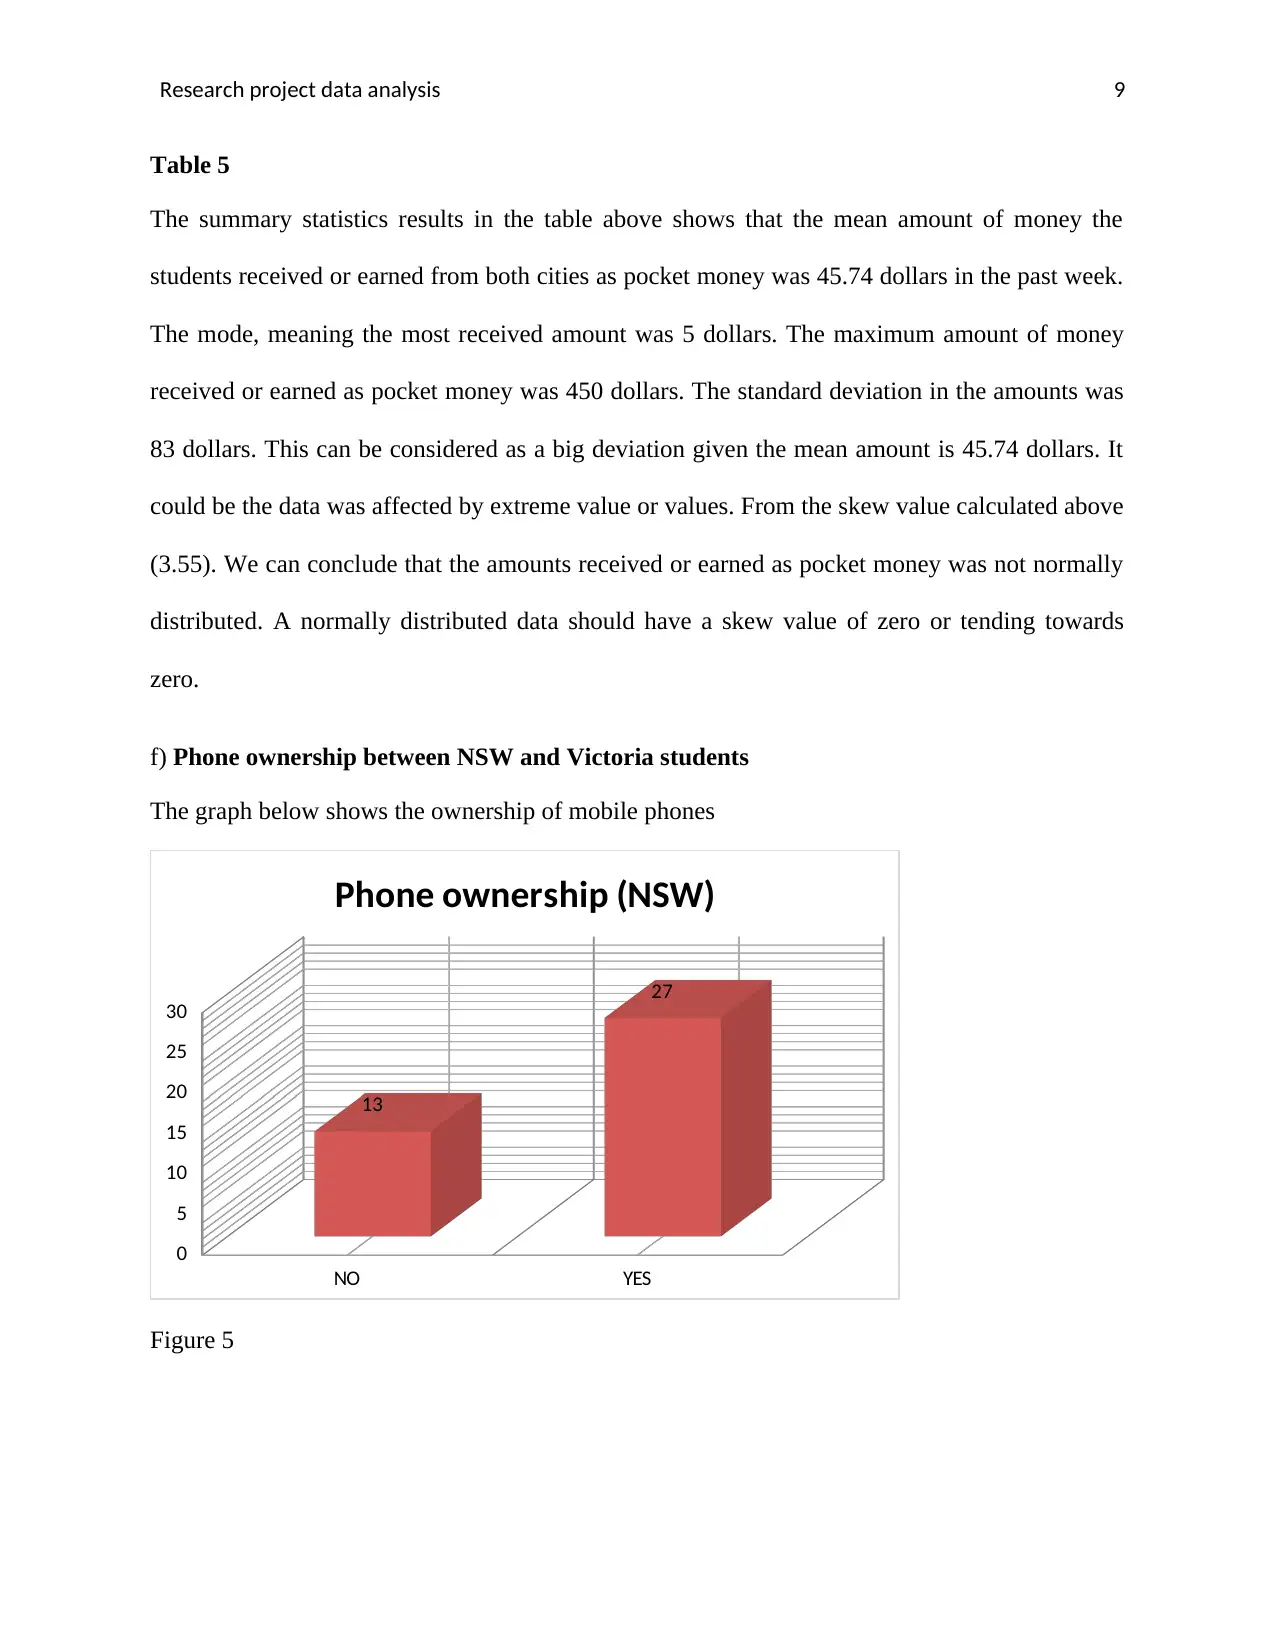
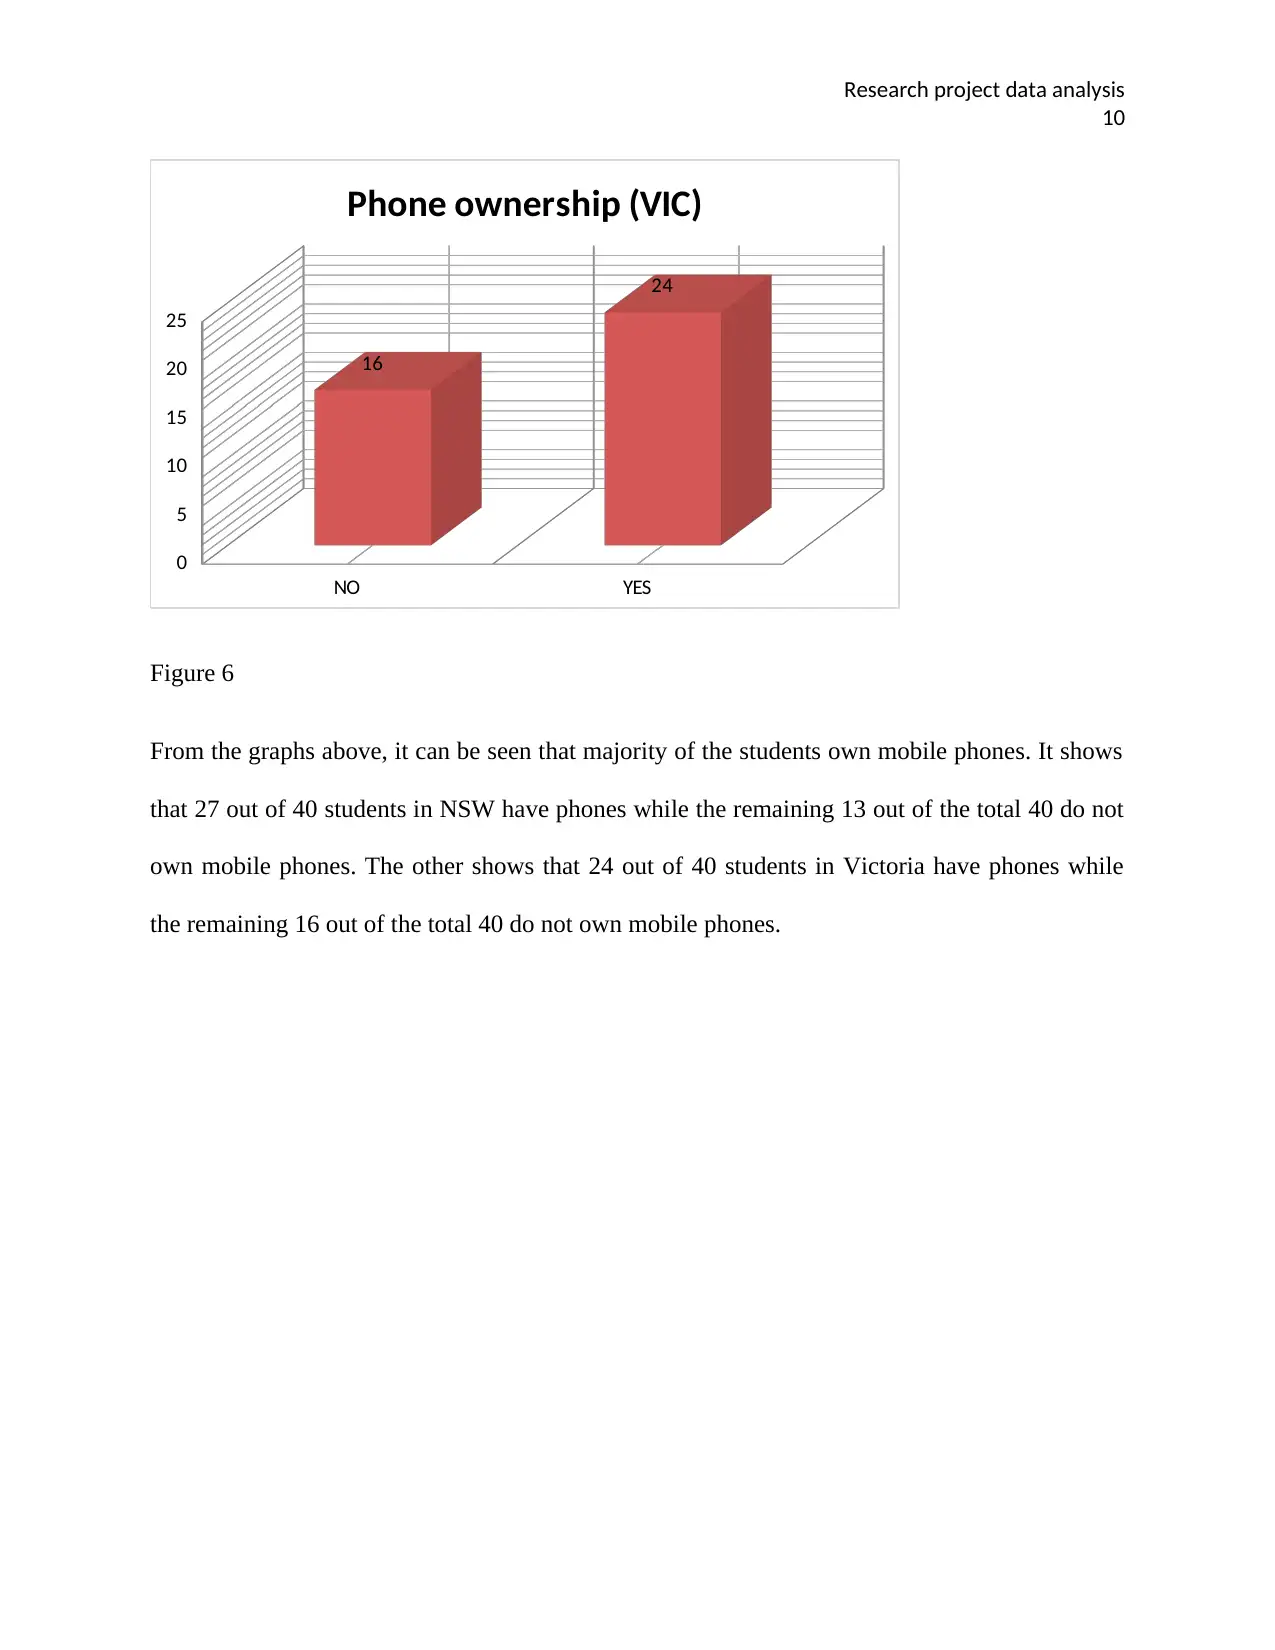
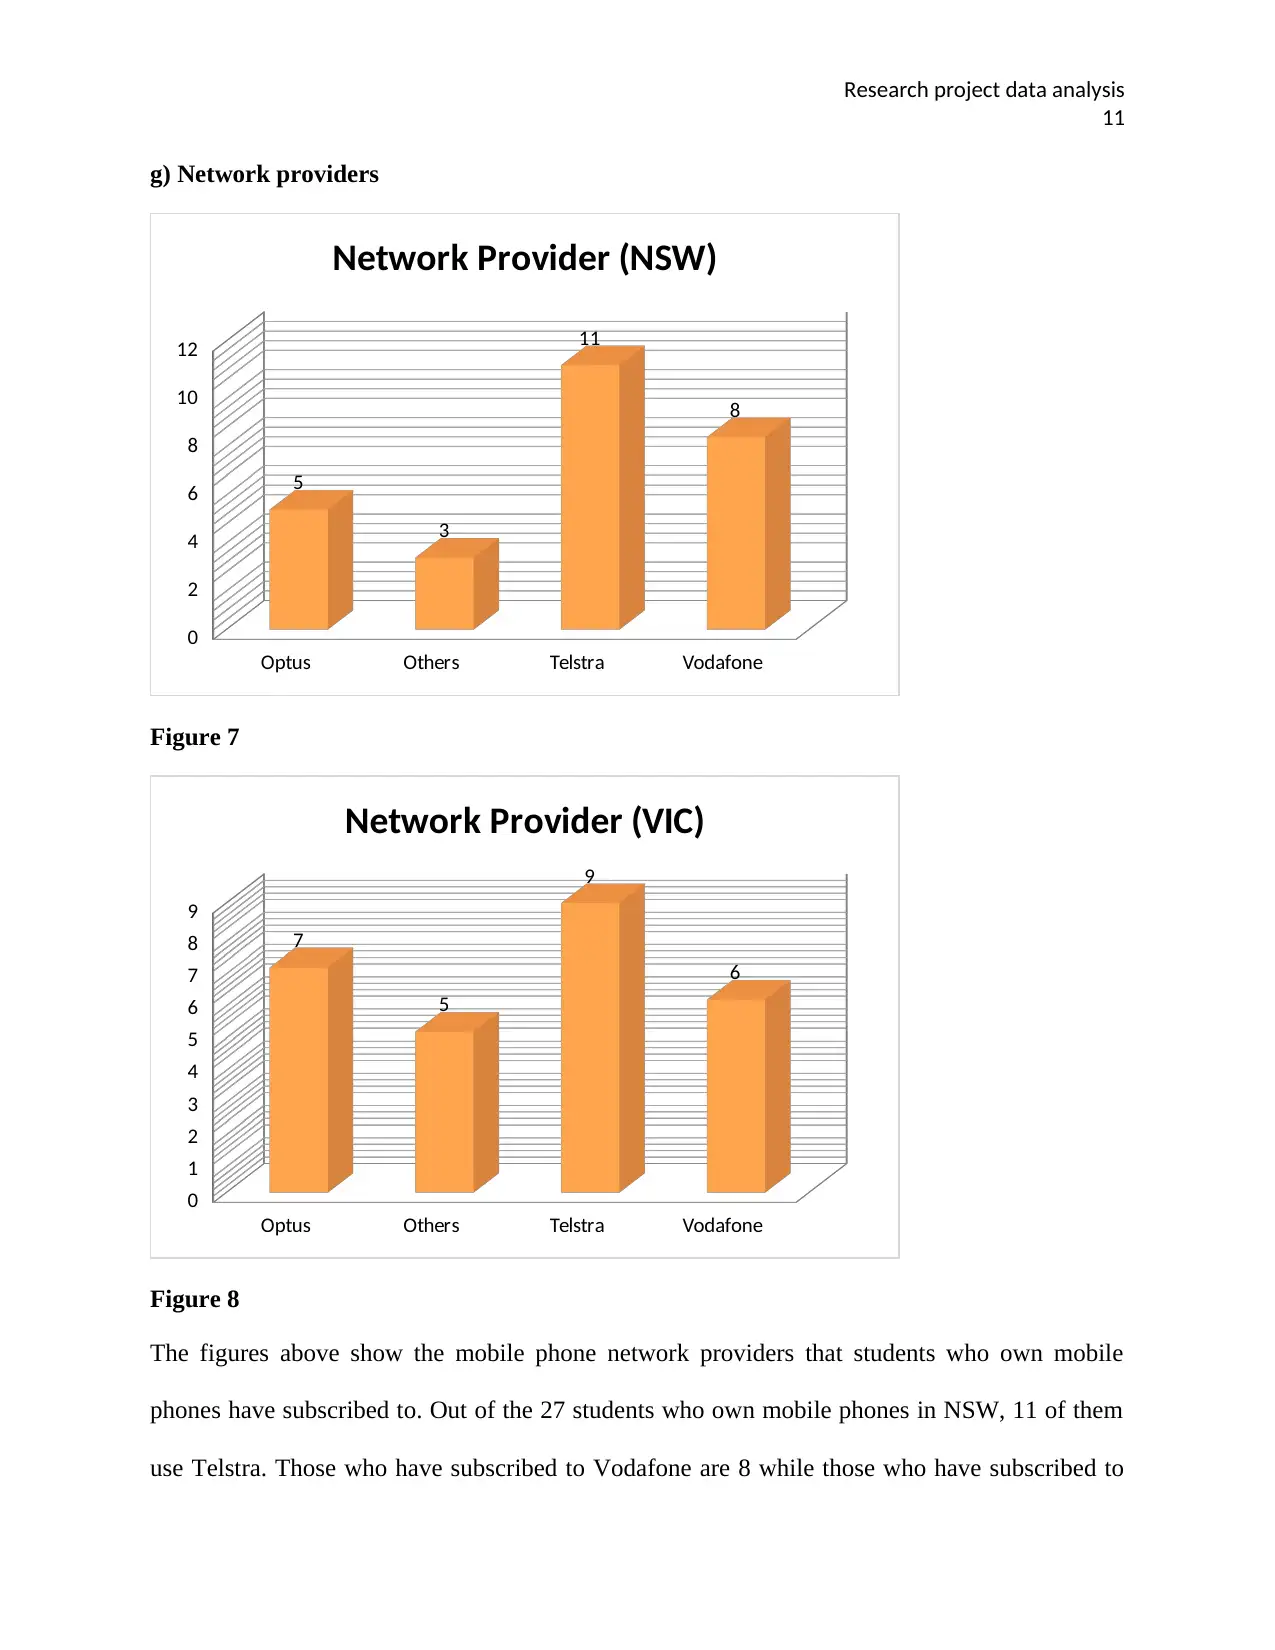
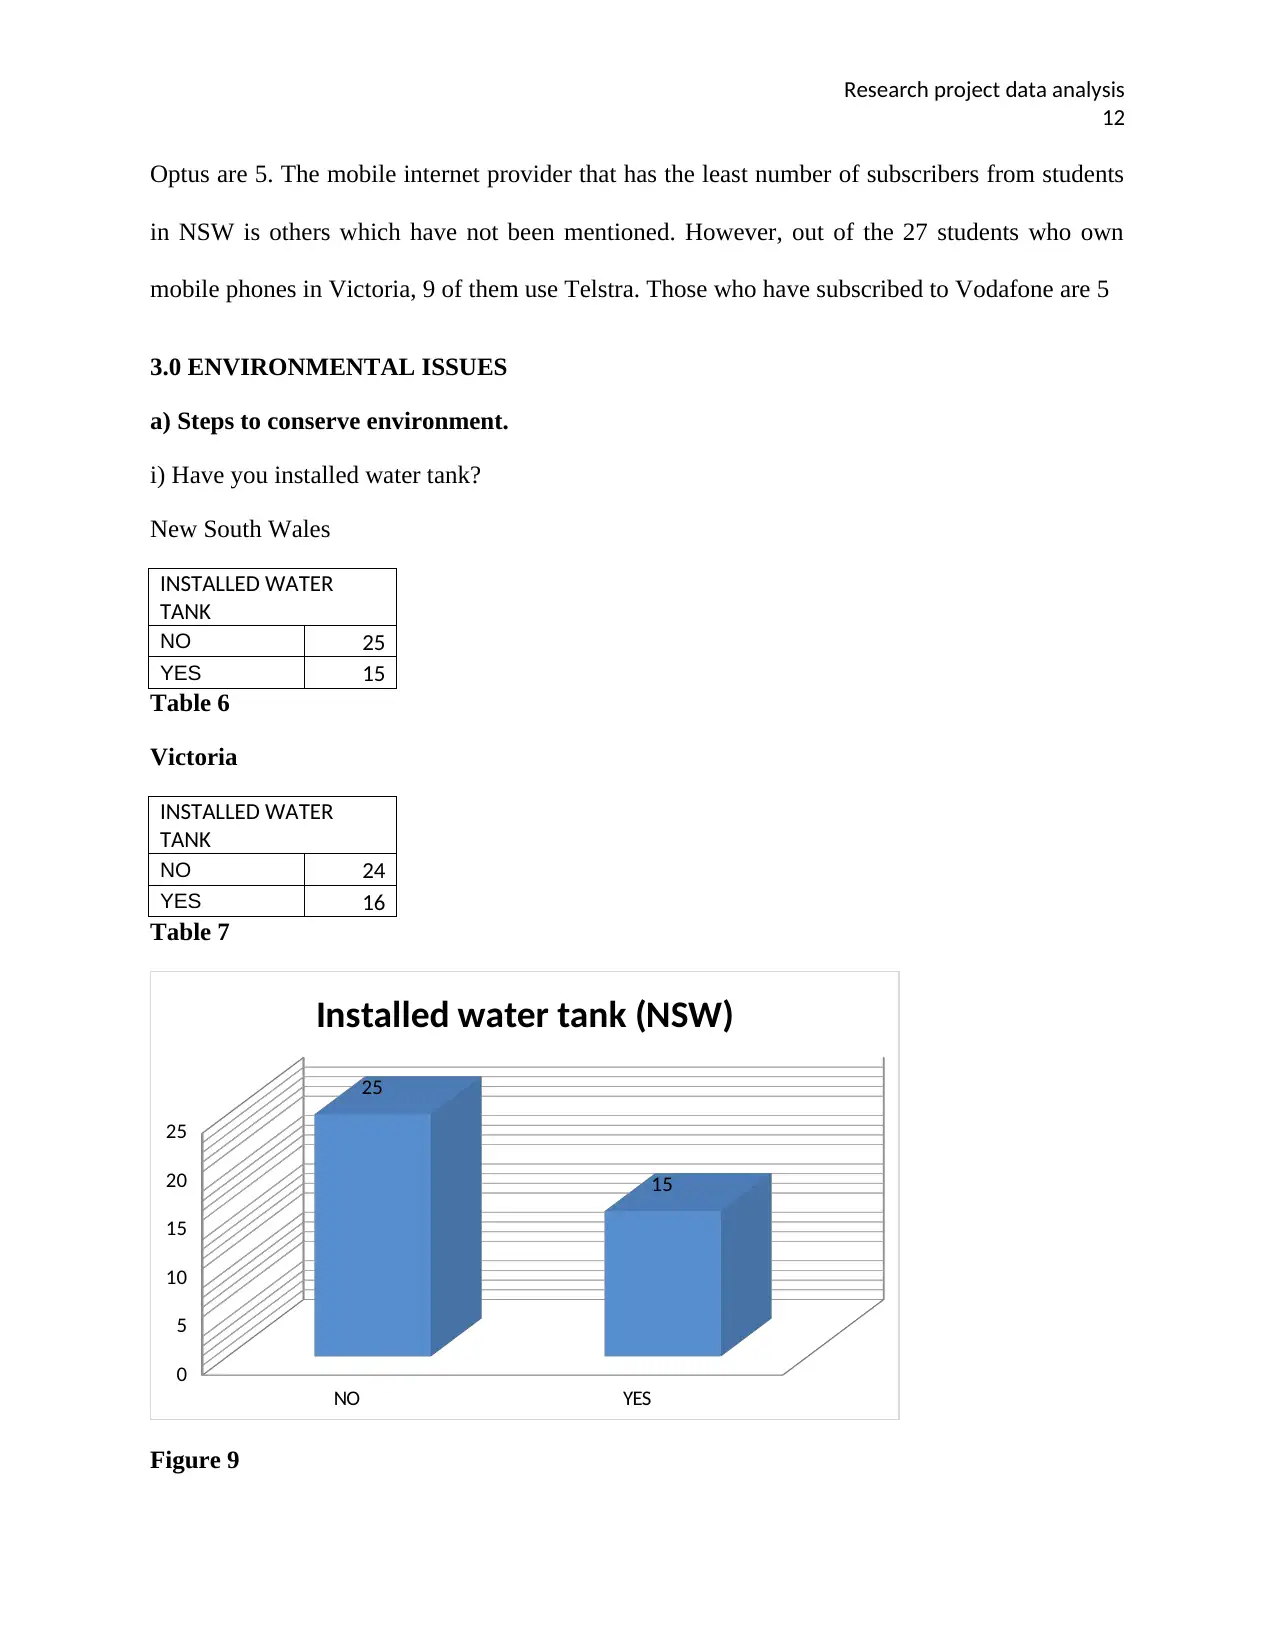
This research project investigated student attitudes towards environmental issues, specifically conservation, in New South Wales and Victoria. Data was collected through questionnaires, encompassing both numerical and categorical variables. The analysis employed descriptive statistics (mean, mode, median, standard deviation, variance) and inferential statistics (simple regression). Key findings include gender distribution across year levels, average student heights, favorite weekly activities (with hanging out with friends being the most popular), and the proportion of students engaged in paid work. The report also examined phone ownership, network provider preferences, and student responses to environmental conservation measures like water tank installation, shower habits, and recycling practices. Students generally rated pollution reduction, recycling, and water conservation as important. The report provides a comprehensive overview of the data, including tables, graphs, and statistical summaries, to understand student awareness and engagement with environmental issues.
Document Page
Research project data analysis 1
Name:
Institution:
Date:
tabler-icon-diamond-filled.svg

Paraphrase This Document

Need a fresh take? Get an instant paraphrase of this document with our AI Paraphraser
Document Page
Research project data analysis 2
1.0 INTRODUCTION
This research project was aimed at establishing how students reacted to various environmental
issues more so conservation in the cities of New South Wales and Victoria. Questionnaire was
used to collect data from the students. The use of questionnaire was appropriate as the number of
respondents was not large and it was also easy to distribute. The data involved in this research
project was both numerical and categorical. Numerical data included the heights of students,
amounts of money students earned as pocket money just to mention but a few. The categorical
variables included gender and year of study. Quantitative data was appropriate so that analyses
such as descriptive statistics on various variables of interest could be possible. Both descriptive
statistics and inferential statistics were employed in the analysis. In descriptive statistics,
measures of central tendencies such as mean, mode and median were used. Measures of
dispersion such as standard deviation and variance were used to analyze the data. Inferential
statistics such as simple regression analysis was used to establish relationship between variables.
2.0 DATA ANALYSIS
a) Gender distribution in year levels (NSW).
Count of
Gender GENDER
YEAR LEVEL FEMALE MALE
OTHE
R
Grand
Total
5 3 3
6 5 1 6
7 2 2 4
8 3 4 7
9 7 4 11
10 2 2 4
11 1 1 1 3
12 1 1
4 or below 1 1
Grand Total 21 18 1 40
Table 1
Document Page
Research project data analysis 3
Gender distribution in year levels (VICTORIA).
Count of
Gender GENDER
YEAR LEVEL FEMALE MALE
OTHE
R
Grand
Total
5 3 3
6 5 1 6
7 2 2 4
8 3 4 7
9 7 4 11
10 2 2 4
11 1 1 1 3
12 1 1
4 or below 1 1
Grand Total 21 18 1 40
Below is a graphical representation of the distribution above in NSW and Victoria.
Figure 1
The two tables and graphs above represent the distribution of students by gender in the cities of
NSW and Victoria. It can be observed that there are a total of 40 students. In both cities, among
these 40 students, 21 are females, 18 males while 1 student belongs to the other gender. It can be
Document Page
Research project data analysis 4
concluded that there are more females than males among the students. In regard to distribution of
genders among the years, it can be seen that classes 6 and 9 have high numbers of females than
males. They are 5 out of 6 and 7 out of 11 respectively. It can also be seen that classes 4 and
below and 5 consist of male students only. The number of all genders was equal in class 7, 10
and 11. The numbers for the male and female students was 2, 2 and 1 respectively. Lastly, it can
be seen that it is only class 11 that had three genders; male, female and other. Class 12 on the
other hand only had only one female without male.
b) Average height of students in each class
YEAR
MEAN
HEIGHT
year 4 &
below 175
year 5 135.66
year 6 156.56
year 7 151.75
year 8 162.42
year 9 170.45
year 10 168
year 11 163.66
year 12 182
Table 2
tabler-icon-diamond-filled.svg

Paraphrase This Document

Need a fresh take? Get an instant paraphrase of this document with our AI Paraphraser
Document Page
Research project data analysis 5
Graph of average height per year (NSW)
Figure 2
Graph of average height per year (VICTORIA)
year 4 &
below year 5 year 6 year 7 year 8 year 9 year 10 year 11 year 12
0
20
40
60
80
100
120
140
160
180 165
130.66
156.56 151.75 162.42 160.45 168
143.66
172
Average height per year
Figure 3
Document Page
Research project data analysis 6
The average heights of students per year have been given in the table and graph above. The class
with the highest average height as observed is year 12 followed by year 4 and below in both
cities. The average heights in these years are 182 cm and 175 cm respectively in New South
Wales. The class with the lowest average height is year 5 which is 135.66 cm in NSW.
c) Favorite activity during the week
Pie chart below represents the average number of hours that the students interviewed took to do
various activities. The research sought to find out the activity that the students spent most time
on. This could be identified as the most favorite activity among the students.
i) Table of hours and favorite activities
ACTIVITY HOURS
Hanging out with friends 17.57
Doing homework 7.42
Doing things with family 12.25
sporting 6.45
computer games 3.92
internetting 11.57
Watching TV 6.45
engaged in paid work 1.67
volunteer work 1.12
House chores 4
Table 3
Document Page
Research project data analysis 7
ii) Pie chart of activities NSW and VICTORIA combined
Figure 4
From the table and pie chart above, it can be observed that from the two cities the respondents
spent more hours hanging out with friends than any other activity. Statistics shows that 24% of
the time was spent with friends. This was followed by the average number of hours doing things
with family members (17%). The least time was dedicated to engaging in volunteer work and
paid work. These constituted to 2% each.
d) Proportion of students who work
i. Table of students who work and those not working
NSW VIC
Students who work 12 16
Students not
working 28 24
tabler-icon-diamond-filled.svg

Paraphrase This Document

Need a fresh take? Get an instant paraphrase of this document with our AI Paraphraser
Document Page
Research project data analysis 8
ii. Graph of students who work and those not working in NSW and VICTORIA
NSW VIC
0
5
10
15
20
25
30
12
16
28
24
Students who work
Students not working
Figure 5
From the table and graph above it can be seen that the proportion of those who are working in
NSW and Victoria are 12 out of 40 and 16 out of 24. This represents 30% of the total number of
students. The remaining 28 students who represent 70% at not engaged in paid work in NSW.
e) Descriptive statistics of pocket money earned or received in dollars among NSW and
Victoria
summary statistics
Mean 45.74358974
Standard Error 13.3520138
Median 20
Mode 5
Standard Deviation 83.38329946
Sample Variance 6952.774629
Kurtosis 14.65969473
Skewness 3.552375166
Range 450
Minimum 0
Maximum 450
Sum 1784
Count 80
Document Page
Research project data analysis 9
Table 5
The summary statistics results in the table above shows that the mean amount of money the
students received or earned from both cities as pocket money was 45.74 dollars in the past week.
The mode, meaning the most received amount was 5 dollars. The maximum amount of money
received or earned as pocket money was 450 dollars. The standard deviation in the amounts was
83 dollars. This can be considered as a big deviation given the mean amount is 45.74 dollars. It
could be the data was affected by extreme value or values. From the skew value calculated above
(3.55). We can conclude that the amounts received or earned as pocket money was not normally
distributed. A normally distributed data should have a skew value of zero or tending towards
zero.
f) Phone ownership between NSW and Victoria students
The graph below shows the ownership of mobile phones
NO YES
0
5
10
15
20
25
30
13
27
Phone ownership (NSW)
Figure 5
Document Page
Research project data analysis
10
NO YES
0
5
10
15
20
25
16
24
Phone ownership (VIC)
Figure 6
From the graphs above, it can be seen that majority of the students own mobile phones. It shows
that 27 out of 40 students in NSW have phones while the remaining 13 out of the total 40 do not
own mobile phones. The other shows that 24 out of 40 students in Victoria have phones while
the remaining 16 out of the total 40 do not own mobile phones.
tabler-icon-diamond-filled.svg

Paraphrase This Document

Need a fresh take? Get an instant paraphrase of this document with our AI Paraphraser
Document Page
Research project data analysis
11
g) Network providers
Optus Others Telstra Vodafone
0
2
4
6
8
10
12
5
3
11
8
Network Provider (NSW)
Figure 7
Optus Others Telstra Vodafone
0
1
2
3
4
5
6
7
8
9
7
5
9
6
Network Provider (VIC)
Figure 8
The figures above show the mobile phone network providers that students who own mobile
phones have subscribed to. Out of the 27 students who own mobile phones in NSW, 11 of them
use Telstra. Those who have subscribed to Vodafone are 8 while those who have subscribed to
Document Page
Research project data analysis
12
Optus are 5. The mobile internet provider that has the least number of subscribers from students
in NSW is others which have not been mentioned. However, out of the 27 students who own
mobile phones in Victoria, 9 of them use Telstra. Those who have subscribed to Vodafone are 5
3.0 ENVIRONMENTAL ISSUES
a) Steps to conserve environment.
i) Have you installed water tank?
New South Wales
INSTALLED WATER
TANK
NO 25
YES 15
Table 6
Victoria
INSTALLED WATER
TANK
NO 24
YES 16
Table 7
NO YES
0
5
10
15
20
25
25
15
Installed water tank (NSW)
Figure 9
chevron_up_icon
1 out of 23
circle_padding
hide_on_mobile
zoom_out_icon
[object Object]