Research Project: Globalization's Impact on Tesco: Regression Analysis
VerifiedAdded on 2022/11/28
|10
|1175
|155
Project
AI Summary
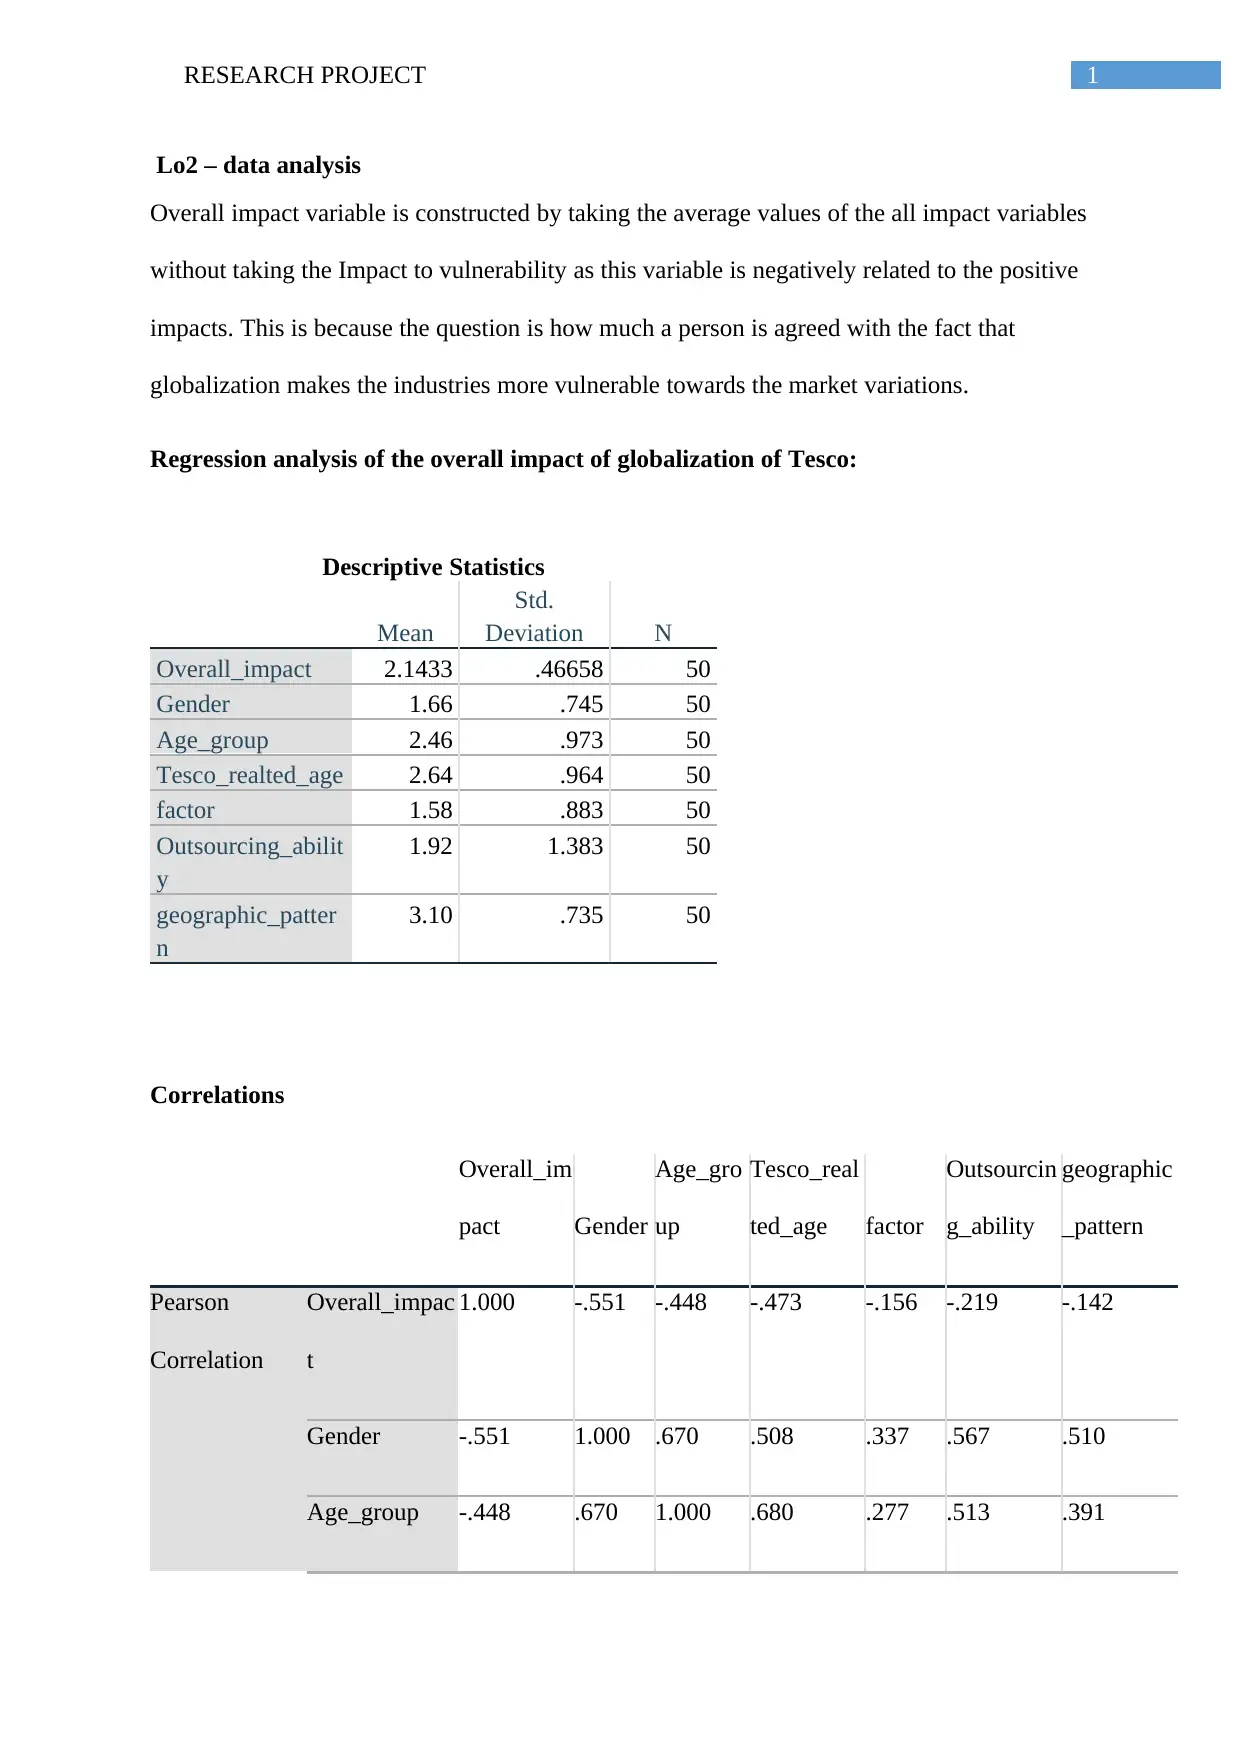
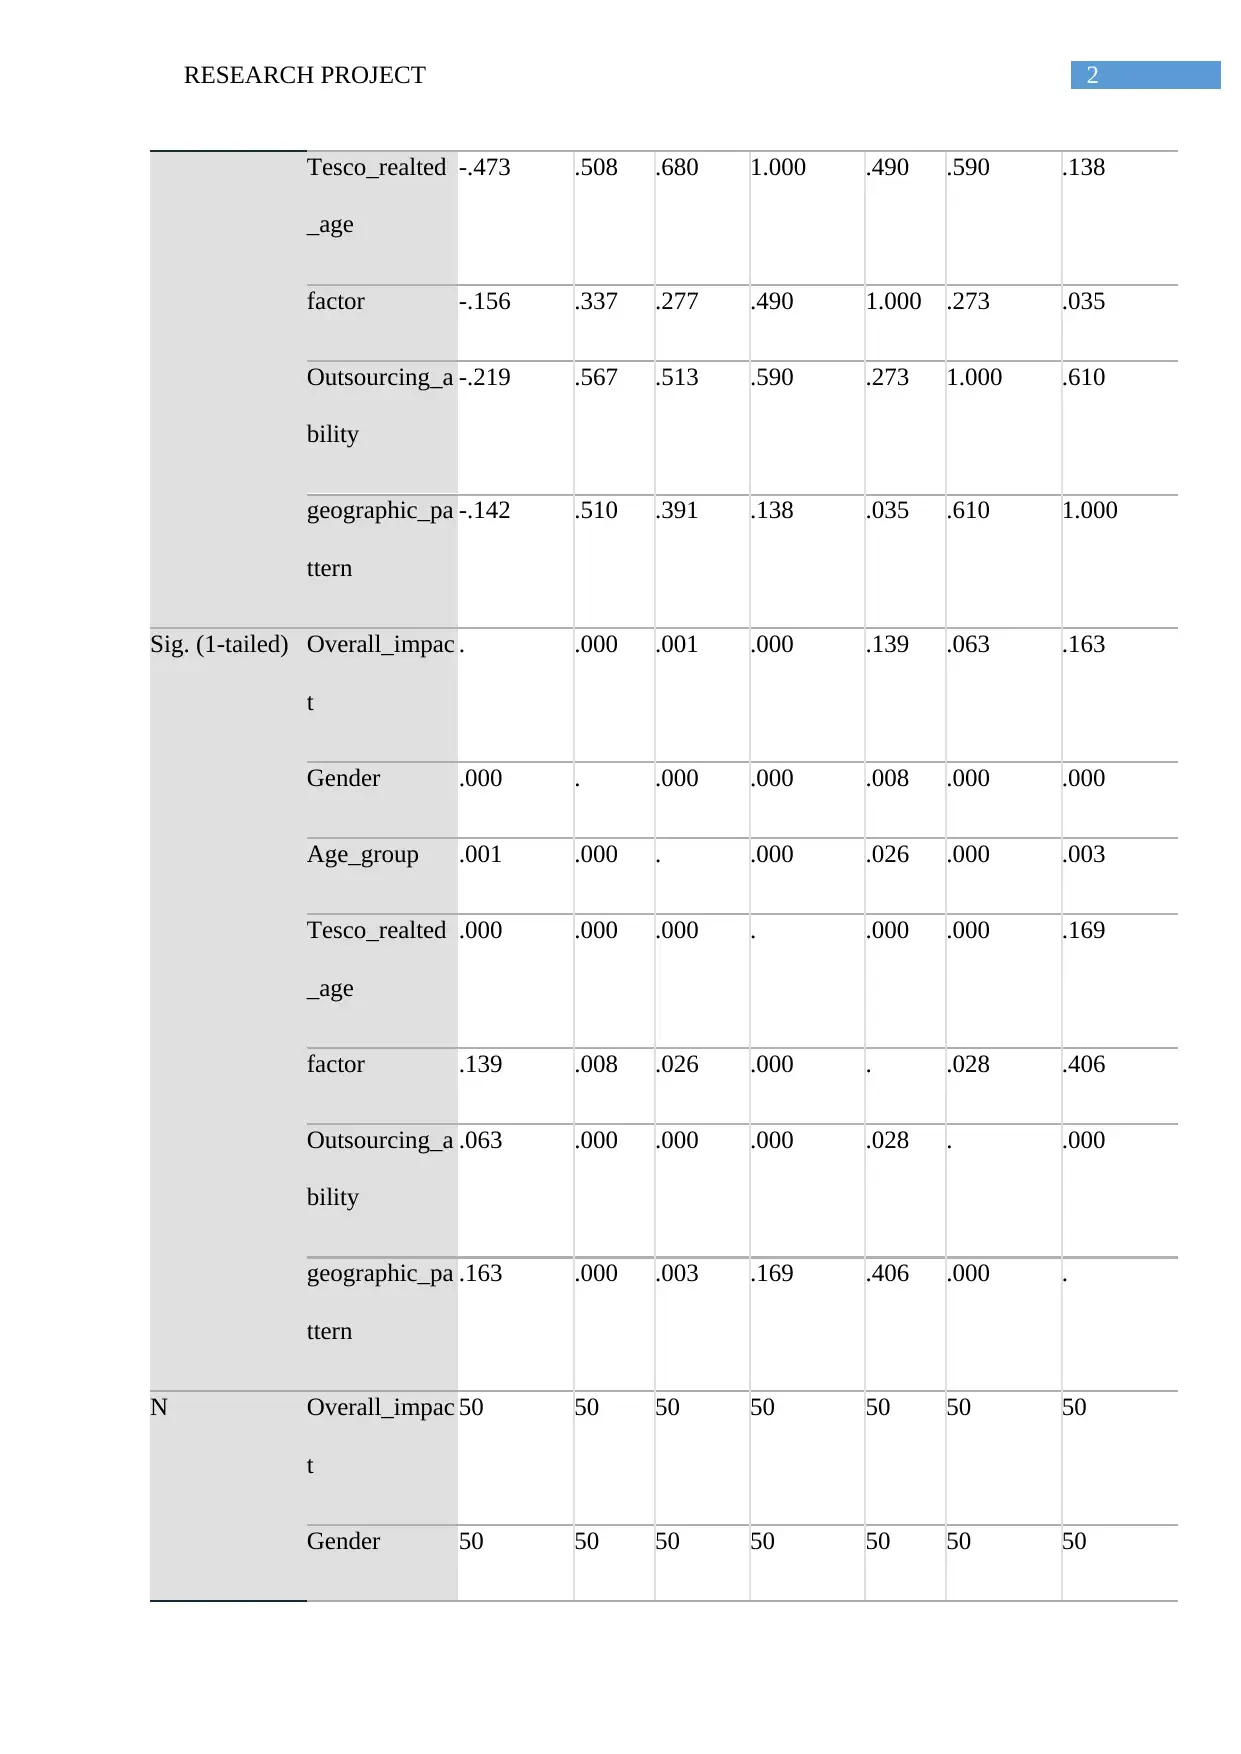
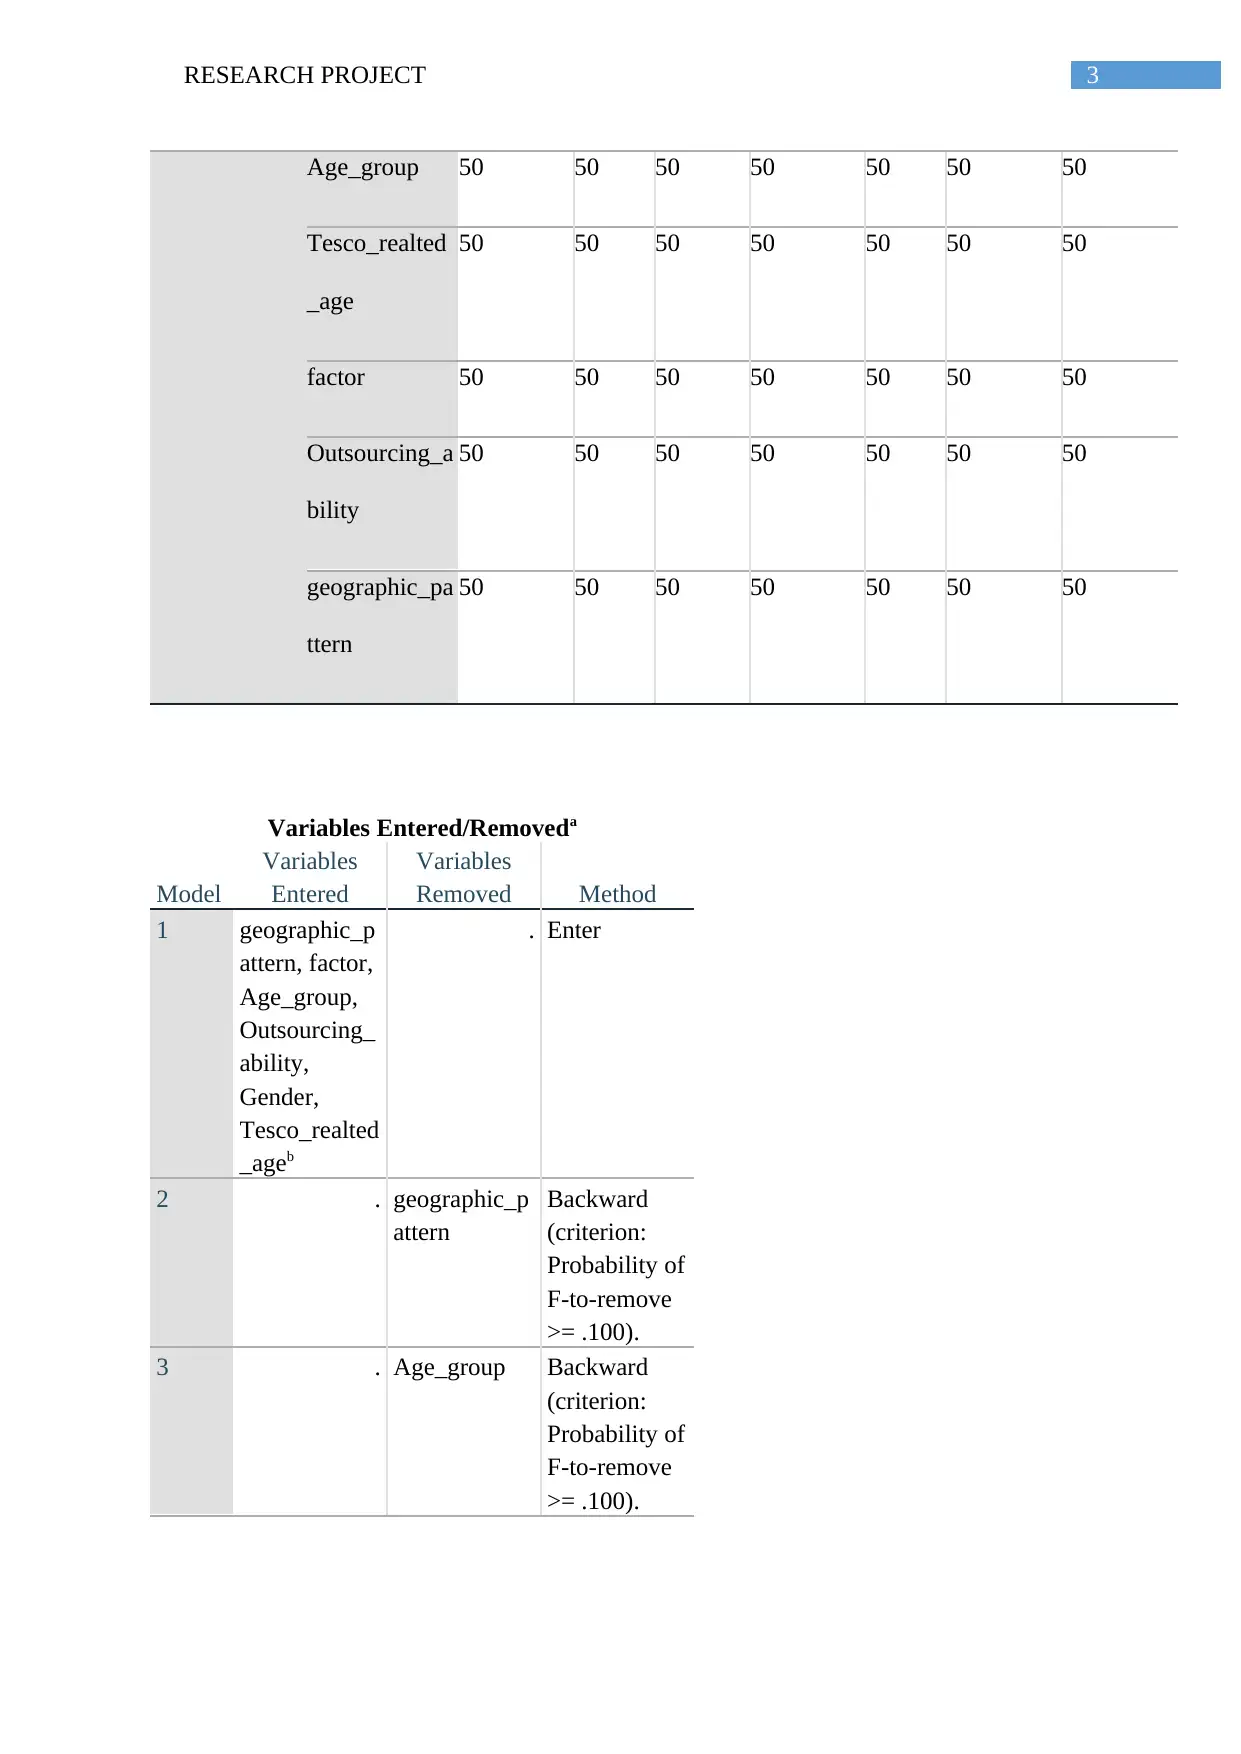
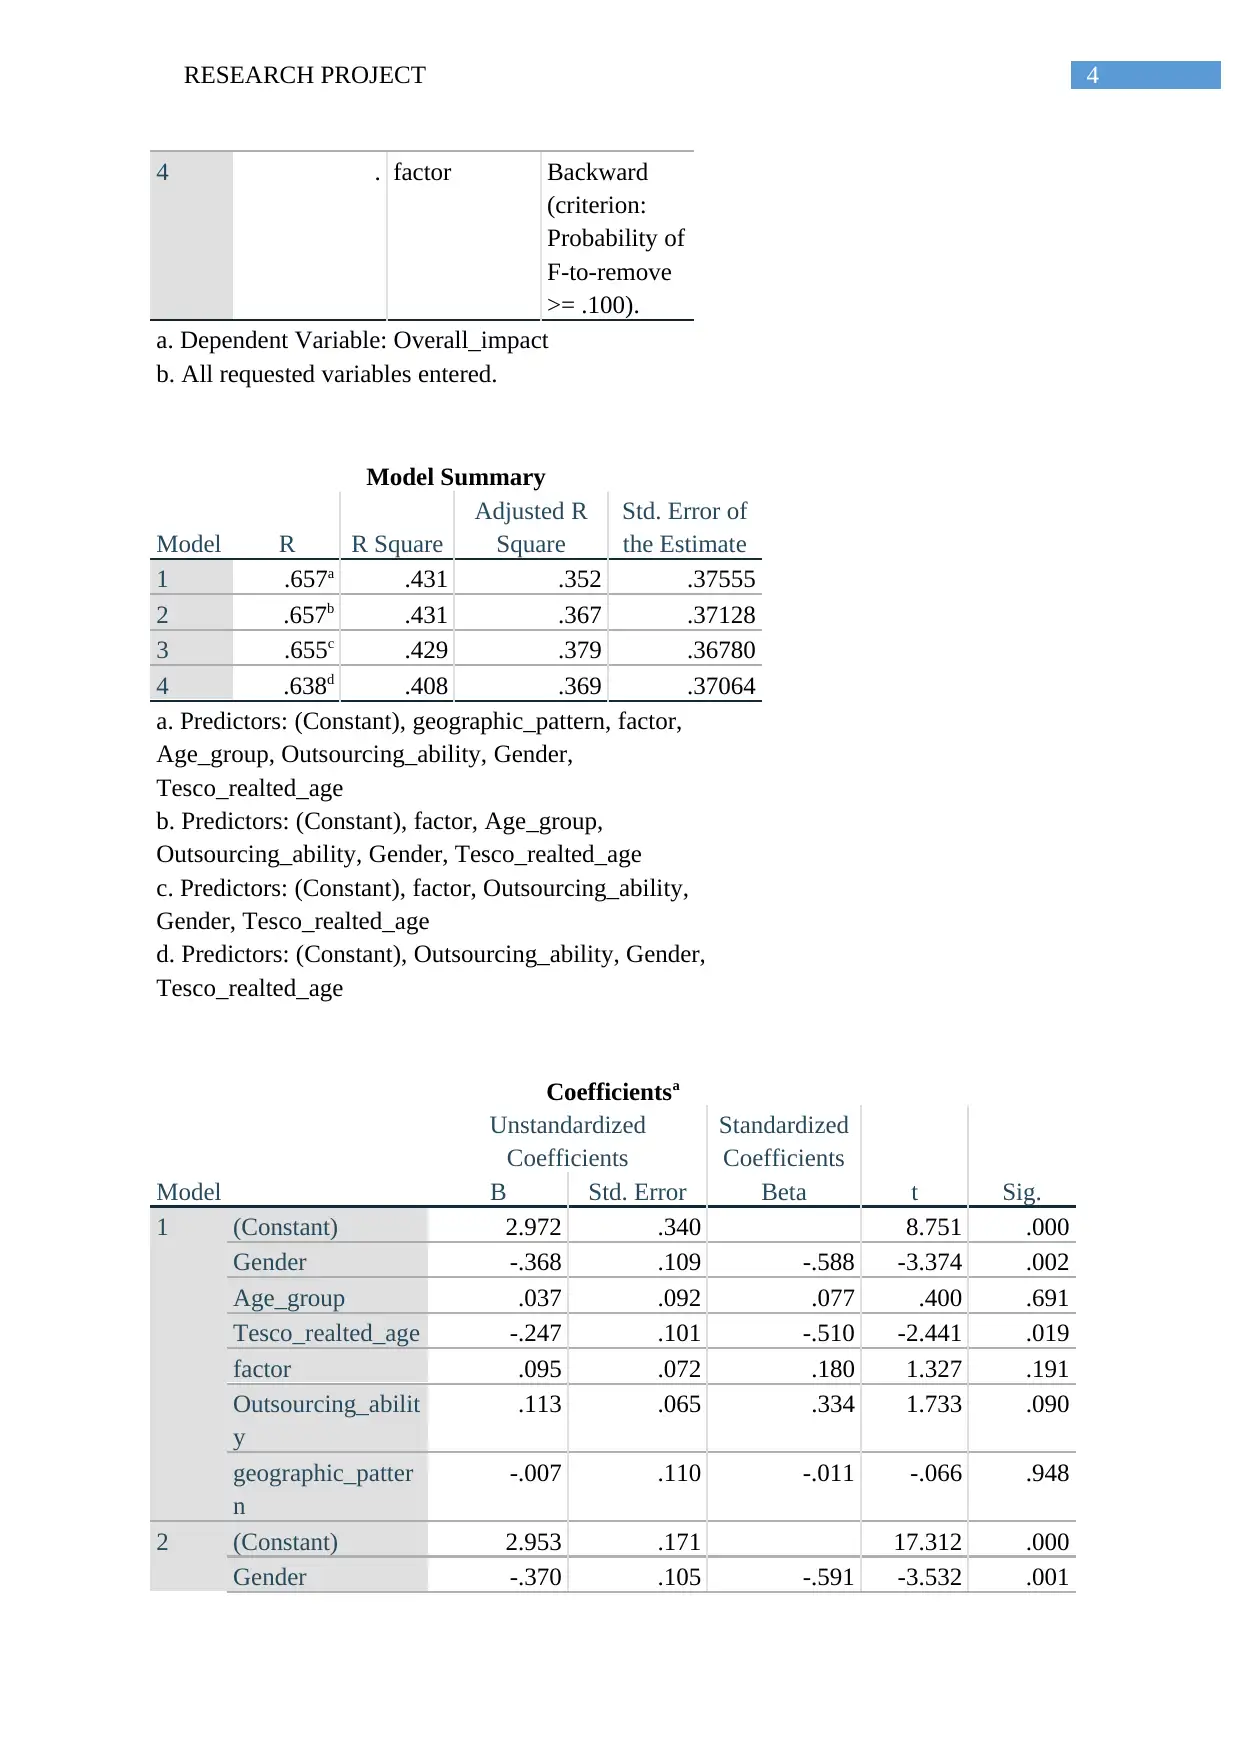
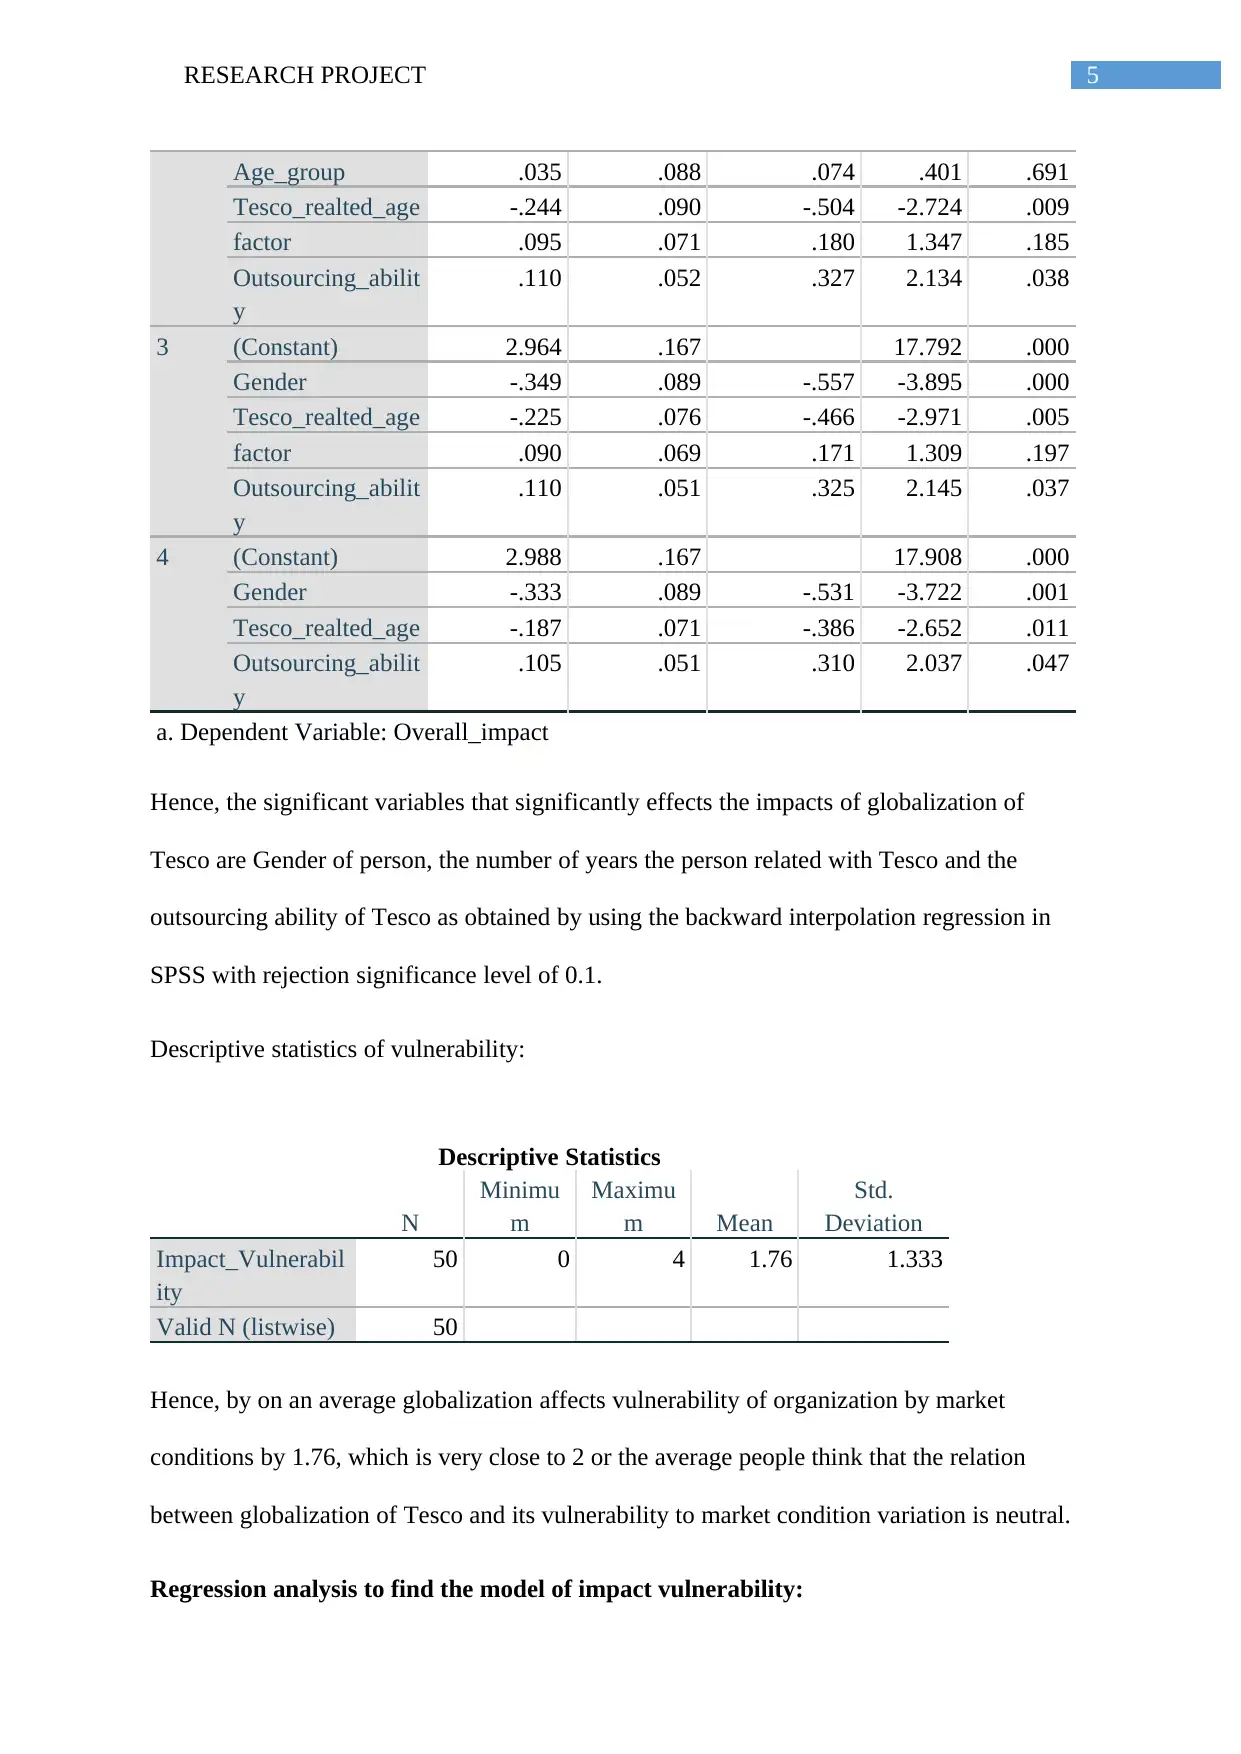
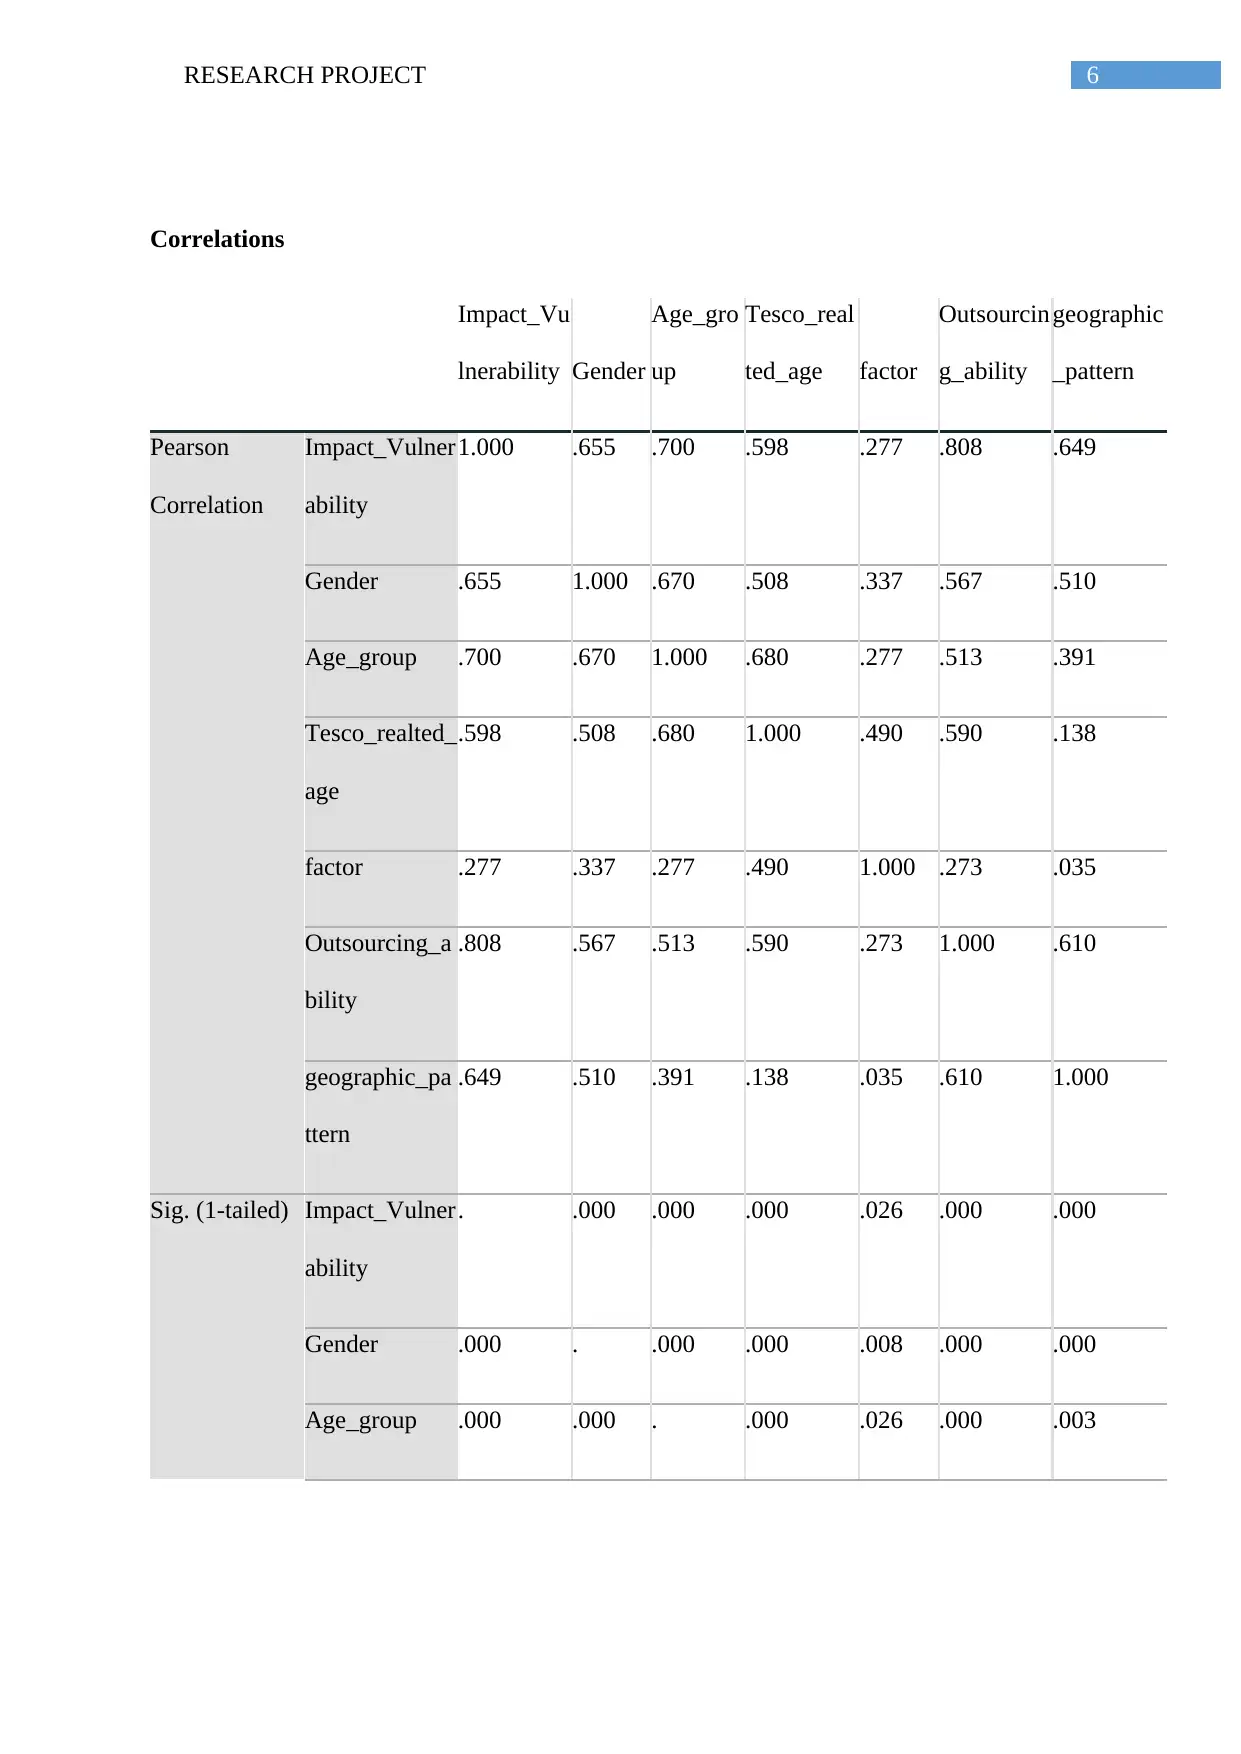
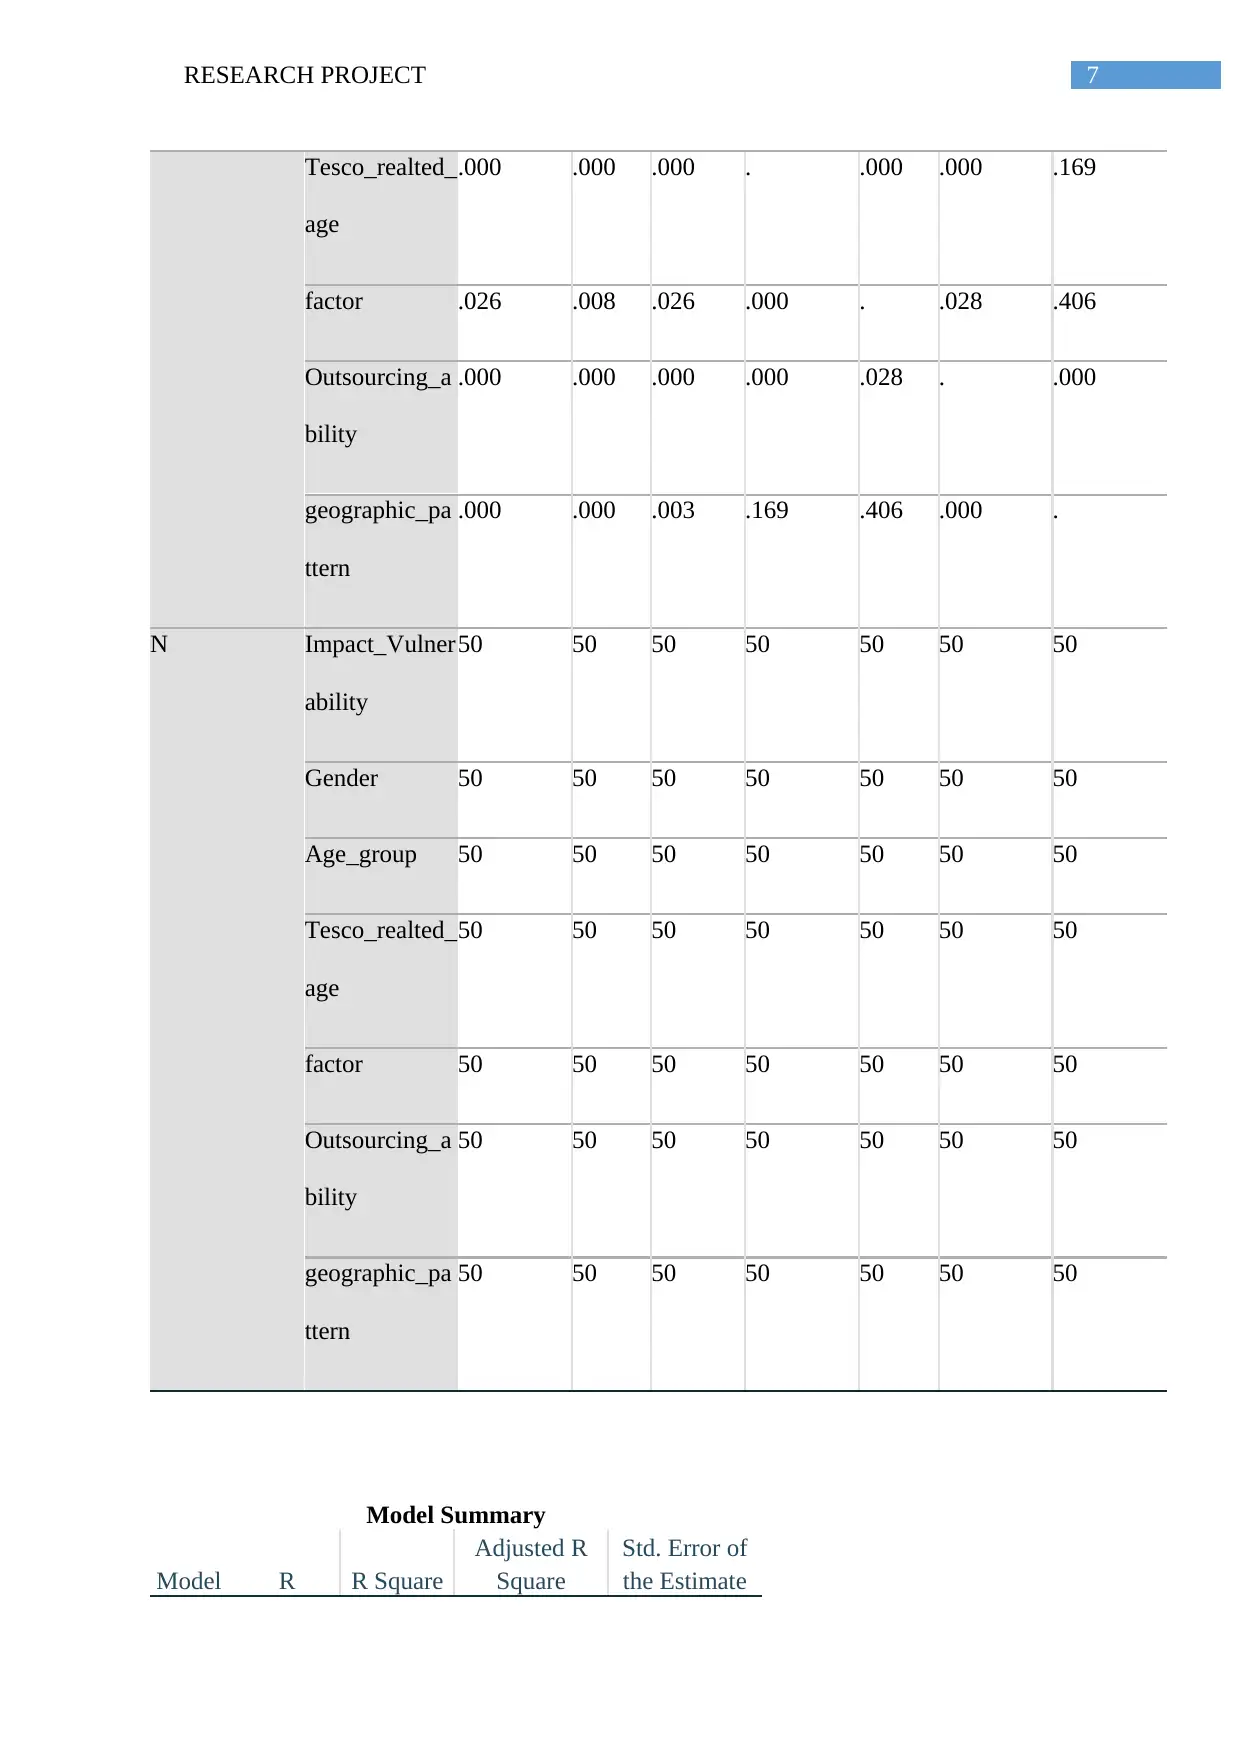
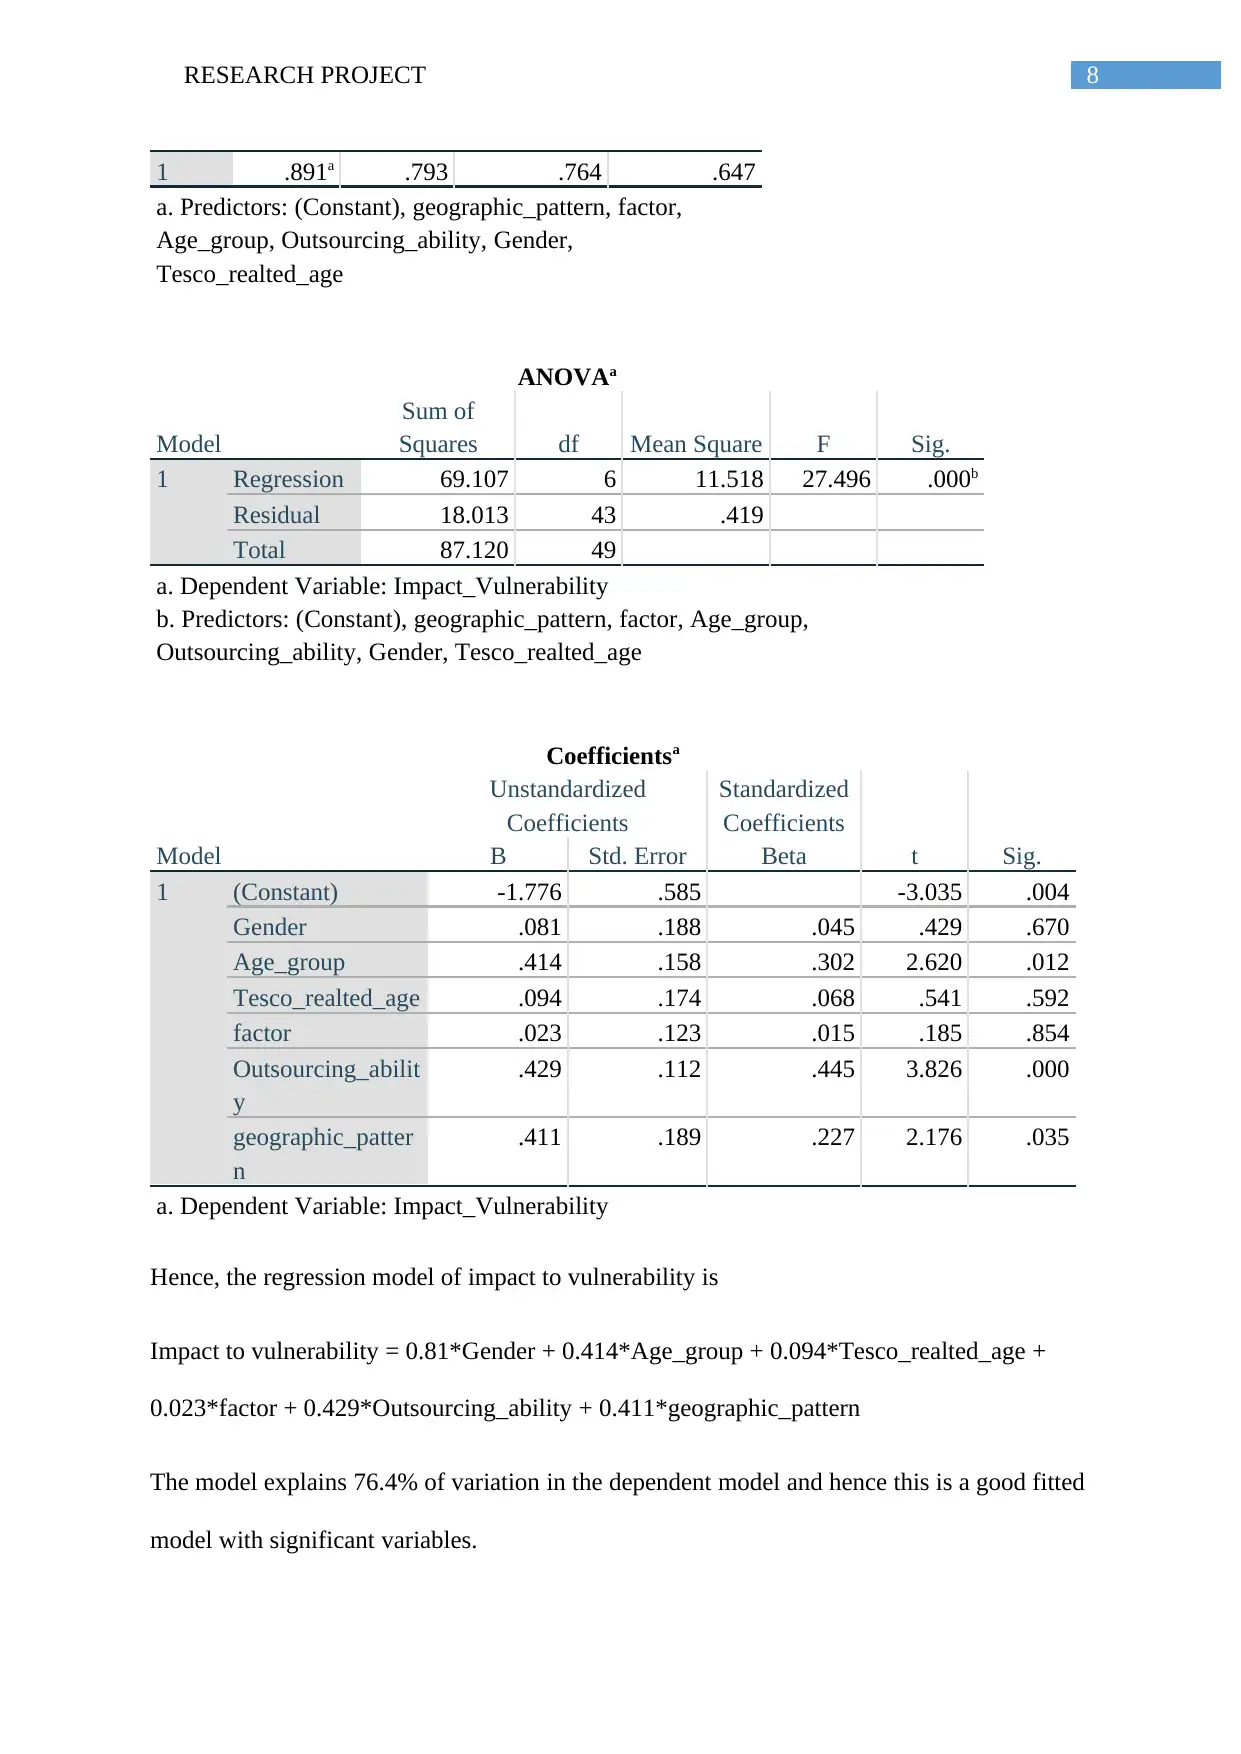
This research project investigates the impact of globalization on Tesco, focusing on its effects on the company's vulnerability to market variations. The project utilizes data analysis and regression techniques to identify significant variables influencing both the overall impact of globalization and the impact on Tesco's vulnerability. The analysis includes descriptive statistics, correlations, and regression models, considering factors like gender, age group, Tesco-related experience, outsourcing ability, and geographic patterns. The findings reveal that gender, Tesco-related experience, and outsourcing ability significantly affect the overall impact, while the vulnerability model incorporates gender, age group, Tesco-related experience, outsourcing ability, and geographic pattern. The model explains 76.4% of the variation in the dependent variable, indicating a good fit. The research provides insights into how globalization affects Tesco's operations and market resilience, with the average person viewing the impact on vulnerability as neutral.

1 out of 10
Your All-in-One AI-Powered Toolkit for Academic Success.
+13062052269
info@desklib.com
Available 24*7 on WhatsApp / Email
![[object Object]](/_next/static/media/star-bottom.7253800d.svg)
Copyright © 2020–2026 A2Z Services. All Rights Reserved. Developed and managed by ZUCOL.