The Effect of Managerial Incentives on Carbon Emission Levels
VerifiedAdded on 2023/02/03
|13
|2996
|42
Report
AI Summary
This report investigates the relationship between managerial incentives and carbon emission reduction, utilizing data from 60 USA organizations. The study employs descriptive statistics, including mean, median, and standard deviation, to analyze the impact of incentives on carbon emission levels. A t-test is performed to compare the means of organizations offering incentives versus those that do not. The findings indicate a significant negative correlation between incentives and carbon emissions, supporting the alternative hypothesis that incentives effectively reduce emissions. The discussion emphasizes the importance of stakeholder theory in motivating employees to reduce carbon emissions, leading to improved environmental outcomes. The report concludes by recommending that businesses implement incentive programs to encourage environmental responsibility, offering a practical approach to mitigate climate change. The report provides a detailed analysis of the data, including the statistical methods used and the interpretation of the results. The report also includes a literature review, conceptual model, hypotheses, and limitations. Furthermore, the report also suggests areas for further research.
Draft Research Question: Does the incentives provided to the managers to
address the issue of climate change results in percentage reduction in carbon
emission?
Title: Incentives offered to the Mangers and its impact on amount on carbon
emission
Acknowledgement:
I certify that I have carefully reviewed the university’s academic misconduct policy. I
understand that the source of ideas must be referenced and that quotation marks and a
reference are required when directly quoting anyone else’s words.
Paraphrase This Document
Need a fresh take? Get an instant paraphrase of this document with our AI Paraphraser
TABLE OF CONTENTS
INTRODUCTION...........................................................................................................................1
LITERATURE REVIEW................................................................................................................1
CONCEPTUAL MODEL................................................................................................................2
HYPOTHESES................................................................................................................................2
DATA ANALYSIS- DESCRIPTIVE..............................................................................................3
DATA ANALYSIS – INFERENTIAL...........................................................................................6
HYPOTHESIS TESTING...............................................................................................................7
DISCUSSION..................................................................................................................................8
LIMITATIONS................................................................................................................................9
FURTHER RESEARCH.................................................................................................................9
REFERENCES..............................................................................................................................10
INTRODUCTION
The best method for governments to encourage businesses to comply with new
legislations and policies is usually through subsidies and incentives. This use of incentives has
been applied in the implementation of climate change policies globally. However, the incentives
are not always available for all industries. This affects the implementation of the climate change
agenda across the board.
This report will discuss data and information which were being gathered from 60 USA
organization who will be anlsyed on the carbon emission rating. There will be analysis based on
the outcomes derived after implicating the statistical measurements such as Descriptive analysis
and T-test. Moreover, it will calculate data of the organization which pays incentives to their
professionals in context with climate control or firms which do not pay the same.
Moreover, analyzing a concrete solution will draft the revolutionary discussion and
suggestion to implicated by government in terms of changing the operational policies and
making qualitative improvements in operations. On the other side, there will be literature over
stakeholder theories and concepts which will be helpful to an organization in terms of managing
the working capital as well as bringing financial stability in business.
LITERATURE REVIEW
According to Jensen, (2017), it is required that business must have well developed and
designed ethics which leads it to make appropriate relationship with stakeholders associated in
entity. Morals and values which have been addressed in respect with managing the capital funds
of industry is quiet mandatory and will bring sound changes in the operations. Generally, it can
be said that stakeholder which are operating the business are employees, managers, investors,
suppliers as well as top level professionals which have stake in the firm. Thus, managing their
operational activities will be helpful in leading the firm to attaining the goals and make increase
in the operations. Jones, (2017) determined that, analyzing the requirements of stakeholder such
as developing effective dividend policies which will result in stablishing a strong relationship
with various individual. It will help in fetching investor’s attention as well as improves the
capital stability in the firm.
⊘ This is a preview!⊘
Do you want full access?
Subscribe today to unlock all pages.
Trusted by 1+ million students worldwide
As per the views of Fassin, (2017), stakeholder strategy has to be developed by an
organization which will help it in internal or external segmentations. Therefore, in relation with
the manufacturing units there will be requirement of bringing adequate incentives to the
workforce which will encourage them and meet the business requirements. In relation with
addressing the operational practices in terms of managing CO2 emission by organization. Rose,
2018), determined that, Implicating the incentives in the work practices as well as bring the
adequate amount of appreciation to the employees which will result in better control over
operations. It can be said that, CO2 emission by manufacturing units will be reduced and will
help society in having healthy environment. Thus, the impacts of greenhouse gas will be reduced
in the coming period which will encourage growth in the society.
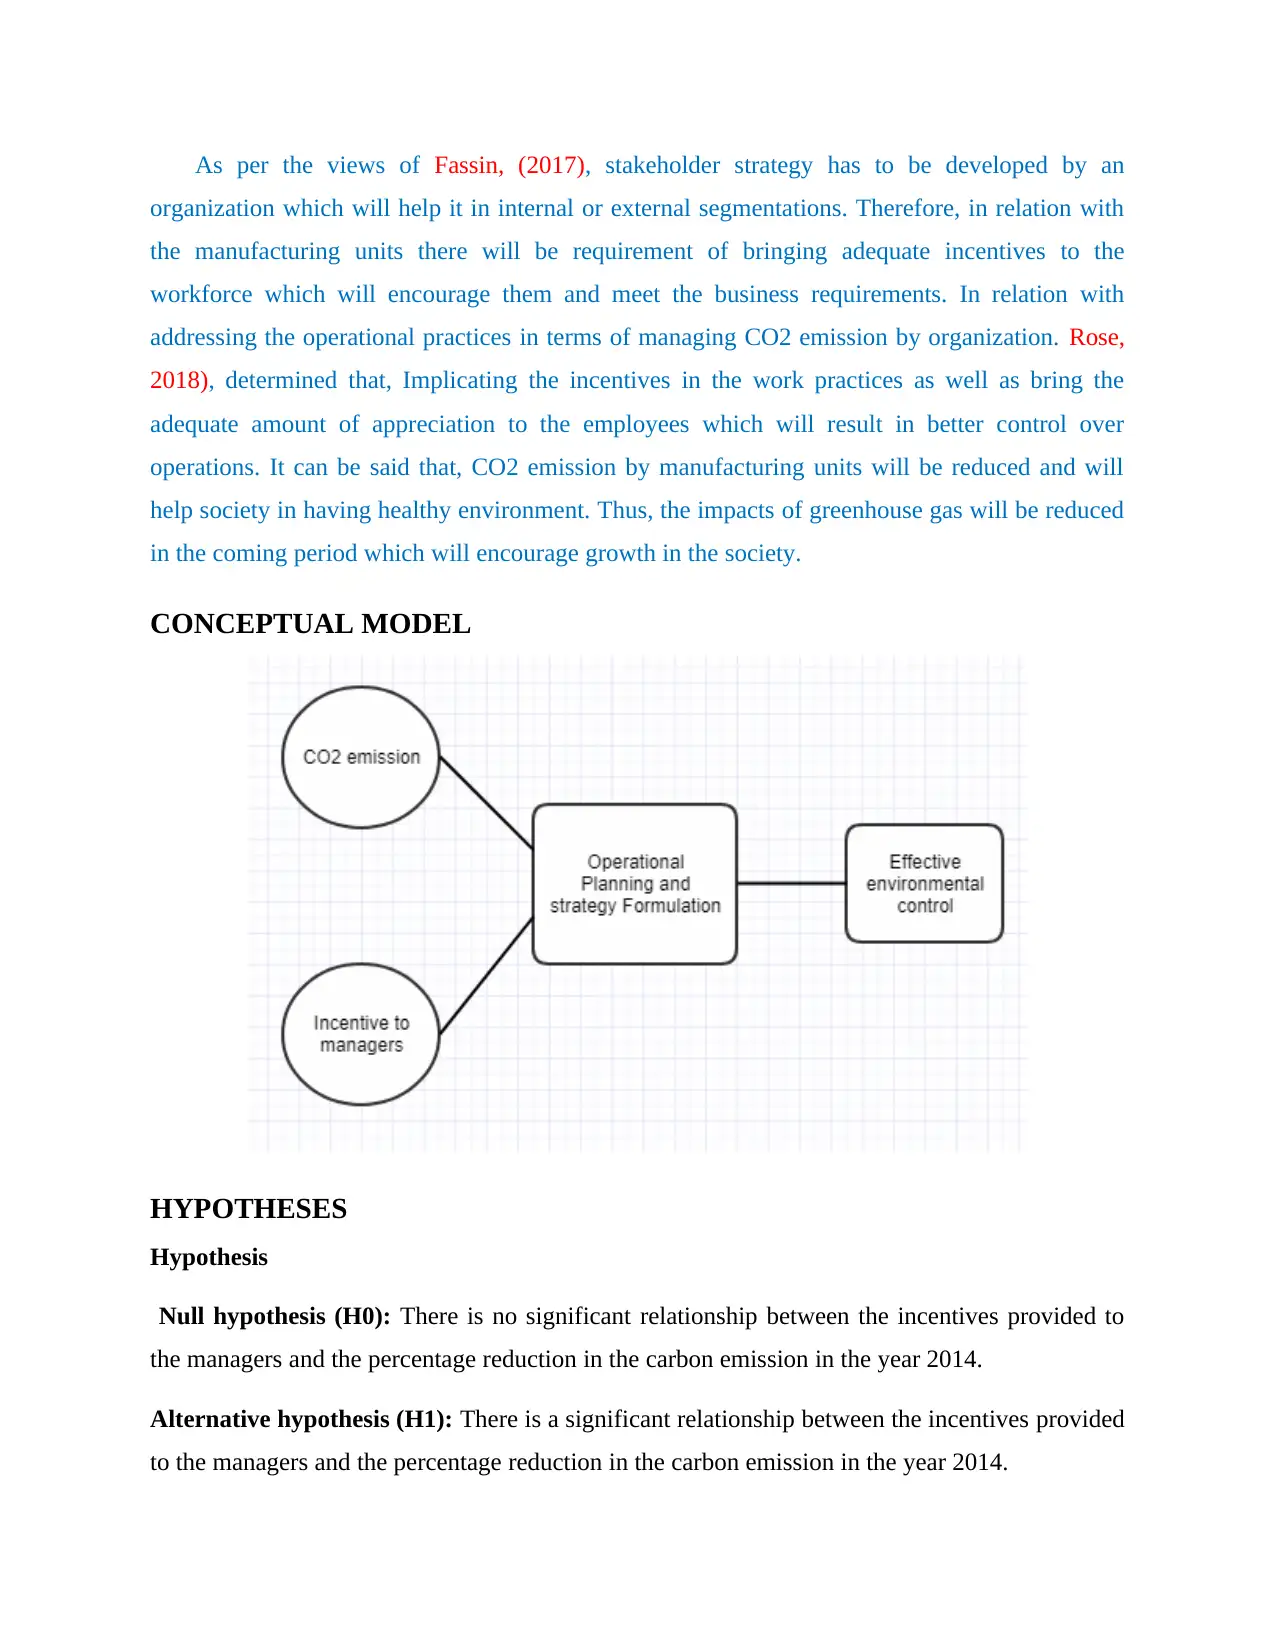
CONCEPTUAL MODEL
HYPOTHESES
Hypothesis
Null hypothesis (H0): There is no significant relationship between the incentives provided to
the managers and the percentage reduction in the carbon emission in the year 2014.
Alternative hypothesis (H1): There is a significant relationship between the incentives provided
to the managers and the percentage reduction in the carbon emission in the year 2014.
organization which will help it in internal or external segmentations. Therefore, in relation with
the manufacturing units there will be requirement of bringing adequate incentives to the
workforce which will encourage them and meet the business requirements. In relation with
addressing the operational practices in terms of managing CO2 emission by organization. Rose,
2018), determined that, Implicating the incentives in the work practices as well as bring the
adequate amount of appreciation to the employees which will result in better control over
operations. It can be said that, CO2 emission by manufacturing units will be reduced and will
help society in having healthy environment. Thus, the impacts of greenhouse gas will be reduced
in the coming period which will encourage growth in the society.
CONCEPTUAL MODEL
HYPOTHESES
Hypothesis
Null hypothesis (H0): There is no significant relationship between the incentives provided to
the managers and the percentage reduction in the carbon emission in the year 2014.
Alternative hypothesis (H1): There is a significant relationship between the incentives provided
to the managers and the percentage reduction in the carbon emission in the year 2014.
Paraphrase This Document
Need a fresh take? Get an instant paraphrase of this document with our AI Paraphraser
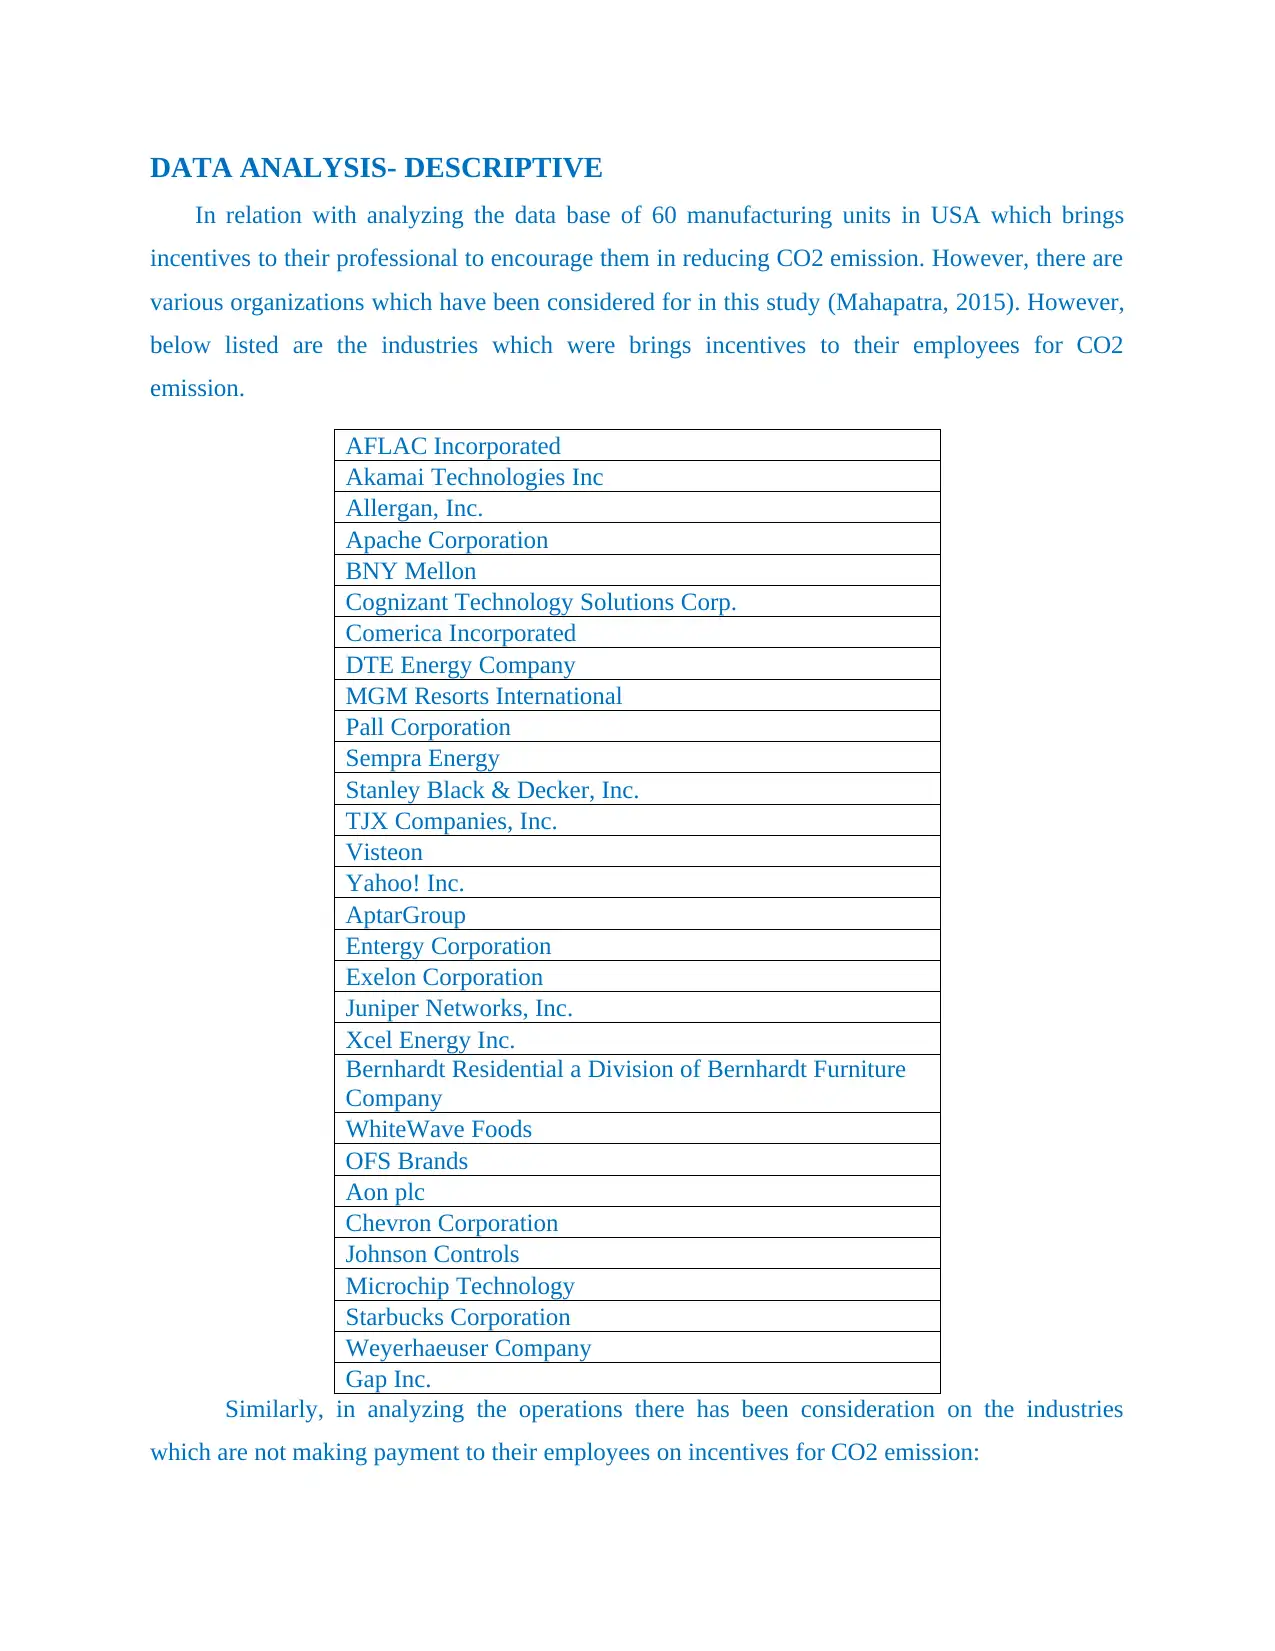
DATA ANALYSIS- DESCRIPTIVE
In relation with analyzing the data base of 60 manufacturing units in USA which brings
incentives to their professional to encourage them in reducing CO2 emission. However, there are
various organizations which have been considered for in this study (Mahapatra, 2015). However,
below listed are the industries which were brings incentives to their employees for CO2
emission.
AFLAC Incorporated
Akamai Technologies Inc
Allergan, Inc.
Apache Corporation
BNY Mellon
Cognizant Technology Solutions Corp.
Comerica Incorporated
DTE Energy Company
MGM Resorts International
Pall Corporation
Sempra Energy
Stanley Black & Decker, Inc.
TJX Companies, Inc.
Visteon
Yahoo! Inc.
AptarGroup
Entergy Corporation
Exelon Corporation
Juniper Networks, Inc.
Xcel Energy Inc.
Bernhardt Residential a Division of Bernhardt Furniture
Company
WhiteWave Foods
OFS Brands
Aon plc
Chevron Corporation
Johnson Controls
Microchip Technology
Starbucks Corporation
Weyerhaeuser Company
Gap Inc.
Similarly, in analyzing the operations there has been consideration on the industries
which are not making payment to their employees on incentives for CO2 emission:
In relation with analyzing the data base of 60 manufacturing units in USA which brings
incentives to their professional to encourage them in reducing CO2 emission. However, there are
various organizations which have been considered for in this study (Mahapatra, 2015). However,
below listed are the industries which were brings incentives to their employees for CO2
emission.
AFLAC Incorporated
Akamai Technologies Inc
Allergan, Inc.
Apache Corporation
BNY Mellon
Cognizant Technology Solutions Corp.
Comerica Incorporated
DTE Energy Company
MGM Resorts International
Pall Corporation
Sempra Energy
Stanley Black & Decker, Inc.
TJX Companies, Inc.
Visteon
Yahoo! Inc.
AptarGroup
Entergy Corporation
Exelon Corporation
Juniper Networks, Inc.
Xcel Energy Inc.
Bernhardt Residential a Division of Bernhardt Furniture
Company
WhiteWave Foods
OFS Brands
Aon plc
Chevron Corporation
Johnson Controls
Microchip Technology
Starbucks Corporation
Weyerhaeuser Company
Gap Inc.
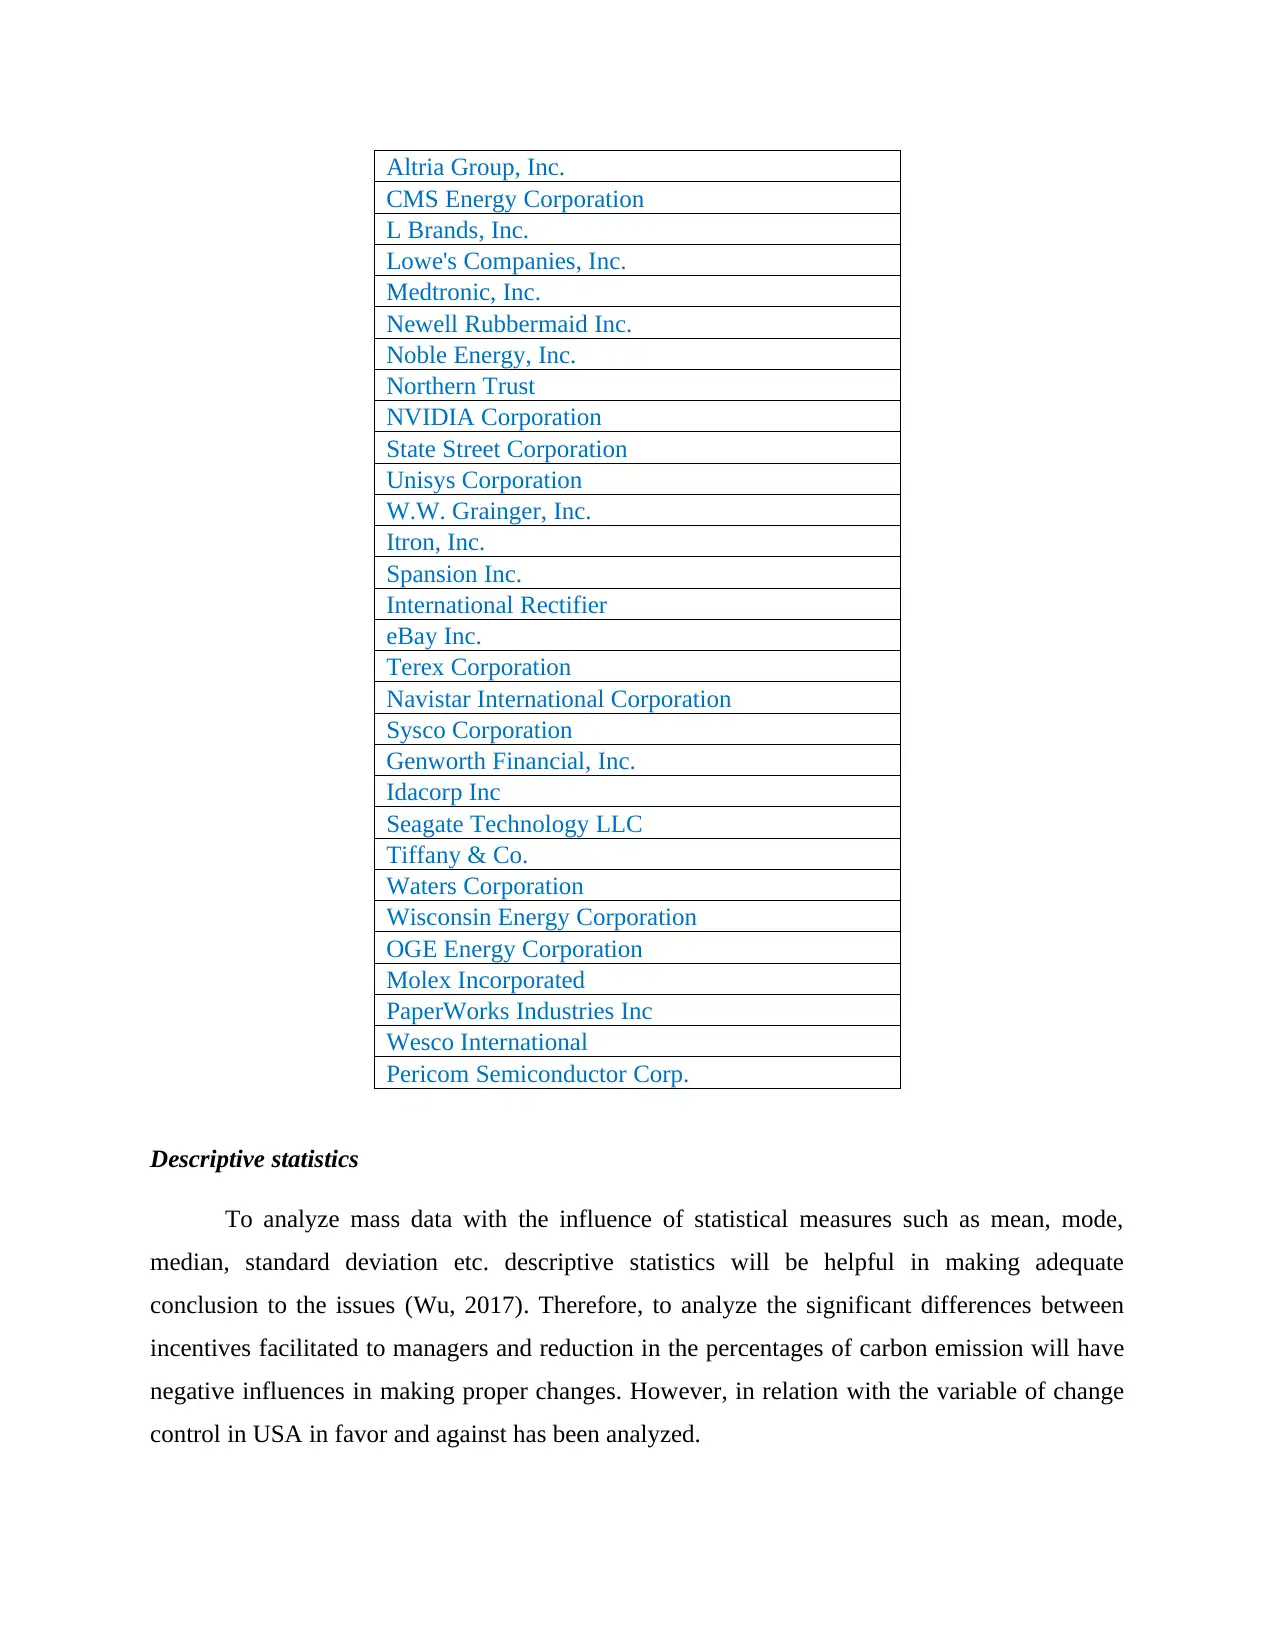
Similarly, in analyzing the operations there has been consideration on the industries
which are not making payment to their employees on incentives for CO2 emission:
Altria Group, Inc.
CMS Energy Corporation
L Brands, Inc.
Lowe's Companies, Inc.
Medtronic, Inc.
Newell Rubbermaid Inc.
Noble Energy, Inc.
Northern Trust
NVIDIA Corporation
State Street Corporation
Unisys Corporation
W.W. Grainger, Inc.
Itron, Inc.
Spansion Inc.
International Rectifier
eBay Inc.
Terex Corporation
Navistar International Corporation
Sysco Corporation
Genworth Financial, Inc.
Idacorp Inc
Seagate Technology LLC
Tiffany & Co.
Waters Corporation
Wisconsin Energy Corporation
OGE Energy Corporation
Molex Incorporated
PaperWorks Industries Inc
Wesco International
Pericom Semiconductor Corp.
Descriptive statistics
To analyze mass data with the influence of statistical measures such as mean, mode,
median, standard deviation etc. descriptive statistics will be helpful in making adequate
conclusion to the issues (Wu, 2017). Therefore, to analyze the significant differences between
incentives facilitated to managers and reduction in the percentages of carbon emission will have
negative influences in making proper changes. However, in relation with the variable of change
control in USA in favor and against has been analyzed.
⊘ This is a preview!⊘
Do you want full access?
Subscribe today to unlock all pages.
Trusted by 1+ million students worldwide
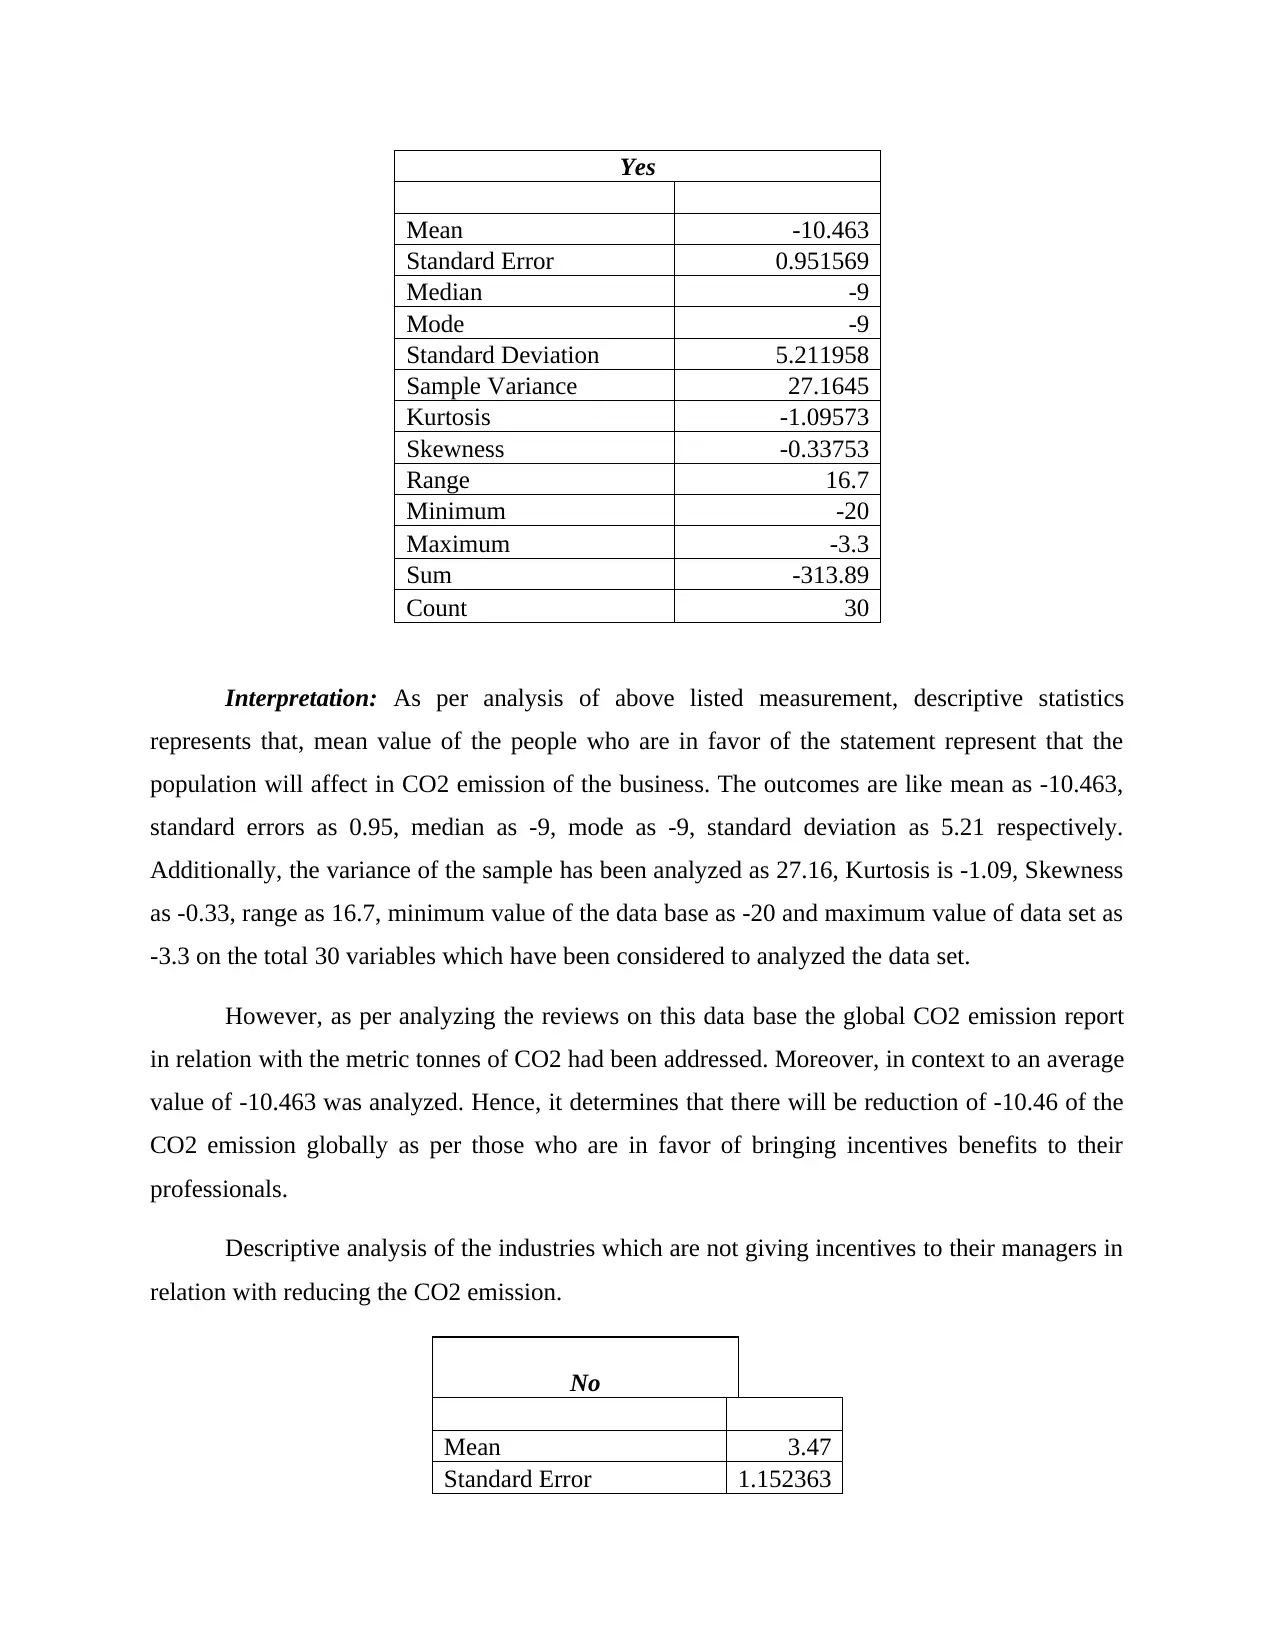
Yes
Mean -10.463
Standard Error 0.951569
Median -9
Mode -9
Standard Deviation 5.211958
Sample Variance 27.1645
Kurtosis -1.09573
Skewness -0.33753
Range 16.7
Minimum -20
Maximum -3.3
Sum -313.89
Count 30
Interpretation: As per analysis of above listed measurement, descriptive statistics
represents that, mean value of the people who are in favor of the statement represent that the
population will affect in CO2 emission of the business. The outcomes are like mean as -10.463,
standard errors as 0.95, median as -9, mode as -9, standard deviation as 5.21 respectively.
Additionally, the variance of the sample has been analyzed as 27.16, Kurtosis is -1.09, Skewness
as -0.33, range as 16.7, minimum value of the data base as -20 and maximum value of data set as
-3.3 on the total 30 variables which have been considered to analyzed the data set.
However, as per analyzing the reviews on this data base the global CO2 emission report
in relation with the metric tonnes of CO2 had been addressed. Moreover, in context to an average
value of -10.463 was analyzed. Hence, it determines that there will be reduction of -10.46 of the
CO2 emission globally as per those who are in favor of bringing incentives benefits to their
professionals.
Descriptive analysis of the industries which are not giving incentives to their managers in
relation with reducing the CO2 emission.
No
Mean 3.47
Standard Error 1.152363
Paraphrase This Document
Need a fresh take? Get an instant paraphrase of this document with our AI Paraphraser
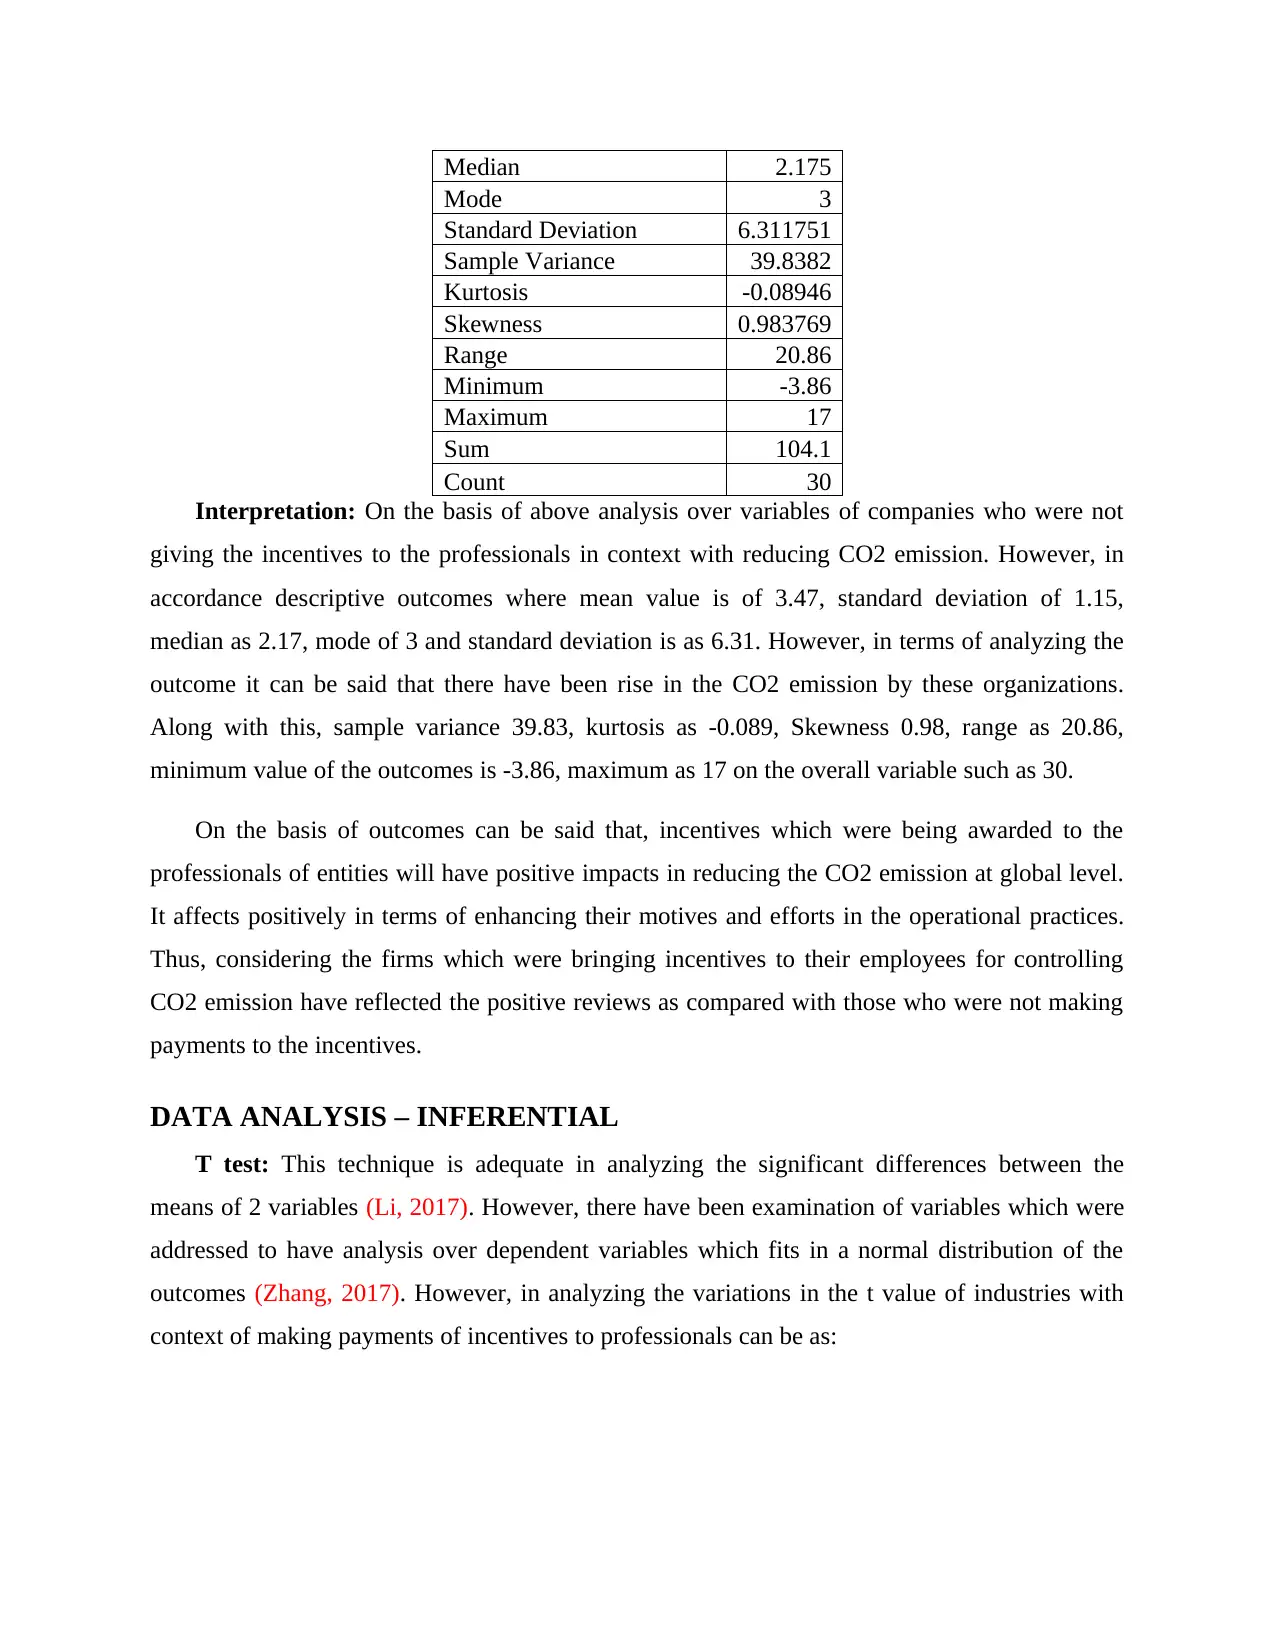
Median 2.175
Mode 3
Standard Deviation 6.311751
Sample Variance 39.8382
Kurtosis -0.08946
Skewness 0.983769
Range 20.86
Minimum -3.86
Maximum 17
Sum 104.1
Count 30
Interpretation: On the basis of above analysis over variables of companies who were not
giving the incentives to the professionals in context with reducing CO2 emission. However, in
accordance descriptive outcomes where mean value is of 3.47, standard deviation of 1.15,
median as 2.17, mode of 3 and standard deviation is as 6.31. However, in terms of analyzing the
outcome it can be said that there have been rise in the CO2 emission by these organizations.
Along with this, sample variance 39.83, kurtosis as -0.089, Skewness 0.98, range as 20.86,
minimum value of the outcomes is -3.86, maximum as 17 on the overall variable such as 30.
On the basis of outcomes can be said that, incentives which were being awarded to the
professionals of entities will have positive impacts in reducing the CO2 emission at global level.
It affects positively in terms of enhancing their motives and efforts in the operational practices.
Thus, considering the firms which were bringing incentives to their employees for controlling
CO2 emission have reflected the positive reviews as compared with those who were not making
payments to the incentives.
DATA ANALYSIS – INFERENTIAL
T test: This technique is adequate in analyzing the significant differences between the
means of 2 variables (Li, 2017). However, there have been examination of variables which were
addressed to have analysis over dependent variables which fits in a normal distribution of the
outcomes (Zhang, 2017). However, in analyzing the variations in the t value of industries with
context of making payments of incentives to professionals can be as:
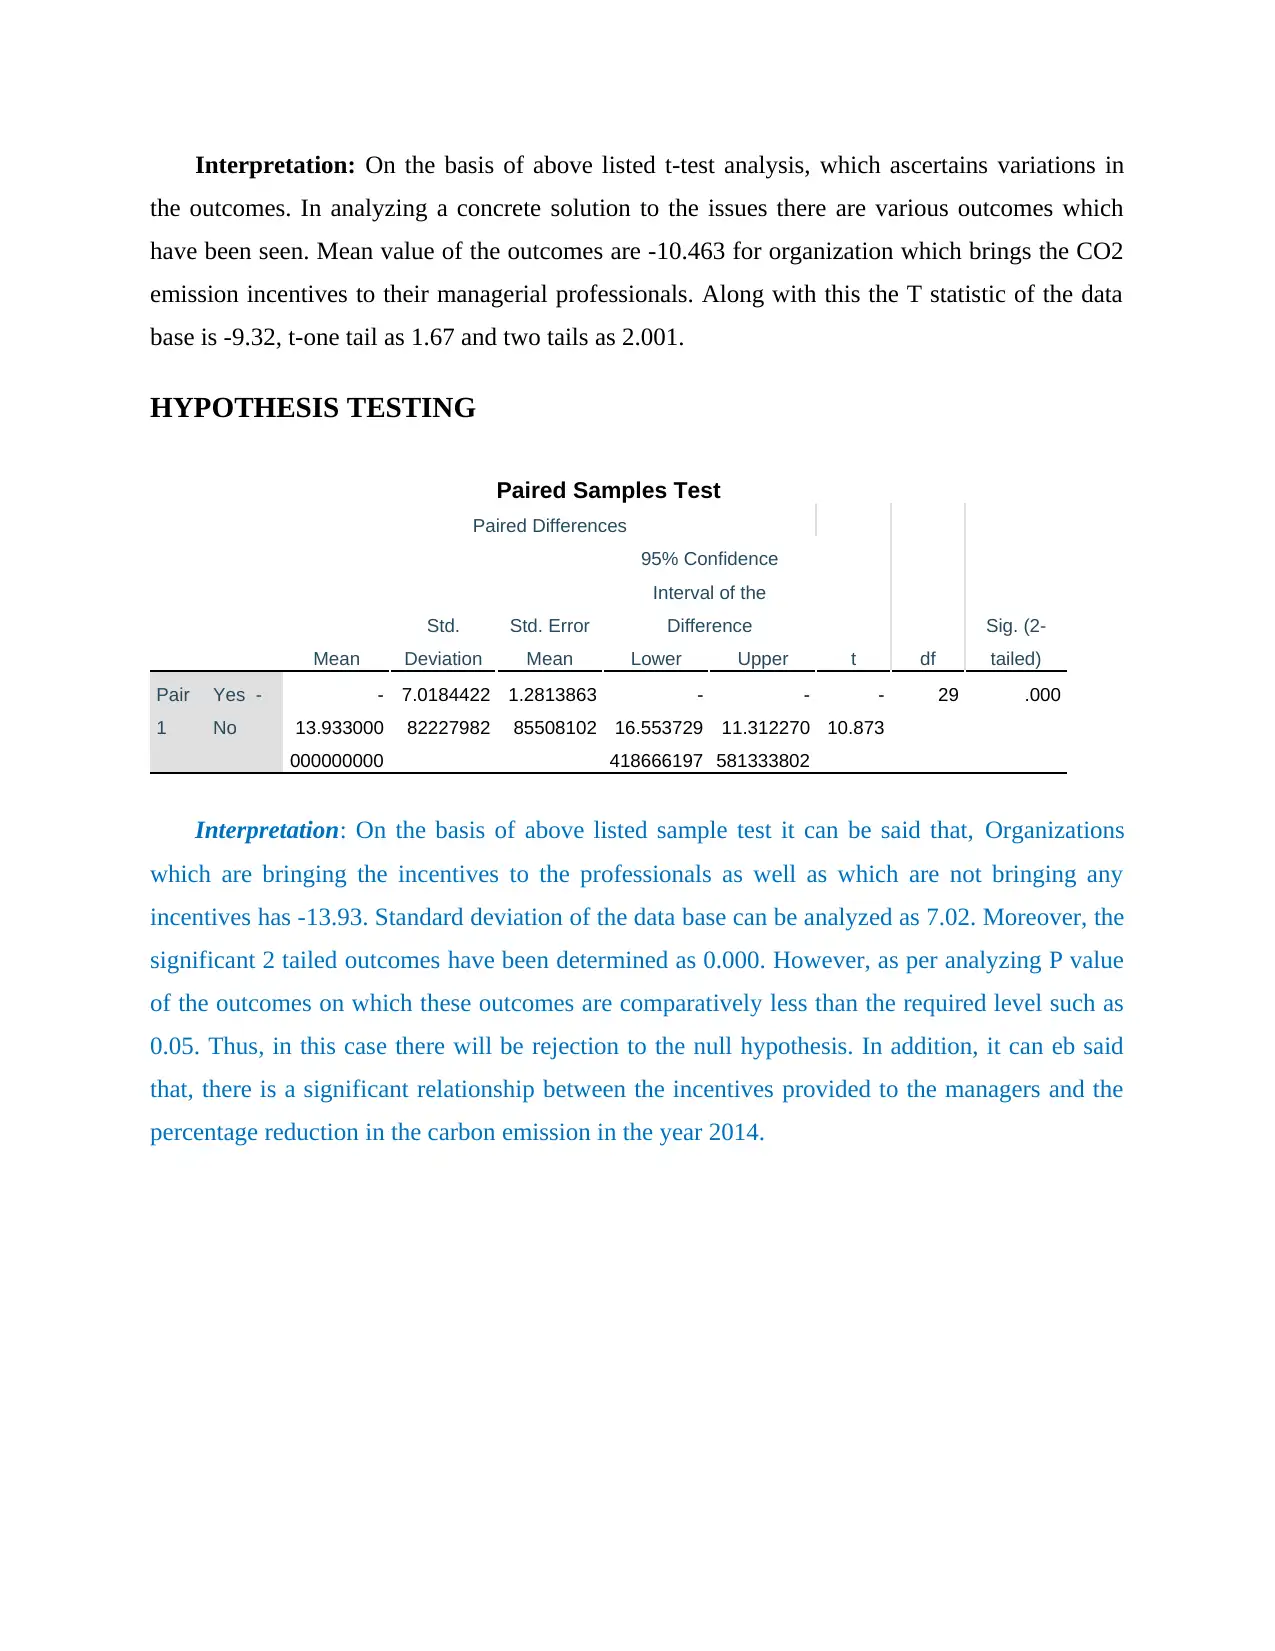
Interpretation: On the basis of above listed t-test analysis, which ascertains variations in
the outcomes. In analyzing a concrete solution to the issues there are various outcomes which
have been seen. Mean value of the outcomes are -10.463 for organization which brings the CO2
emission incentives to their managerial professionals. Along with this the T statistic of the data
base is -9.32, t-one tail as 1.67 and two tails as 2.001.
HYPOTHESIS TESTING
Paired Samples Test
Paired Differences
t df
Sig. (2-
tailed)Mean
Std.
Deviation
Std. Error
Mean
95% Confidence
Interval of the
Difference
Lower Upper
Pair
1
Yes -
No
-
13.933000
000000000
7.0184422
82227982
1.2813863
85508102
-
16.553729
418666197
-
11.312270
581333802
-
10.873
29 .000
Interpretation: On the basis of above listed sample test it can be said that, Organizations
which are bringing the incentives to the professionals as well as which are not bringing any
incentives has -13.93. Standard deviation of the data base can be analyzed as 7.02. Moreover, the
significant 2 tailed outcomes have been determined as 0.000. However, as per analyzing P value
of the outcomes on which these outcomes are comparatively less than the required level such as
0.05. Thus, in this case there will be rejection to the null hypothesis. In addition, it can eb said
that, there is a significant relationship between the incentives provided to the managers and the
percentage reduction in the carbon emission in the year 2014.
⊘ This is a preview!⊘
Do you want full access?
Subscribe today to unlock all pages.
Trusted by 1+ million students worldwide
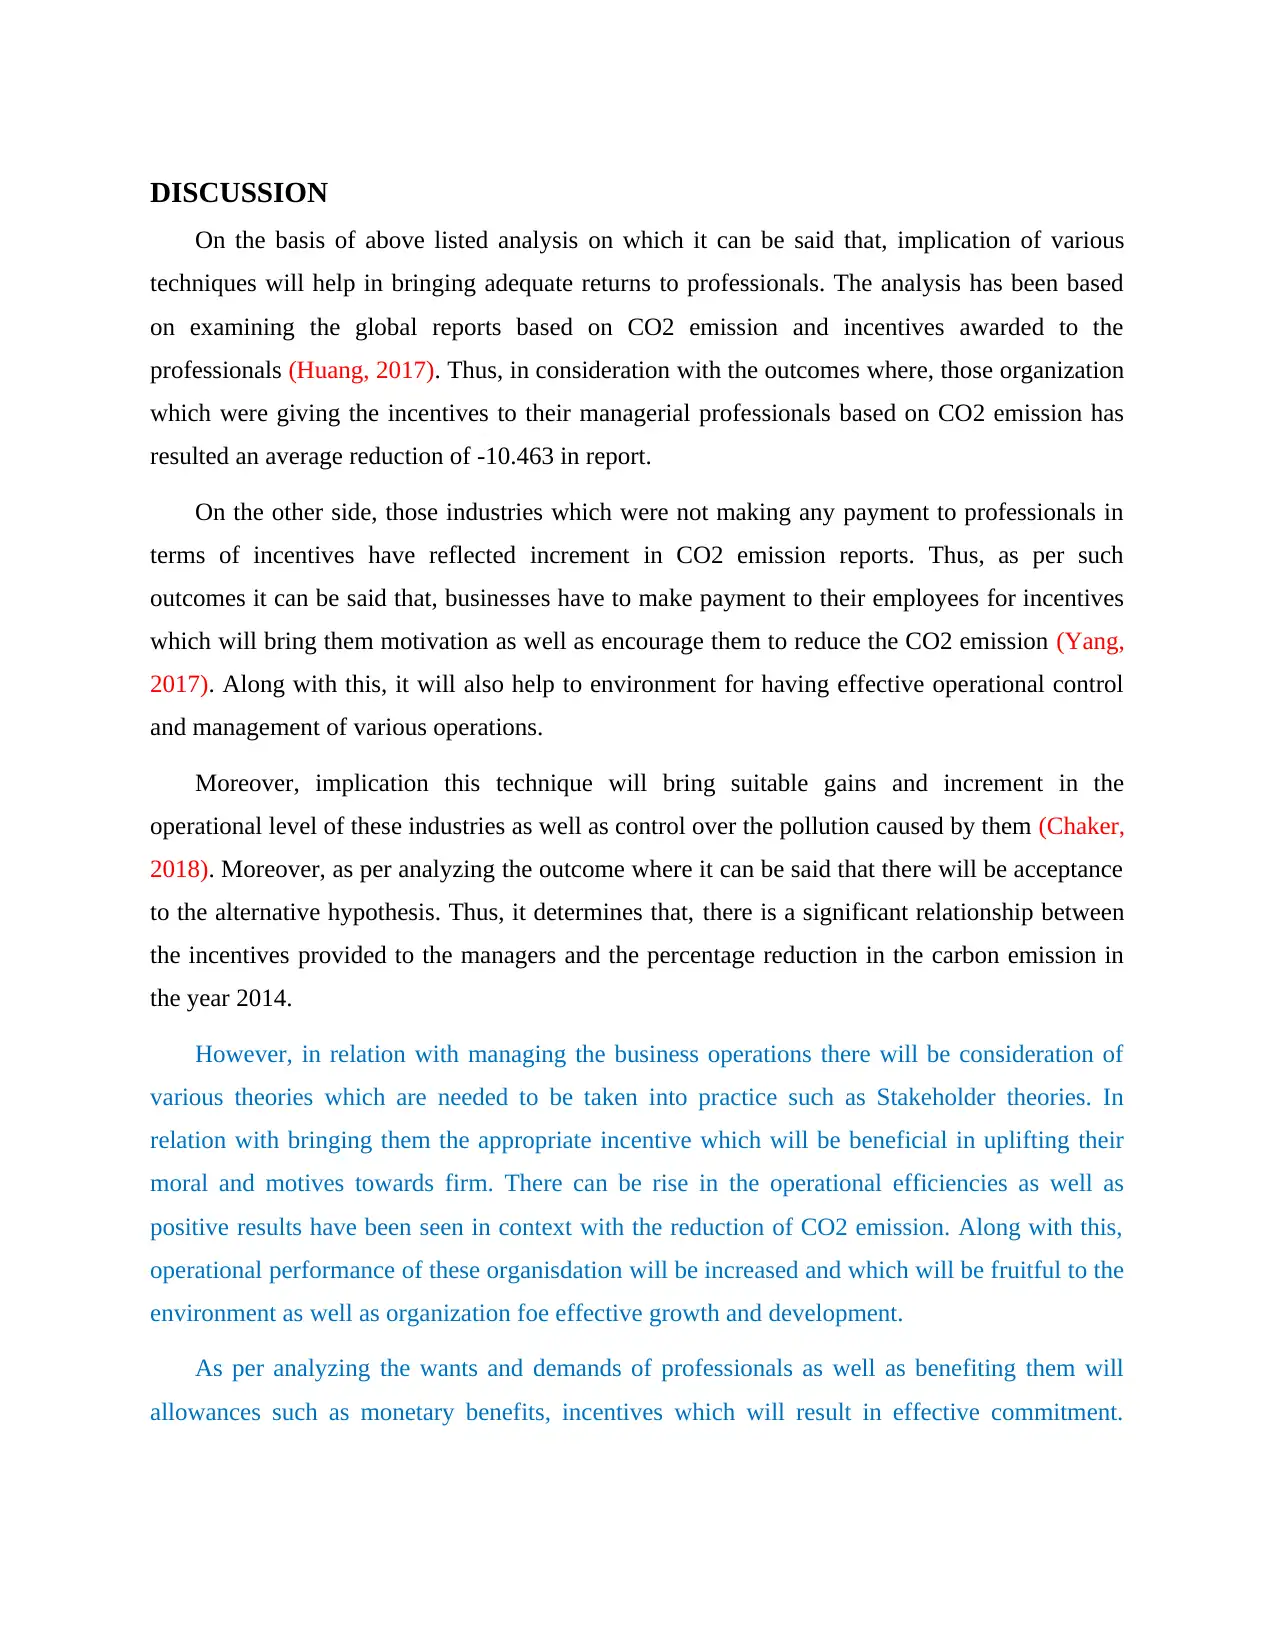
DISCUSSION
On the basis of above listed analysis on which it can be said that, implication of various
techniques will help in bringing adequate returns to professionals. The analysis has been based
on examining the global reports based on CO2 emission and incentives awarded to the
professionals (Huang, 2017). Thus, in consideration with the outcomes where, those organization
which were giving the incentives to their managerial professionals based on CO2 emission has
resulted an average reduction of -10.463 in report.
On the other side, those industries which were not making any payment to professionals in
terms of incentives have reflected increment in CO2 emission reports. Thus, as per such
outcomes it can be said that, businesses have to make payment to their employees for incentives
which will bring them motivation as well as encourage them to reduce the CO2 emission (Yang,
2017). Along with this, it will also help to environment for having effective operational control
and management of various operations.
Moreover, implication this technique will bring suitable gains and increment in the
operational level of these industries as well as control over the pollution caused by them (Chaker,
2018). Moreover, as per analyzing the outcome where it can be said that there will be acceptance
to the alternative hypothesis. Thus, it determines that, there is a significant relationship between
the incentives provided to the managers and the percentage reduction in the carbon emission in
the year 2014.
However, in relation with managing the business operations there will be consideration of
various theories which are needed to be taken into practice such as Stakeholder theories. In
relation with bringing them the appropriate incentive which will be beneficial in uplifting their
moral and motives towards firm. There can be rise in the operational efficiencies as well as
positive results have been seen in context with the reduction of CO2 emission. Along with this,
operational performance of these organisdation will be increased and which will be fruitful to the
environment as well as organization foe effective growth and development.
As per analyzing the wants and demands of professionals as well as benefiting them will
allowances such as monetary benefits, incentives which will result in effective commitment.
Paraphrase This Document
Need a fresh take? Get an instant paraphrase of this document with our AI Paraphraser
However, this will be adequate and helpful in leading the organization to make qualitative
improvements in the operations.
LIMITATIONS
In context with performing this research on which there have been various obstacles which
have been faced by scholar. Thus, among them the data which was selected to examine the effect
on CO2 emission is not a broad source to fetch accurate information. There have been huge
variations in the results. Along with this, time awarded for the research is not appropriate in trims
of making proper judgement and analysis on the issues. Moreover, impacts of CO2 over
environment has reflected poor operational management and control over such issues. Resources
which were being considered in the research study are not capable of bringing the validate
information. Thus, reliability and authentic influences in activities will have n
FURTHER RESEARCH
In accordance with outcomes derived from this research, it can be said that to executed and
perform the further study there are requirements of having effective determination of outcomes.
Along with this, it will be suggested that implicating various other statistical tools for examining
the data base will be helpful in bringing proper details about the issues (Ohashi, 2017). It
includes Anova, regression, correlation and coefficient analysis.
REFERENCES
Books and Journals
Chaker, R. a. (2018 ). Effect of biochemical fraction of exogenous organic matter on CO2
emission from arid soil. Greenhouse Gases: . UK: Science and Technology. 8(4). pp.721-
733.
Fassin, Y. D. (2017). Intra
‐stakeholder alliances in plant
‐closing decisions: A stakeholder theory
approach. . Europe: Business Ethics: A European Review. 26(2). pp.97-111.
Huang, J. a. (2017). CO2 emission pattern of eroded sloping croplands after simulated rainfall in
subtropical China. . China. : Ecological Engineering. 99. pp.39-46.
Jensen, M. C. (2017). Value maximisation, stakeholder theory and the corporate objective
function. . UK: In Unfolding stakeholder thinking (pp. 65-84). Routledge.
Jones, T. M. (2017). Stakeholder theory: The state of the art. . UK: The Blackwell guide to
business ethics, pp.17-37.
Li, Y. a. (2017). Re-estimating CO2 emission factors for gasoline passenger cars adding driving
behaviour characteristics——A case study of Beijing. UK: Energy Policy. 102. pp.353-
361.
Mahapatra, K. (2015). Energy use and co2 emission of new residential buildings built under
specific requirements–the case of växjö municipality, sweden. . sweden. : Applied
Energy. 152. pp.31-38.
Ohashi, M. a. ( 2017). CO2 emission from subterranean nests of ants and termites in a tropical
rain forest in Sarawak, Malaysia. . Malaysia. : Applied Soil Ecology. 117. pp.147-155.
Rose, J. F. (2018). Stakeholder theory for the E-government context: Framing a value-oriented
normative core. UK: Government Information Quarterly. 35(3). pp.362-374.
Wu, L. F. (2017). Soil CO2 emission and carbon budget of a wheat/maize annual double-cropped
system in response to tillage and residue management in the North China Plain.
International Journal of Agricultural Sustainability., 15(3). pp.253-263.
⊘ This is a preview!⊘
Do you want full access?
Subscribe today to unlock all pages.
Trusted by 1+ million students worldwide
1 out of 13
Related Documents


Your All-in-One AI-Powered Toolkit for Academic Success.
+13062052269
info@desklib.com
Available 24*7 on WhatsApp / Email
![[object Object]](/_next/static/media/star-bottom.7253800d.svg)
Unlock your academic potential
Copyright © 2020–2026 A2Z Services. All Rights Reserved. Developed and managed by ZUCOL.