Role of Fuel and Geography in Toyota Car Sales: Australia Report
VerifiedAdded on 2020/04/07
|24
|5659
|280
Report
AI Summary
This report investigates the impact of geographical and fuel-related factors on Toyota car sales across different regions in Australia. The research utilizes secondary data from sources such as the Australian Bureau of Statistics and Australian Energy Statistics. Statistical techniques including descriptive statistics, t-tests, ANOVA, correlation, and multiple regression models were employed to analyze the data. The study explores the relationship between regional car sales, fuel consumption, and Toyota's sales performance. The findings highlight the influence of fuel availability and geographical variations on car sales trends. The report also discusses the Australian economy, energy regulations, and the mismatch between fuel demand and supply. Furthermore, the study includes a literature review, methodology, results, and discussion sections, offering recommendations and acknowledging limitations. This report aims to provide valuable insights into the automotive market and contribute to the understanding of the factors affecting Toyota's car sales in Australia.
Topic-Role of the fuel factor responding for selling Toyota cars according to the
geographical areas in Australia
Executive Summary
The current research has been conducted to find the impact of geographical factors and the fuel
factors on the car sales of Toyota in Australia. Secondary data for the analysis has been collected
from various secondary sources. For the analysis purpose different statistical techniques were
used such as descriptive statistics, t test, ANOVA, correlation and multiple regression models.
Global climate change and energy consumption has been one of the most researched topics in
last few years(SUGANUMA 2015; Vaezipour et al. 2015; Valadkhan & Smyth 2016). This is
because the problem of climate change has become more serious all around the world and most
of the developed nations are now focusing sustainable development instead of economic growth
only. So the case of declining sales of Toyota and the fuel factors affecting it would provide the
different dimension for the researchers. It would be interesting to see how the automobile
industry will adjust to the changes made by government to comply with the sustainable
development initiatives. In this research apart from the fuel factors the geographic factors has
also been discussed.
Paraphrase This Document
Need a fresh take? Get an instant paraphrase of this document with our AI Paraphraser
Contents
Executive Summary.................................................................................................................................1
1.1 Introduction-................................................................................................................................2
1.2 Problem statement......................................................................................................................2
1.3 Research aims and objectives......................................................................................................3
1.4 Literature Review.........................................................................................................................3
1.5 Methodology...............................................................................................................................7
1.5.1 Data collection.....................................................................................................................7
1.5.2 Data analysis........................................................................................................................7
1.6 Results and Discussion.................................................................................................................7
1.6.1 Impact of car sales in different regions in Australia on the car sales of Toyota...................8
1.6.2 Impact of fuel related factors on the sales of Toyota cars.................................................13
1.6.3 Hypothesis testing.............................................................................................................18
1.7 Conclusion.................................................................................................................................19
1.7.1 Recommendations.............................................................................................................19
1.7.2 Limitation of the study.......................................................................................................20
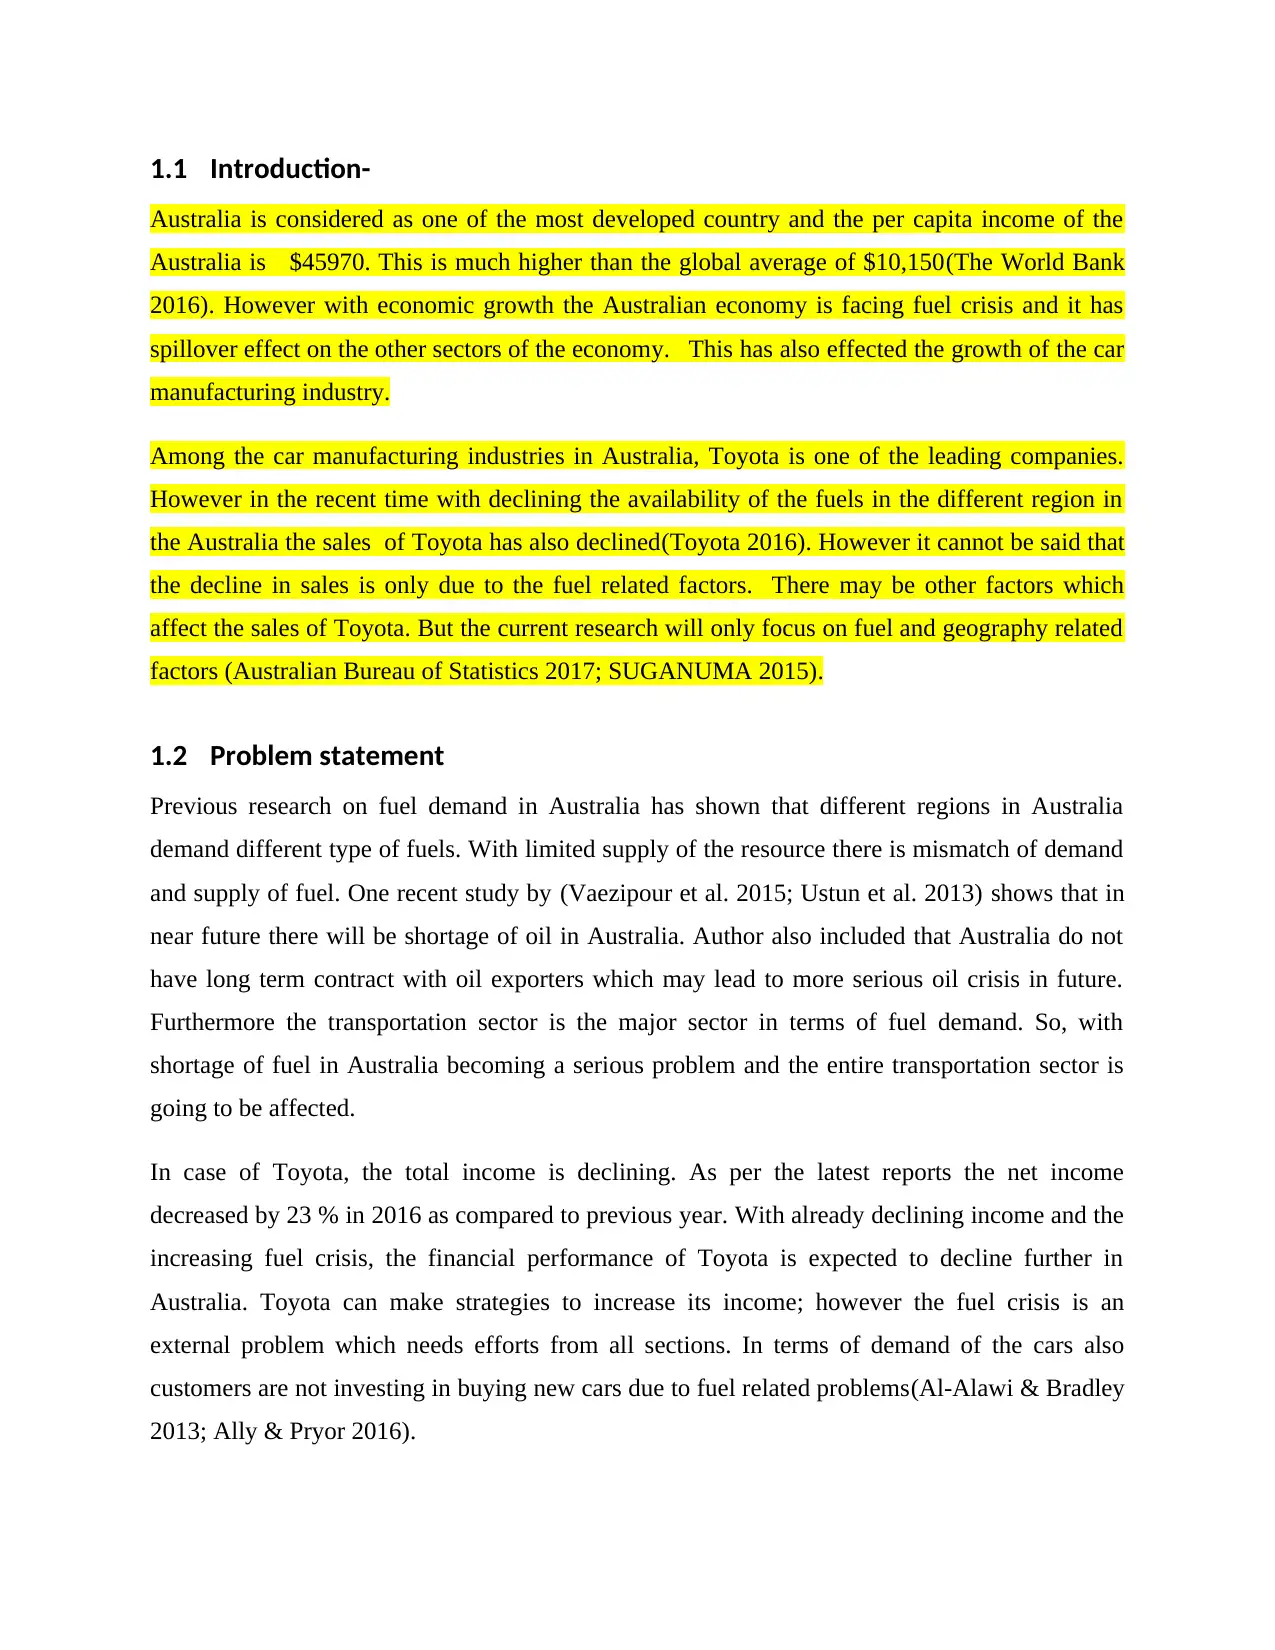
1.1 Introduction-
Australia is considered as one of the most developed country and the per capita income of the
Australia is $45970. This is much higher than the global average of $10,150(The World Bank
2016). However with economic growth the Australian economy is facing fuel crisis and it has
spillover effect on the other sectors of the economy. This has also effected the growth of the car
manufacturing industry.
Among the car manufacturing industries in Australia, Toyota is one of the leading companies.
However in the recent time with declining the availability of the fuels in the different region in
the Australia the sales of Toyota has also declined(Toyota 2016). However it cannot be said that
the decline in sales is only due to the fuel related factors. There may be other factors which
affect the sales of Toyota. But the current research will only focus on fuel and geography related
factors (Australian Bureau of Statistics 2017; SUGANUMA 2015).
1.2 Problem statement
Previous research on fuel demand in Australia has shown that different regions in Australia
demand different type of fuels. With limited supply of the resource there is mismatch of demand
and supply of fuel. One recent study by (Vaezipour et al. 2015; Ustun et al. 2013) shows that in
near future there will be shortage of oil in Australia. Author also included that Australia do not
have long term contract with oil exporters which may lead to more serious oil crisis in future.
Furthermore the transportation sector is the major sector in terms of fuel demand. So, with
shortage of fuel in Australia becoming a serious problem and the entire transportation sector is
going to be affected.
In case of Toyota, the total income is declining. As per the latest reports the net income
decreased by 23 % in 2016 as compared to previous year. With already declining income and the
increasing fuel crisis, the financial performance of Toyota is expected to decline further in
Australia. Toyota can make strategies to increase its income; however the fuel crisis is an
external problem which needs efforts from all sections. In terms of demand of the cars also
customers are not investing in buying new cars due to fuel related problems(Al-Alawi & Bradley
2013; Ally & Pryor 2016).
⊘ This is a preview!⊘
Do you want full access?
Subscribe today to unlock all pages.
Trusted by 1+ million students worldwide
With such situation in Australia in terms of car sales and fuel, this research has been conducted
to find the impact of fuel and the geography related factors on the sales of Toyota in Australia.
1.3 Research aims and objectives
Aims and Objectives
The current research is aimed to examine the impact of fuel factors and geographical on
Toyota sales in Australia.. Apart from this the current research will also highlights geographical
fuel challenges.
Objectives
To analyze the role fuel factors affecting cars sale of Toyota in Australia
To find the impact of geographical factors affecting cars sale of Toyota in Australia
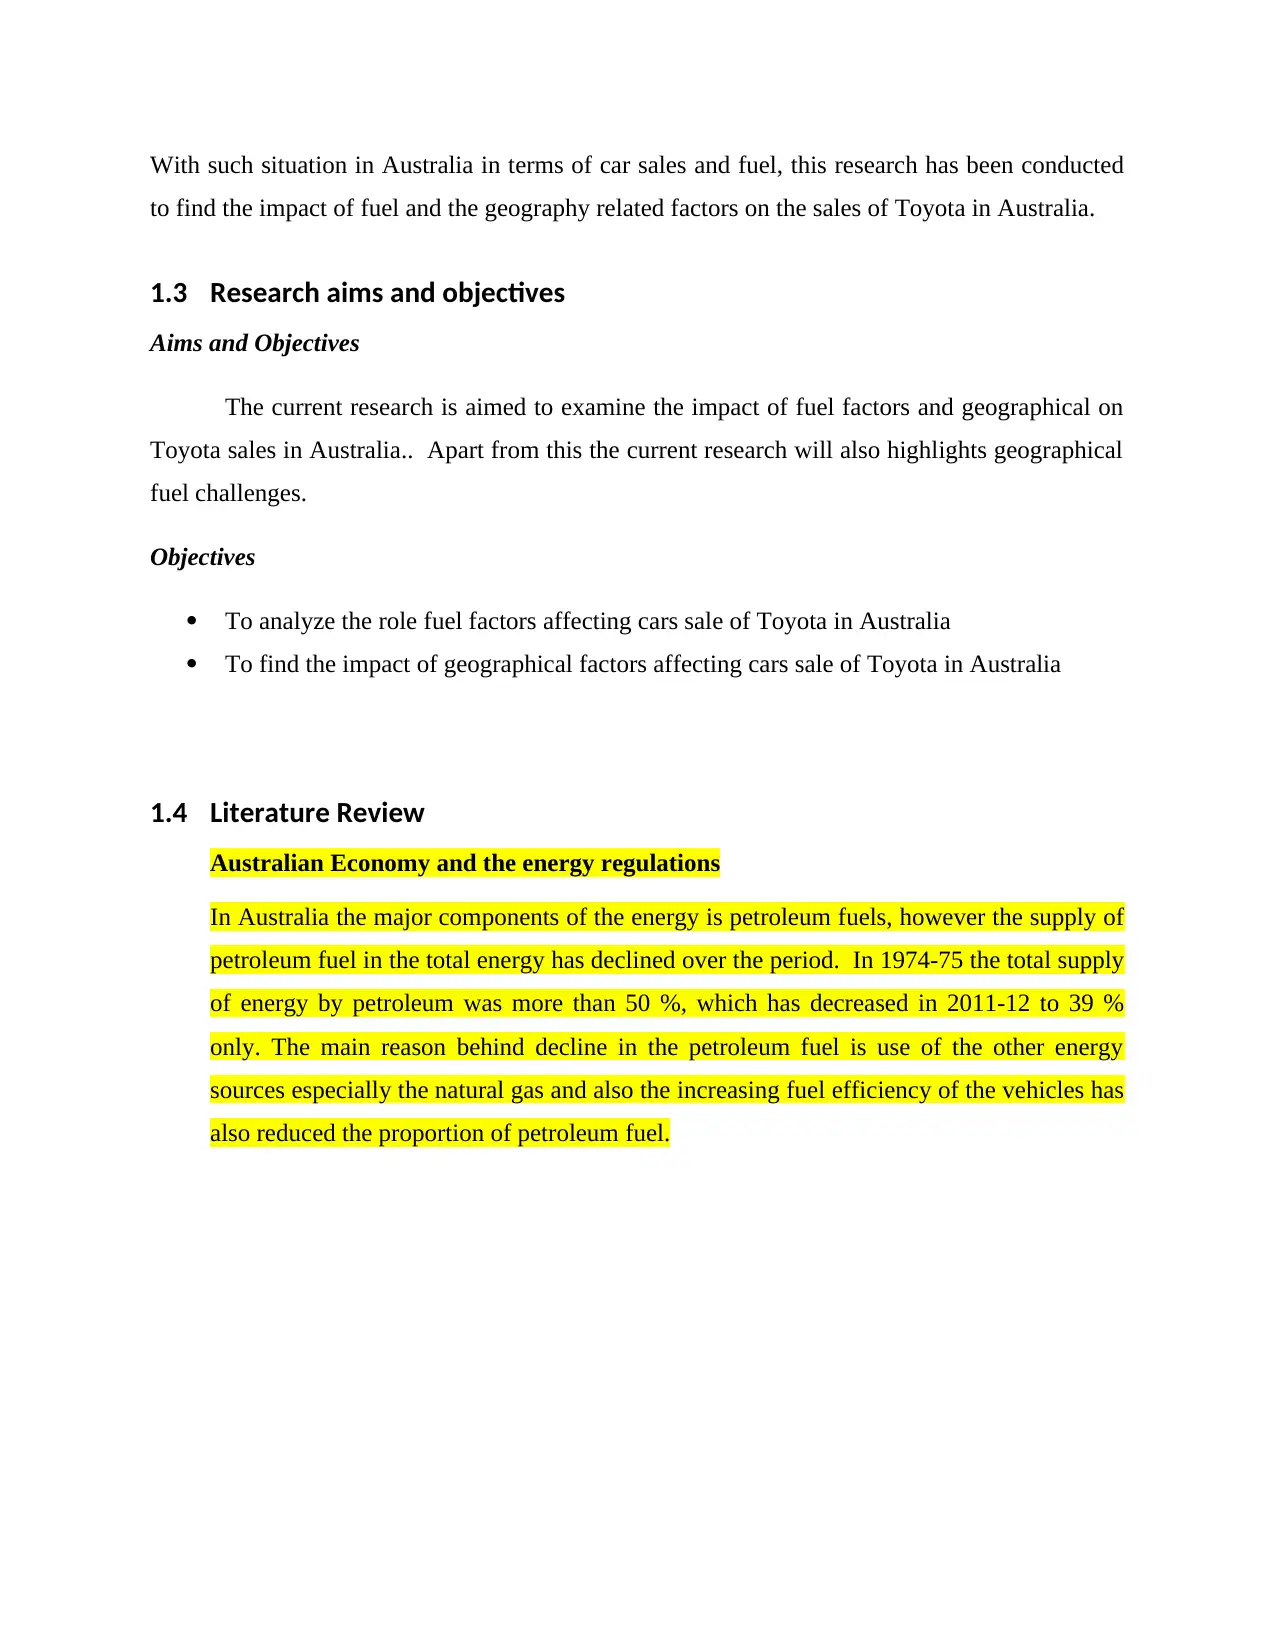
1.4 Literature Review
Australian Economy and the energy regulations
In Australia the major components of the energy is petroleum fuels, however the supply of
petroleum fuel in the total energy has declined over the period. In 1974-75 the total supply
of energy by petroleum was more than 50 %, which has decreased in 2011-12 to 39 %
only. The main reason behind decline in the petroleum fuel is use of the other energy
sources especially the natural gas and also the increasing fuel efficiency of the vehicles has
also reduced the proportion of petroleum fuel.
to find the impact of fuel and the geography related factors on the sales of Toyota in Australia.
1.3 Research aims and objectives
Aims and Objectives
The current research is aimed to examine the impact of fuel factors and geographical on
Toyota sales in Australia.. Apart from this the current research will also highlights geographical
fuel challenges.
Objectives
To analyze the role fuel factors affecting cars sale of Toyota in Australia
To find the impact of geographical factors affecting cars sale of Toyota in Australia
1.4 Literature Review
Australian Economy and the energy regulations
In Australia the major components of the energy is petroleum fuels, however the supply of
petroleum fuel in the total energy has declined over the period. In 1974-75 the total supply
of energy by petroleum was more than 50 %, which has decreased in 2011-12 to 39 %
only. The main reason behind decline in the petroleum fuel is use of the other energy
sources especially the natural gas and also the increasing fuel efficiency of the vehicles has
also reduced the proportion of petroleum fuel.
Paraphrase This Document
Need a fresh take? Get an instant paraphrase of this document with our AI Paraphraser
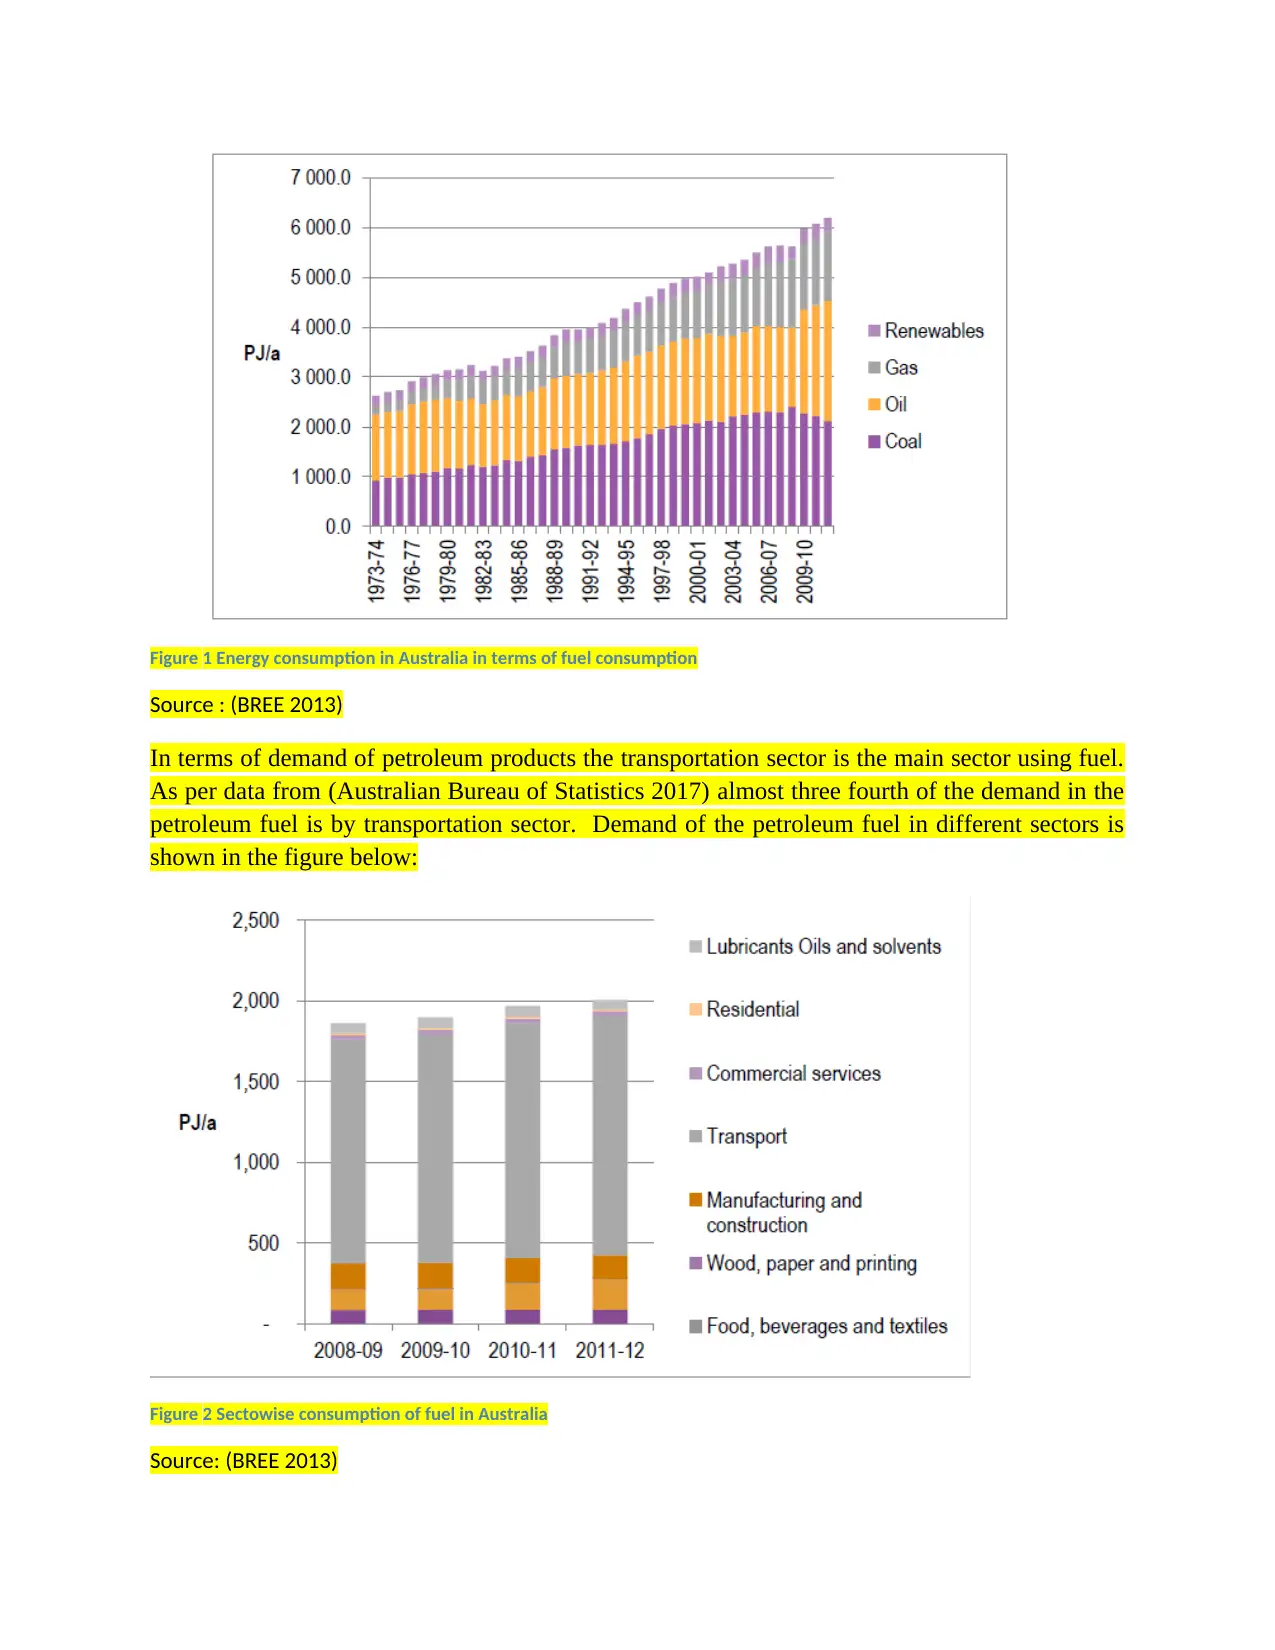
Figure 1 Energy consumption in Australia in terms of fuel consumption
Source : (BREE 2013)
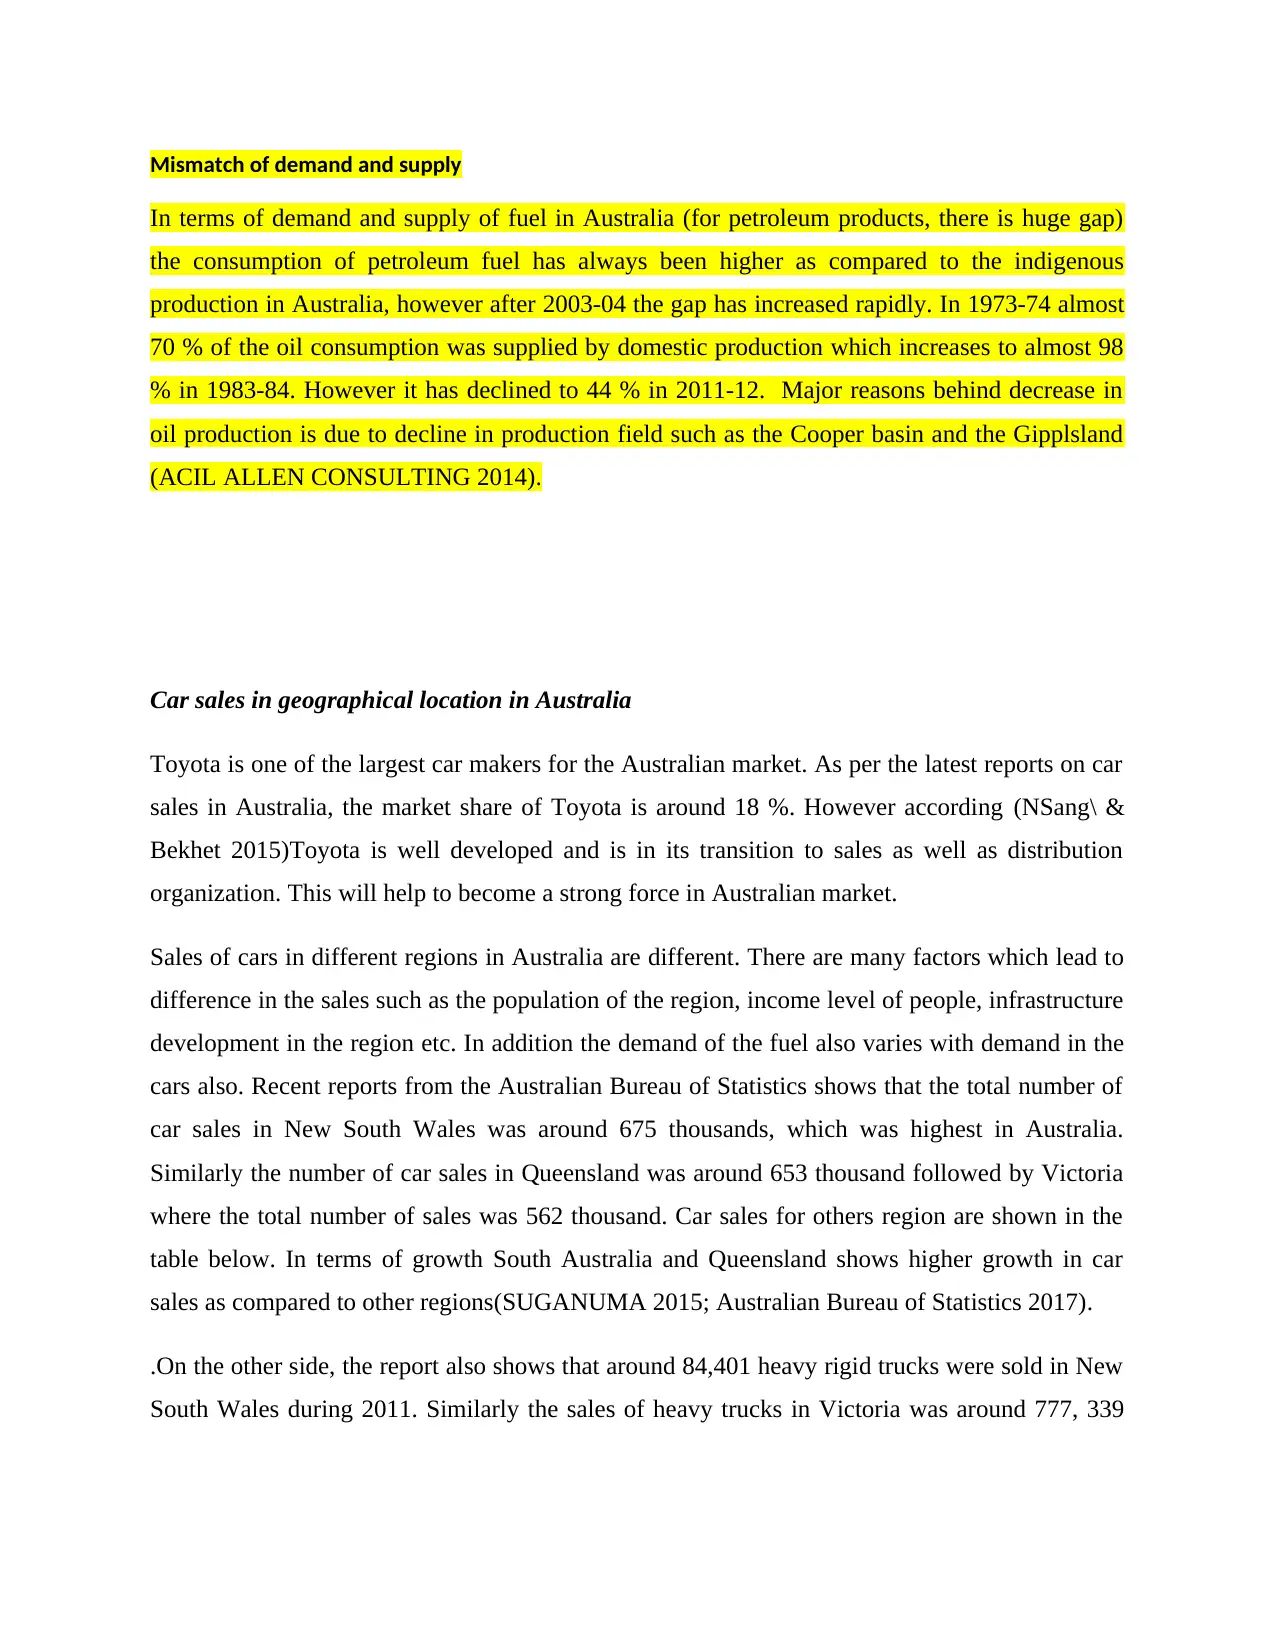
In terms of demand of petroleum products the transportation sector is the main sector using fuel.
As per data from (Australian Bureau of Statistics 2017) almost three fourth of the demand in the
petroleum fuel is by transportation sector. Demand of the petroleum fuel in different sectors is
shown in the figure below:
Figure 2 Sectowise consumption of fuel in Australia
Source: (BREE 2013)
Source : (BREE 2013)
In terms of demand of petroleum products the transportation sector is the main sector using fuel.
As per data from (Australian Bureau of Statistics 2017) almost three fourth of the demand in the
petroleum fuel is by transportation sector. Demand of the petroleum fuel in different sectors is
shown in the figure below:
Figure 2 Sectowise consumption of fuel in Australia
Source: (BREE 2013)
Mismatch of demand and supply
In terms of demand and supply of fuel in Australia (for petroleum products, there is huge gap)
the consumption of petroleum fuel has always been higher as compared to the indigenous
production in Australia, however after 2003-04 the gap has increased rapidly. In 1973-74 almost
70 % of the oil consumption was supplied by domestic production which increases to almost 98
% in 1983-84. However it has declined to 44 % in 2011-12. Major reasons behind decrease in
oil production is due to decline in production field such as the Cooper basin and the Gipplsland
(ACIL ALLEN CONSULTING 2014).
Car sales in geographical location in Australia
Toyota is one of the largest car makers for the Australian market. As per the latest reports on car
sales in Australia, the market share of Toyota is around 18 %. However according (NSang\ &
Bekhet 2015)Toyota is well developed and is in its transition to sales as well as distribution
organization. This will help to become a strong force in Australian market.
Sales of cars in different regions in Australia are different. There are many factors which lead to
difference in the sales such as the population of the region, income level of people, infrastructure
development in the region etc. In addition the demand of the fuel also varies with demand in the
cars also. Recent reports from the Australian Bureau of Statistics shows that the total number of
car sales in New South Wales was around 675 thousands, which was highest in Australia.
Similarly the number of car sales in Queensland was around 653 thousand followed by Victoria
where the total number of sales was 562 thousand. Car sales for others region are shown in the
table below. In terms of growth South Australia and Queensland shows higher growth in car
sales as compared to other regions(SUGANUMA 2015; Australian Bureau of Statistics 2017).
.On the other side, the report also shows that around 84,401 heavy rigid trucks were sold in New
South Wales during 2011. Similarly the sales of heavy trucks in Victoria was around 777, 339
⊘ This is a preview!⊘
Do you want full access?
Subscribe today to unlock all pages.
Trusted by 1+ million students worldwide
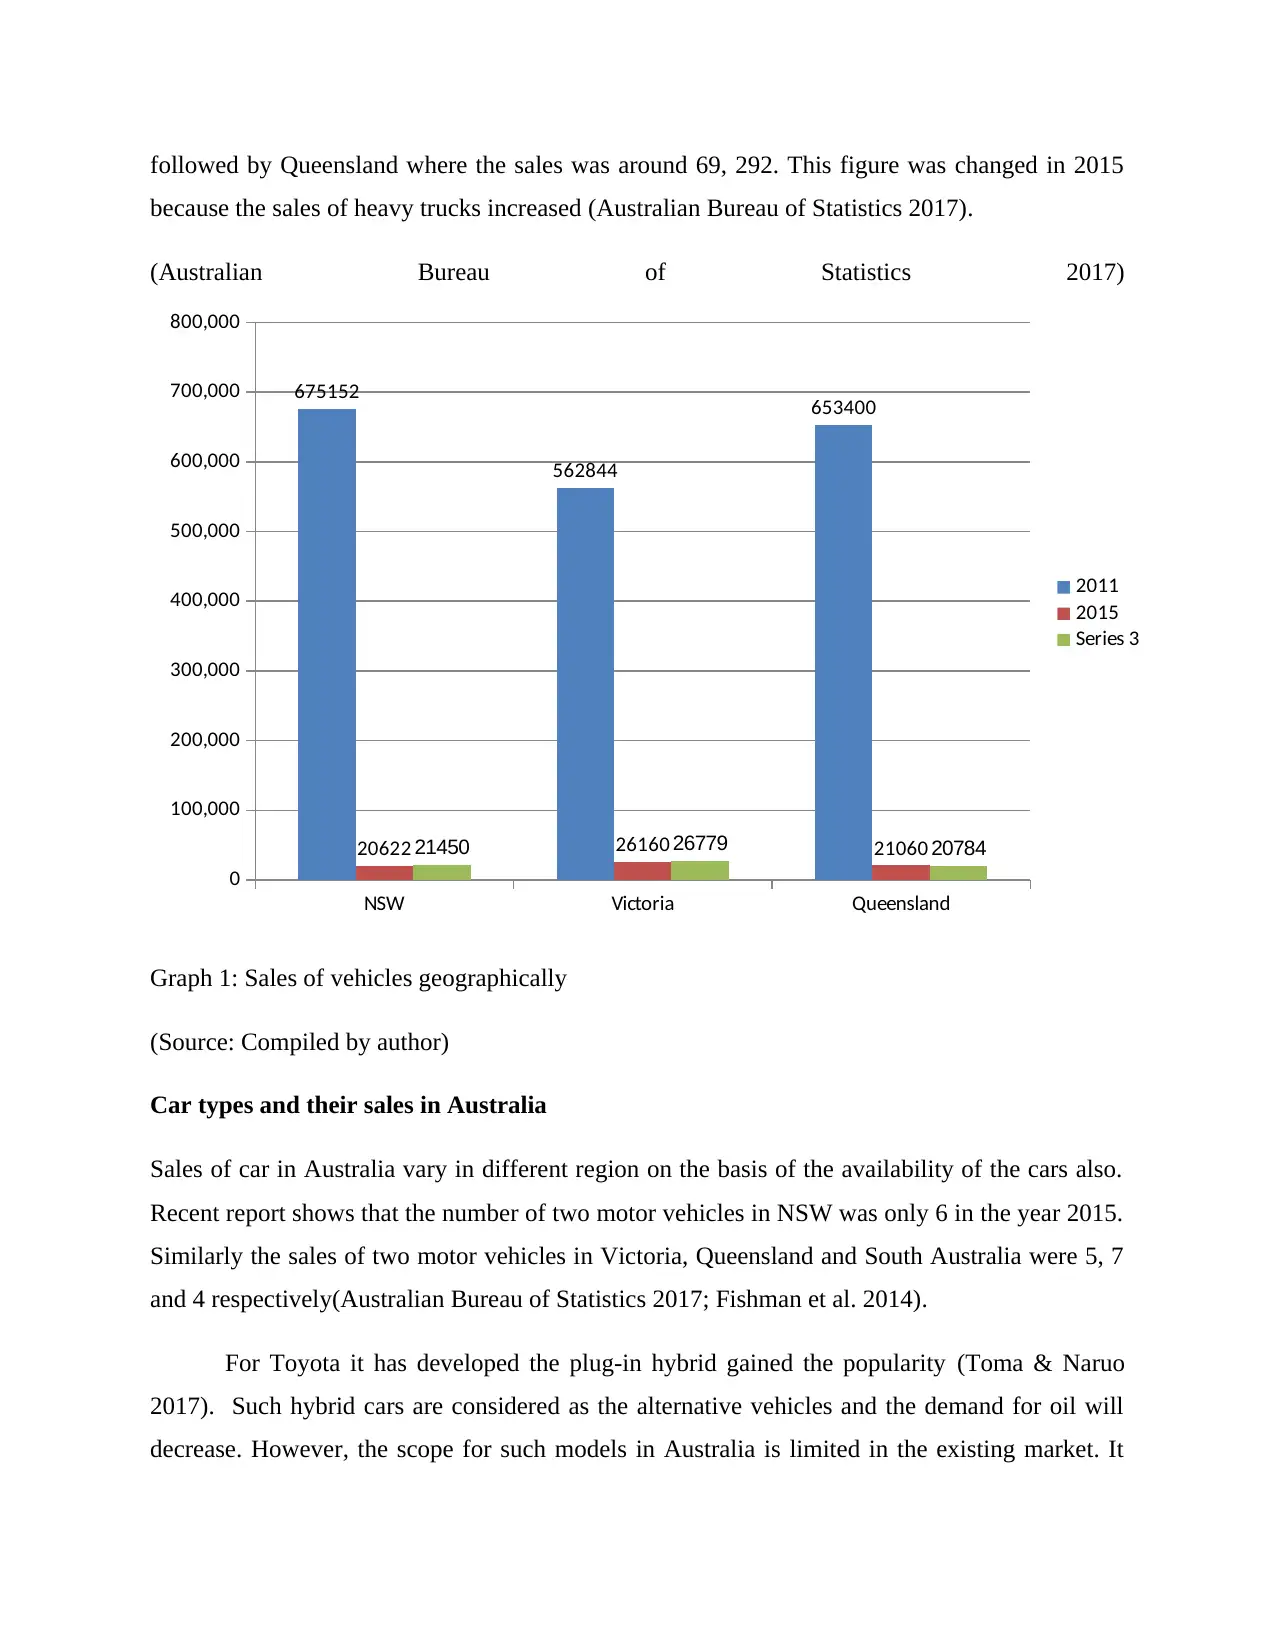
followed by Queensland where the sales was around 69, 292. This figure was changed in 2015
because the sales of heavy trucks increased (Australian Bureau of Statistics 2017).
(Australian Bureau of Statistics 2017)
NSW Victoria Queensland
0
100,000
200,000
300,000
400,000
500,000
600,000
700,000
800,000
675152
562844
653400
20622 26160 2106021450 26779 20784
2011
2015
Series 3
Graph 1: Sales of vehicles geographically
(Source: Compiled by author)
Car types and their sales in Australia
Sales of car in Australia vary in different region on the basis of the availability of the cars also.
Recent report shows that the number of two motor vehicles in NSW was only 6 in the year 2015.
Similarly the sales of two motor vehicles in Victoria, Queensland and South Australia were 5, 7
and 4 respectively(Australian Bureau of Statistics 2017; Fishman et al. 2014).
For Toyota it has developed the plug-in hybrid gained the popularity (Toma & Naruo
2017). Such hybrid cars are considered as the alternative vehicles and the demand for oil will
decrease. However, the scope for such models in Australia is limited in the existing market. It
Paraphrase This Document
Need a fresh take? Get an instant paraphrase of this document with our AI Paraphraser
has been shown that Toyota has been selling hybrid vehicles for more than eight years. This has
helped Toyota to establish its dominance in alternative fuel category. After the global trail,
Toyota in the recent time has been leading this technology by manufacturing its hybrid Synergy
Drive system(Ally & Pryor 2016; Ustun et al. 2013; Vaezipour et al. 2015).
So on the basis of the literature review it has been observed that fuel types used in Australia
varies with different region and the number of vehicles sold also varies. Most of the researches
related to fuel and the geographical factors have not been taken into consideration, so this
research has been used to contribute to fill some gaps in the literature(Azadfa et al. 2015; Mills
& IMacGill 2014; Toma & Naruo 2017; Vaezipour et al. 2015).
1.5 Methodology
1.5.1 Data collection
This research is entirely based on the secondary research and the required data was collected
from various government databases such as Australian Bureau of Statistics and Australian
Energy Statistics(BREE 2013; Australian Bureau of Statistics 2017).
1.5.2 Data analysis
Collected data has been analyzed using different statistical techniques such as t test, ANOVA,
correlation and multiple regressions. T test is used to check whether the sample is from same
mean or not(Kumar 2014). On the other hand ANOVA is used to check the same but with two or
more categories. Furthermore correlation analysis is performed to examine the relationship
between two variables. The value of correlation lies between [-1, 1] where -1 shows perfect
negative correlation and +1 indicates perfect positive correlation. Finally the regression analysis
is used to measure the impact of independent variable on dependent variables(Cierniak &
Reimann 2011; Macdonald & Headlam 2010).
1.6 Results and Discussion
This research is aimed to find the impact of the fuel related factors on care sales of Toyota in
Australia. For the analysis purpose secondary data was collected from the database of Australian
Bureau of Statistics and the Australian Energy Statistics. For the geographical sales of the
vehicle in different regions the month wise data was collected. Similarly for the fuel related data
only the annual data was available, so annual data was used. To analyze the data various
statistical techniques were used. Results from the data analysis have been discussed in this
chapter. In the first section the results for the geographical related variables has been presented.
Similarly in the second section results for the fuel related factors has been explained.
1.6.1 Impact of car sales in different regions in Australia on the car sales of Toyota
In this research 7 major regions in Australia were taken into consideration namely New South
Wales (NSW), Victoria (VIC), Queensland (QLD), Southern Australia (SA), Western Australia
(WA), Tasmania (TAS) and Northern Territory (NT). Apart from the geographical factors energy
consumption in the transportation sector in Australia has also been including in the study to
study the impact of energy demands on sales of the Toyota cars in Australia.
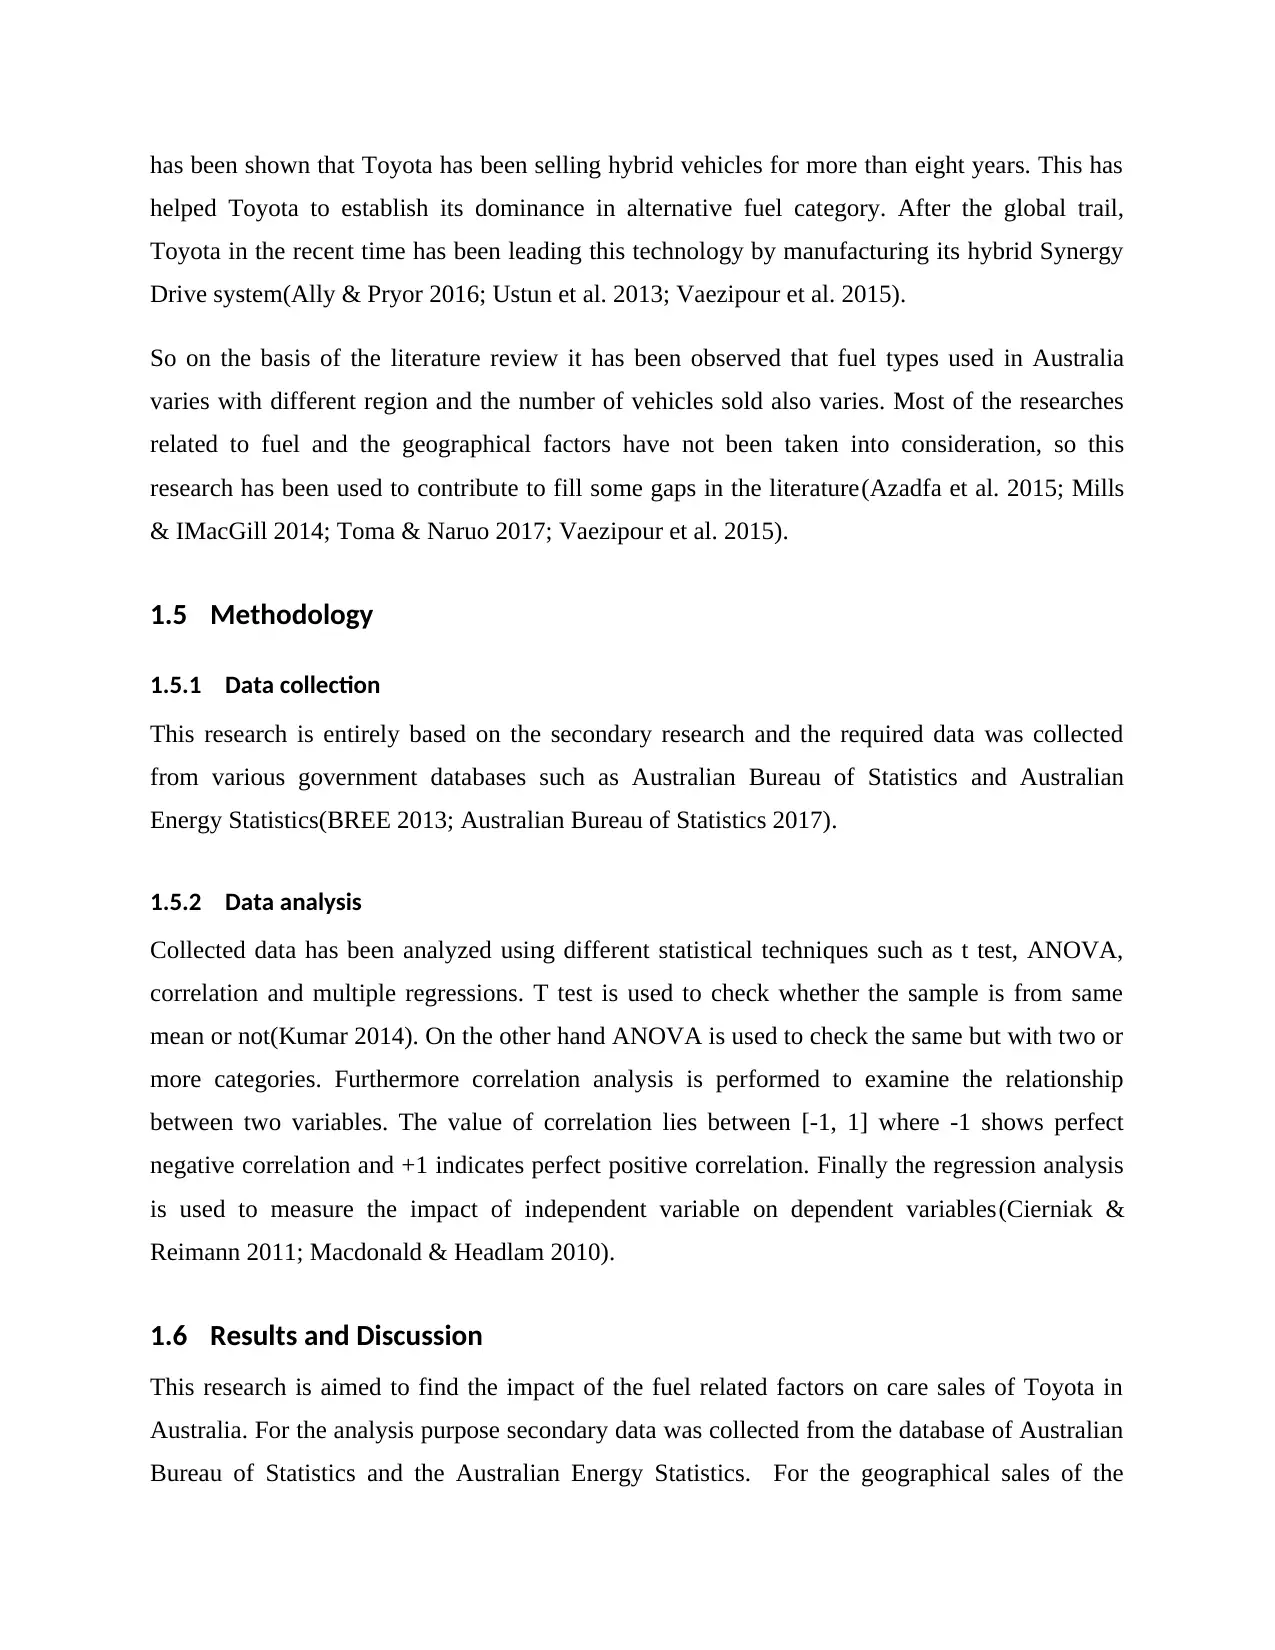
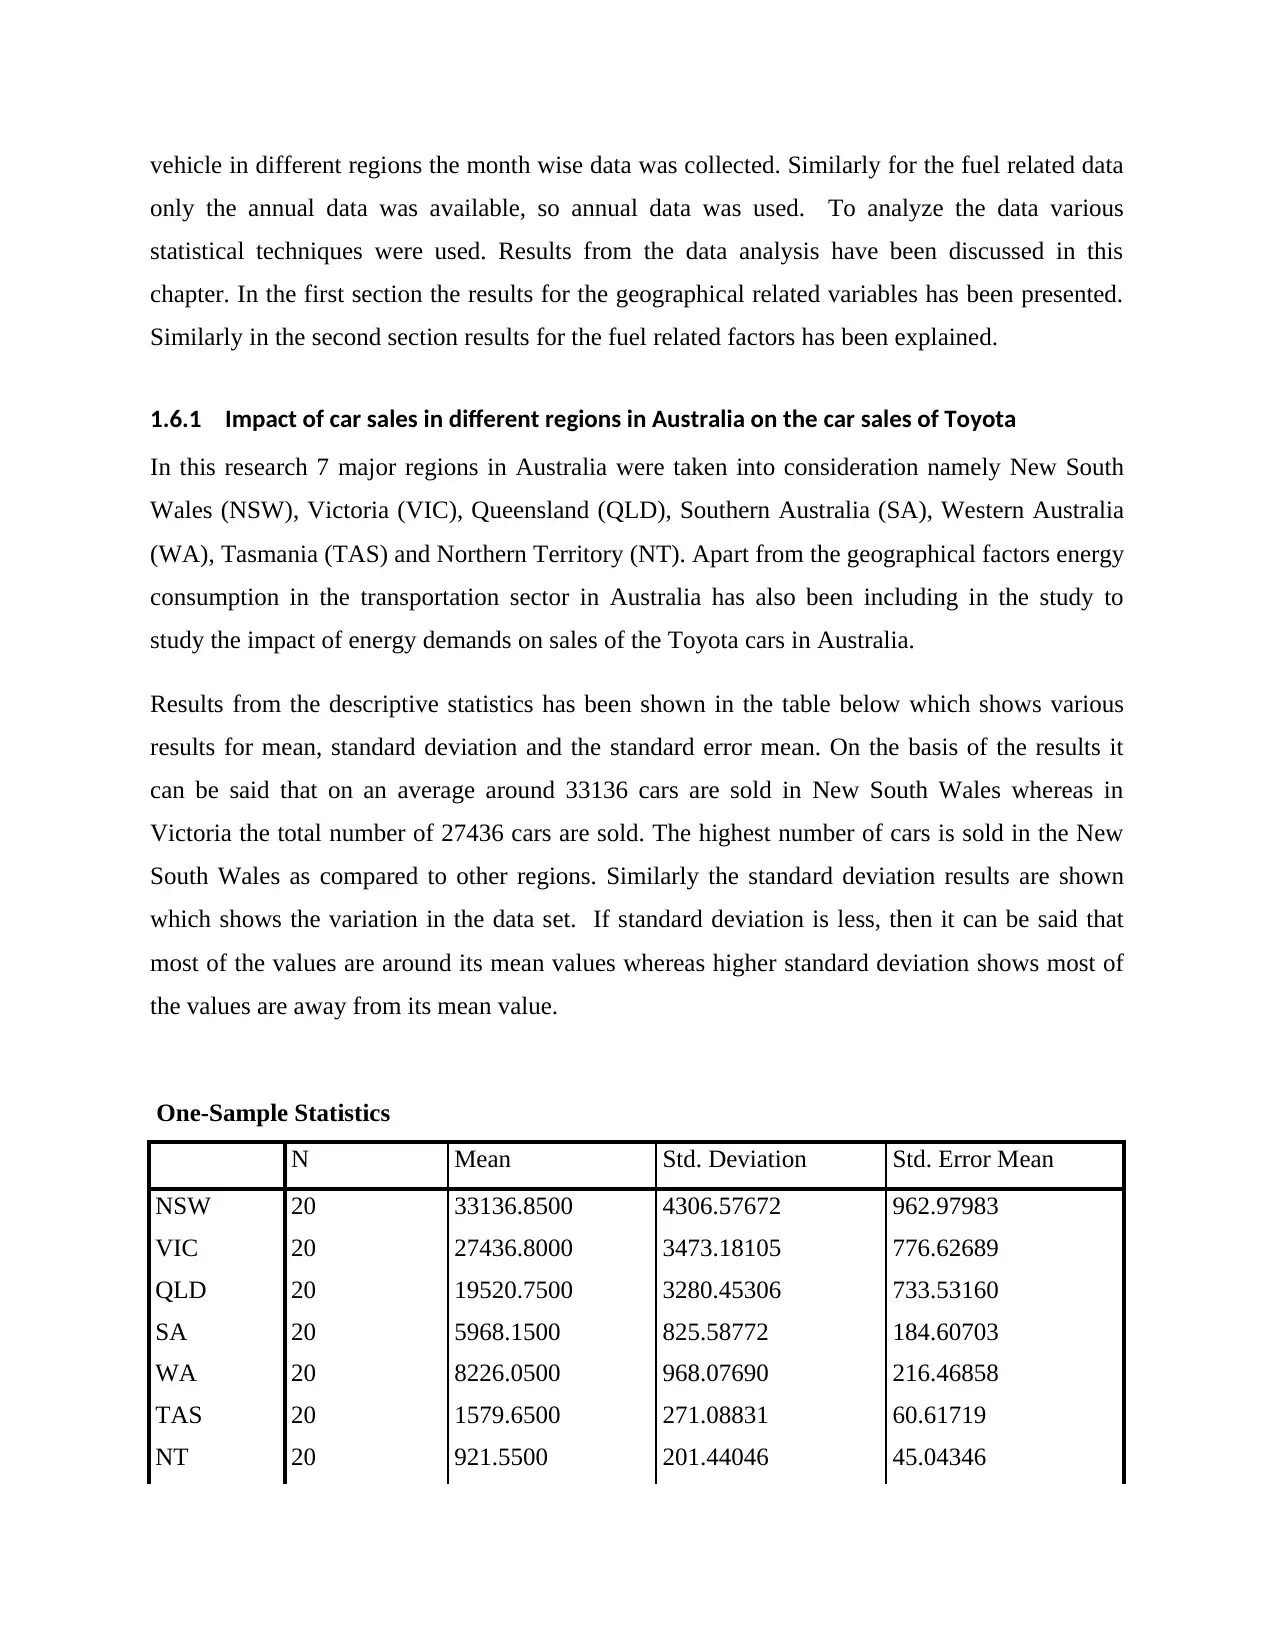
Results from the descriptive statistics has been shown in the table below which shows various
results for mean, standard deviation and the standard error mean. On the basis of the results it
can be said that on an average around 33136 cars are sold in New South Wales whereas in
Victoria the total number of 27436 cars are sold. The highest number of cars is sold in the New
South Wales as compared to other regions. Similarly the standard deviation results are shown
which shows the variation in the data set. If standard deviation is less, then it can be said that
most of the values are around its mean values whereas higher standard deviation shows most of
the values are away from its mean value.
One-Sample Statistics
N Mean Std. Deviation Std. Error Mean
NSW 20 33136.8500 4306.57672 962.97983
VIC 20 27436.8000 3473.18105 776.62689
QLD 20 19520.7500 3280.45306 733.53160
SA 20 5968.1500 825.58772 184.60703
WA 20 8226.0500 968.07690 216.46858
TAS 20 1579.6500 271.08831 60.61719
NT 20 921.5500 201.44046 45.04346
only the annual data was available, so annual data was used. To analyze the data various
statistical techniques were used. Results from the data analysis have been discussed in this
chapter. In the first section the results for the geographical related variables has been presented.
Similarly in the second section results for the fuel related factors has been explained.
1.6.1 Impact of car sales in different regions in Australia on the car sales of Toyota
In this research 7 major regions in Australia were taken into consideration namely New South
Wales (NSW), Victoria (VIC), Queensland (QLD), Southern Australia (SA), Western Australia
(WA), Tasmania (TAS) and Northern Territory (NT). Apart from the geographical factors energy
consumption in the transportation sector in Australia has also been including in the study to
study the impact of energy demands on sales of the Toyota cars in Australia.
Results from the descriptive statistics has been shown in the table below which shows various
results for mean, standard deviation and the standard error mean. On the basis of the results it
can be said that on an average around 33136 cars are sold in New South Wales whereas in
Victoria the total number of 27436 cars are sold. The highest number of cars is sold in the New
South Wales as compared to other regions. Similarly the standard deviation results are shown
which shows the variation in the data set. If standard deviation is less, then it can be said that
most of the values are around its mean values whereas higher standard deviation shows most of
the values are away from its mean value.
One-Sample Statistics
N Mean Std. Deviation Std. Error Mean
NSW 20 33136.8500 4306.57672 962.97983
VIC 20 27436.8000 3473.18105 776.62689
QLD 20 19520.7500 3280.45306 733.53160
SA 20 5968.1500 825.58772 184.60703
WA 20 8226.0500 968.07690 216.46858
TAS 20 1579.6500 271.08831 60.61719
NT 20 921.5500 201.44046 45.04346
⊘ This is a preview!⊘
Do you want full access?
Subscribe today to unlock all pages.
Trusted by 1+ million students worldwide
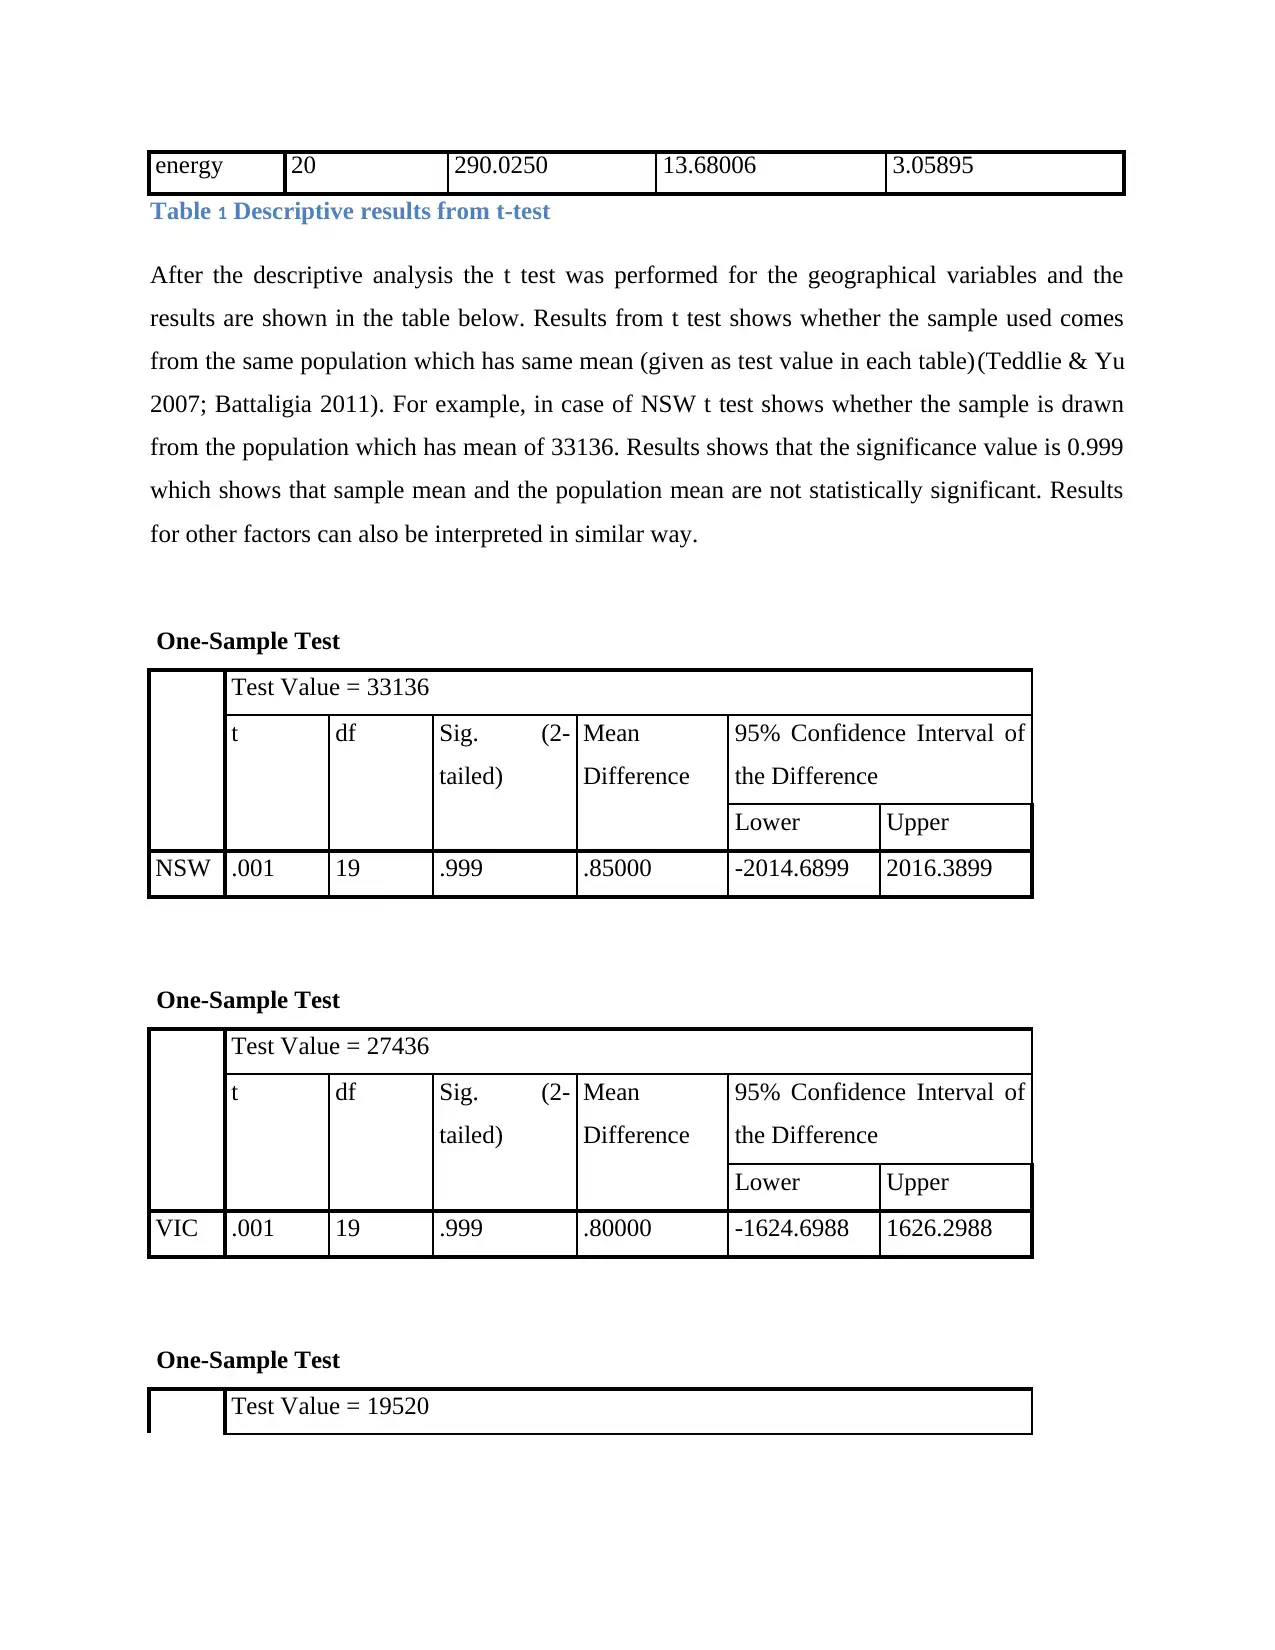
energy 20 290.0250 13.68006 3.05895
Table 1 Descriptive results from t-test
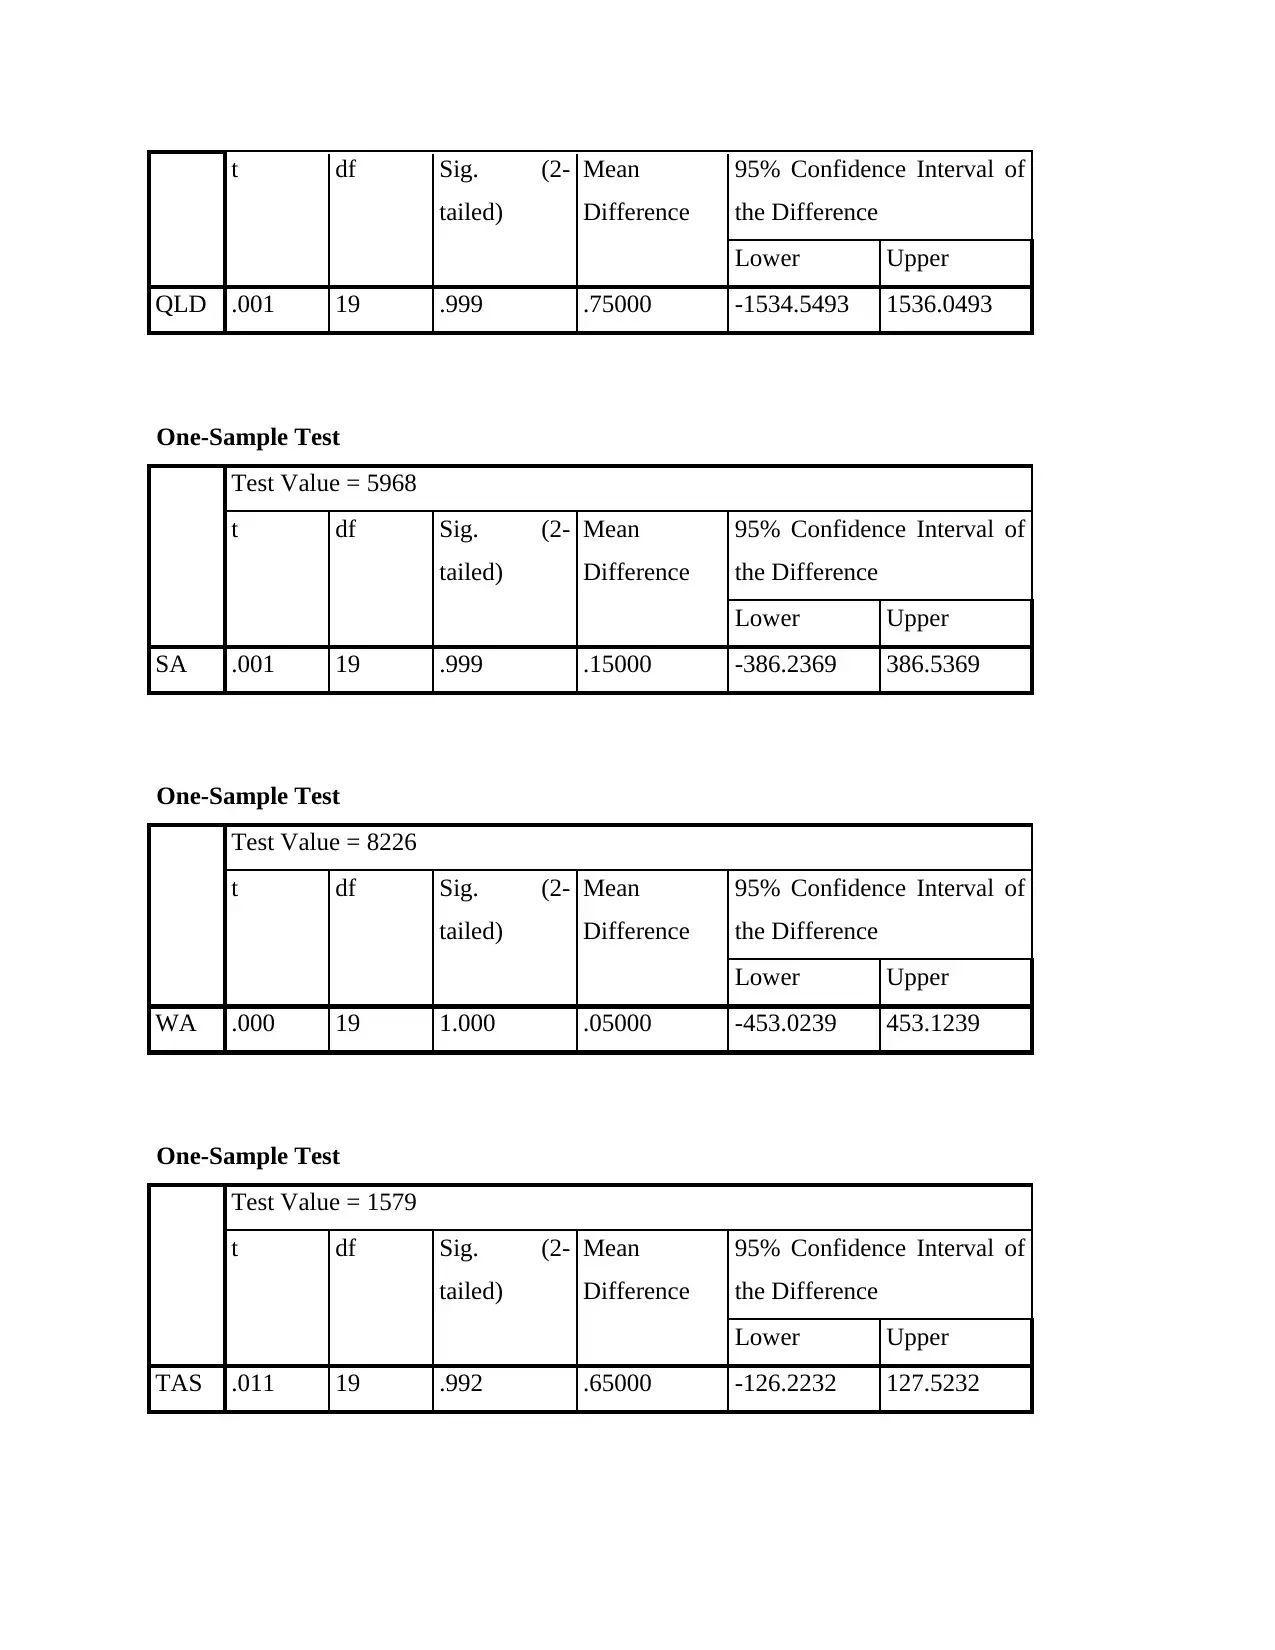
After the descriptive analysis the t test was performed for the geographical variables and the
results are shown in the table below. Results from t test shows whether the sample used comes
from the same population which has same mean (given as test value in each table)(Teddlie & Yu
2007; Battaligia 2011). For example, in case of NSW t test shows whether the sample is drawn
from the population which has mean of 33136. Results shows that the significance value is 0.999
which shows that sample mean and the population mean are not statistically significant. Results
for other factors can also be interpreted in similar way.
One-Sample Test
Test Value = 33136
t df Sig. (2-
tailed)
Mean
Difference
95% Confidence Interval of
the Difference
Lower Upper
NSW .001 19 .999 .85000 -2014.6899 2016.3899
One-Sample Test
Test Value = 27436
t df Sig. (2-
tailed)
Mean
Difference
95% Confidence Interval of
the Difference
Lower Upper
VIC .001 19 .999 .80000 -1624.6988 1626.2988
One-Sample Test
Test Value = 19520
Table 1 Descriptive results from t-test
After the descriptive analysis the t test was performed for the geographical variables and the
results are shown in the table below. Results from t test shows whether the sample used comes
from the same population which has same mean (given as test value in each table)(Teddlie & Yu
2007; Battaligia 2011). For example, in case of NSW t test shows whether the sample is drawn
from the population which has mean of 33136. Results shows that the significance value is 0.999
which shows that sample mean and the population mean are not statistically significant. Results
for other factors can also be interpreted in similar way.
One-Sample Test
Test Value = 33136
t df Sig. (2-
tailed)
Mean
Difference
95% Confidence Interval of
the Difference
Lower Upper
NSW .001 19 .999 .85000 -2014.6899 2016.3899
One-Sample Test
Test Value = 27436
t df Sig. (2-
tailed)
Mean
Difference
95% Confidence Interval of
the Difference
Lower Upper
VIC .001 19 .999 .80000 -1624.6988 1626.2988
One-Sample Test
Test Value = 19520
Paraphrase This Document
Need a fresh take? Get an instant paraphrase of this document with our AI Paraphraser
t df Sig. (2-
tailed)
Mean
Difference
95% Confidence Interval of
the Difference
Lower Upper
QLD .001 19 .999 .75000 -1534.5493 1536.0493
One-Sample Test
Test Value = 5968
t df Sig. (2-
tailed)
Mean
Difference
95% Confidence Interval of
the Difference
Lower Upper
SA .001 19 .999 .15000 -386.2369 386.5369
One-Sample Test
Test Value = 8226
t df Sig. (2-
tailed)
Mean
Difference
95% Confidence Interval of
the Difference
Lower Upper
WA .000 19 1.000 .05000 -453.0239 453.1239
One-Sample Test
Test Value = 1579
t df Sig. (2-
tailed)
Mean
Difference
95% Confidence Interval of
the Difference
Lower Upper
TAS .011 19 .992 .65000 -126.2232 127.5232
tailed)
Mean
Difference
95% Confidence Interval of
the Difference
Lower Upper
QLD .001 19 .999 .75000 -1534.5493 1536.0493
One-Sample Test
Test Value = 5968
t df Sig. (2-
tailed)
Mean
Difference
95% Confidence Interval of
the Difference
Lower Upper
SA .001 19 .999 .15000 -386.2369 386.5369
One-Sample Test
Test Value = 8226
t df Sig. (2-
tailed)
Mean
Difference
95% Confidence Interval of
the Difference
Lower Upper
WA .000 19 1.000 .05000 -453.0239 453.1239
One-Sample Test
Test Value = 1579
t df Sig. (2-
tailed)
Mean
Difference
95% Confidence Interval of
the Difference
Lower Upper
TAS .011 19 .992 .65000 -126.2232 127.5232
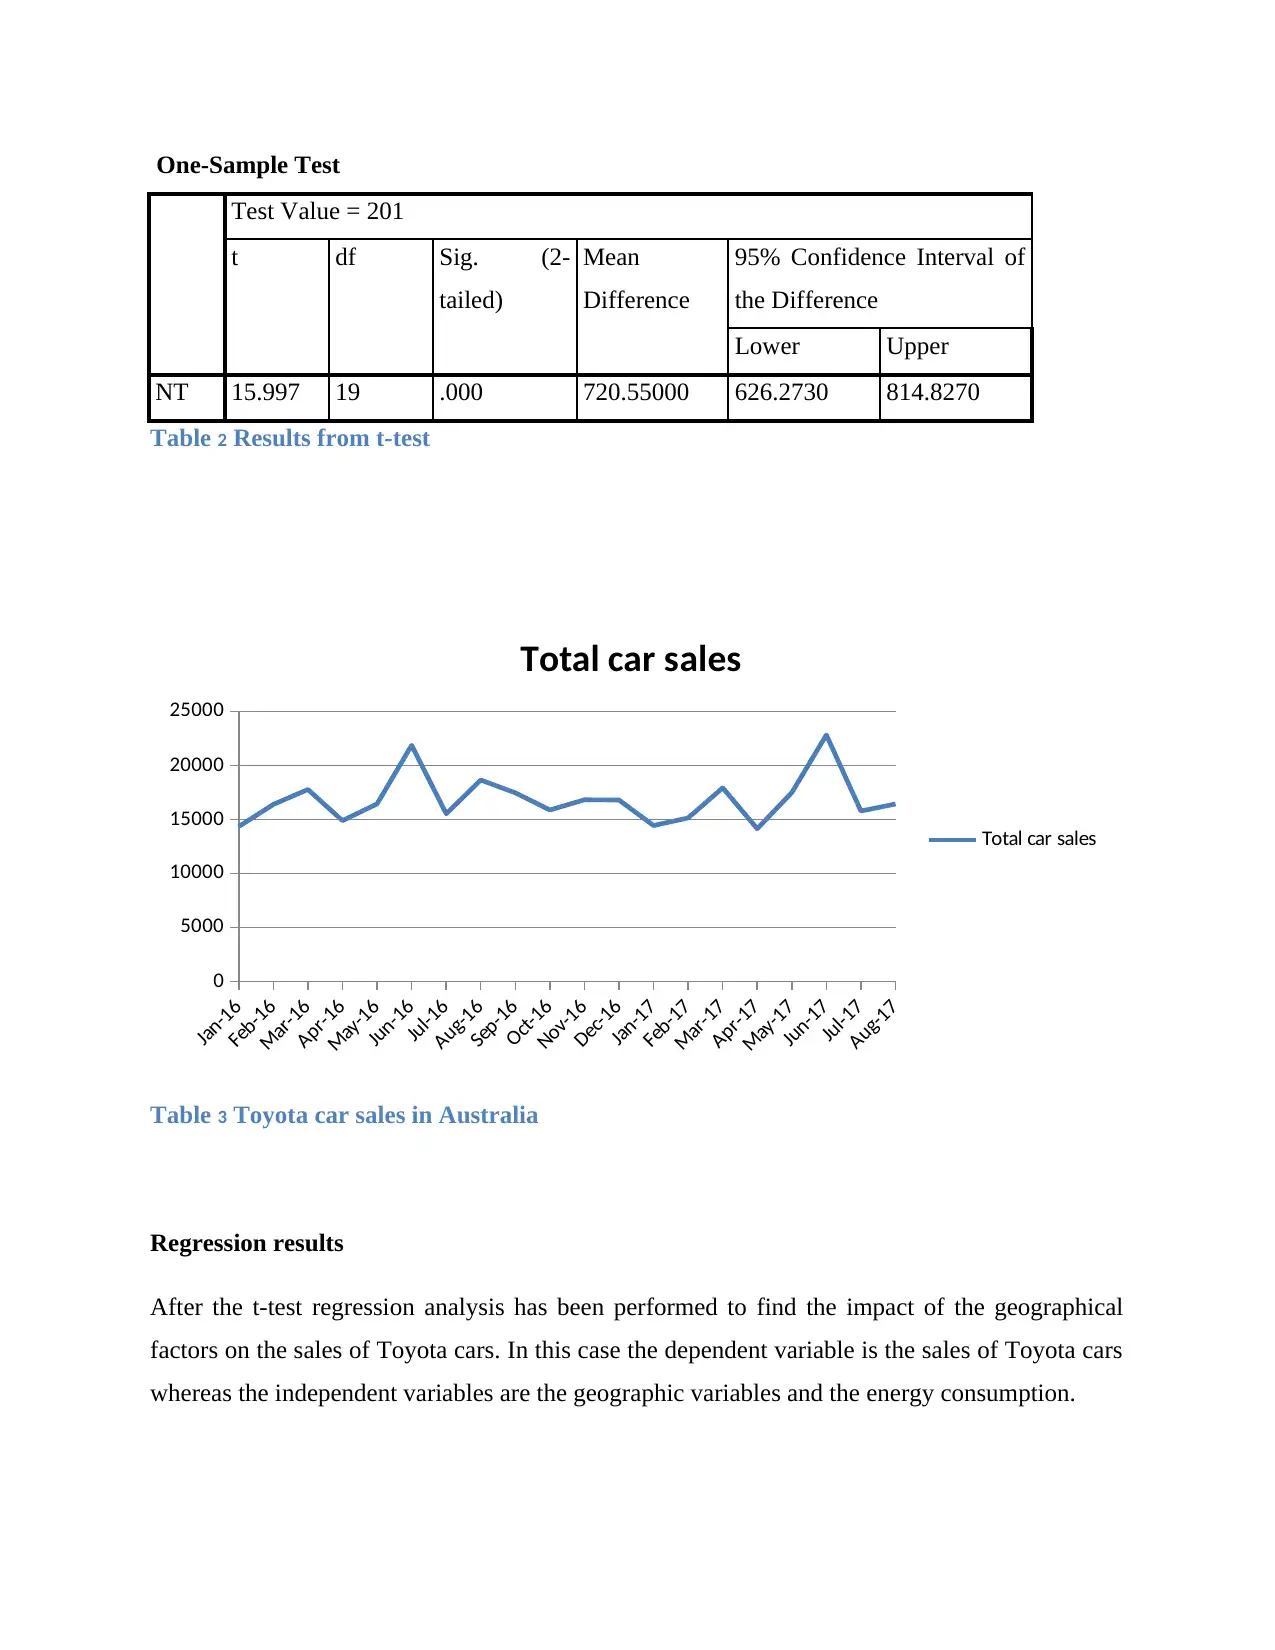
One-Sample Test
Test Value = 201
t df Sig. (2-
tailed)
Mean
Difference
95% Confidence Interval of
the Difference
Lower Upper
NT 15.997 19 .000 720.55000 626.2730 814.8270
Table 2 Results from t-test
Jan-16
Feb-16
Mar-16
Apr-16
May-16
Jun-16
Jul-16
Aug-16
Sep-16
Oct-16
Nov-16
Dec-16
Jan-17
Feb-17
Mar-17
Apr-17
May-17
Jun-17
Jul-17
Aug-17
0
5000
10000
15000
20000
25000
Total car sales
Total car sales
Table 3 Toyota car sales in Australia
Regression results
After the t-test regression analysis has been performed to find the impact of the geographical
factors on the sales of Toyota cars. In this case the dependent variable is the sales of Toyota cars
whereas the independent variables are the geographic variables and the energy consumption.
⊘ This is a preview!⊘
Do you want full access?
Subscribe today to unlock all pages.
Trusted by 1+ million students worldwide
1 out of 24
Related Documents


Your All-in-One AI-Powered Toolkit for Academic Success.
+13062052269
info@desklib.com
Available 24*7 on WhatsApp / Email
![[object Object]](/_next/static/media/star-bottom.7253800d.svg)
Unlock your academic potential
Copyright © 2020–2026 A2Z Services. All Rights Reserved. Developed and managed by ZUCOL.