Ask a question from expert
Research Study - Ratio Analysis & Business Performance Measured
12 Pages3877 Words41 Views
Added on 2020-02-05
Research Study - Ratio Analysis & Business Performance Measured
Added on 2020-02-05
BookmarkShareRelated Documents
FINANCE FOR SME
TABLE OF CONTENTSINTRODUCTION...........................................................................................................................3Question 1........................................................................................................................................3Critically analyses the company performance using ratio analysis over the period 2013 - 2016.For each year calculate 6 ratios only, and show the trend for these ratios over the 5 years........3Question 2........................................................................................................................................6Preparing a budget and sources of finance..................................................................................6Question 3........................................................................................................................................7Evaluating sources of finance and project evaluation methods...................................................7Question 4........................................................................................................................................8Discuss the extent to which the entrepreneurial ecosystem has been responsible for thedevelopment of TrainLine as a business......................................................................................8Question 5........................................................................................................................................9Critically discuss the ethical considerations that should be taken into account in assessingwhen the TrainLine should go for IPO........................................................................................9CONCLUSION................................................................................................................................9REFERENCES..............................................................................................................................11
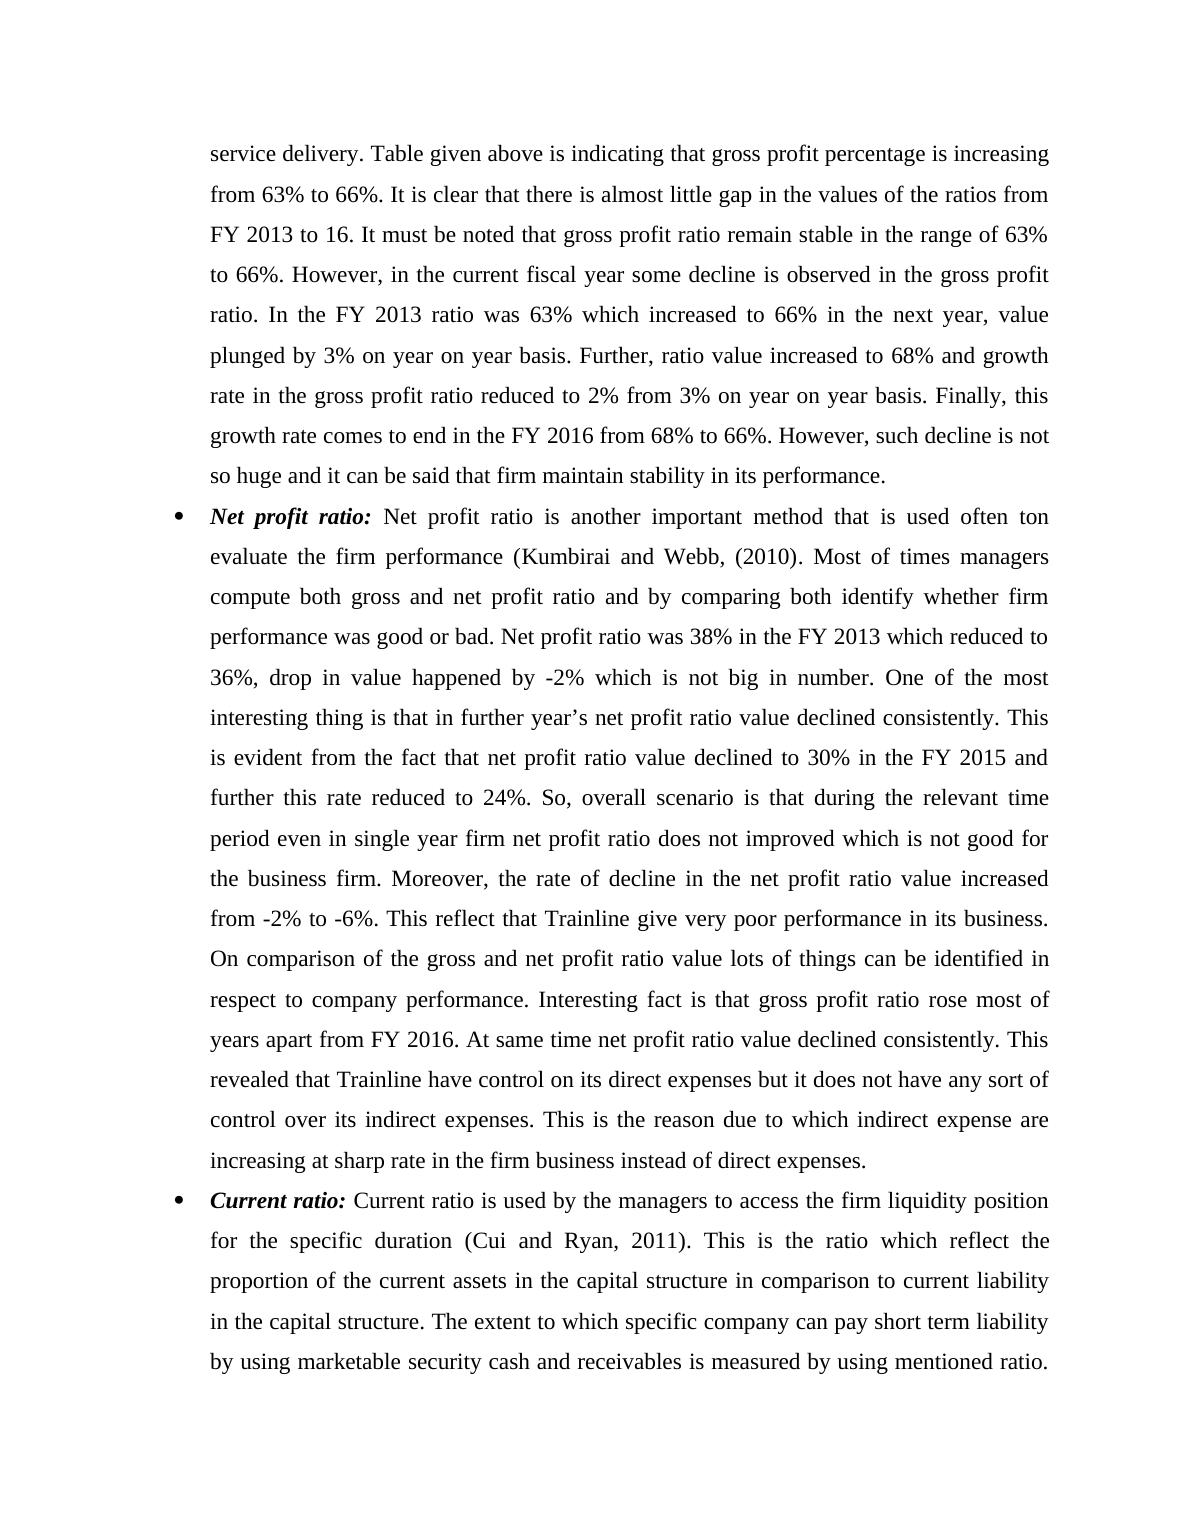
INTRODUCTIONFinance is the factor that greatly affect any business firm. In the current research study ratioanalysis is done and firm business performance is measured. Comments are made on same byevaluating facts and figures of last five years. In middle part of the report, sources of finance arediscussed and same are evaluated in context of firm Trainline. At end of the report, ethicalfactors that must be considered for launching an IPO are discussed briefly. In this way entireresearch work is done. Question 1Critically analyses the company performance using ratio analysis over the period 2013 - 2016.For each year calculate 6 ratios only, and show the trend for these ratios over the 5 yearsTable 1Ratio analysis of Trainline2013201420152016Gross profit67149710517998588740Net sales106005107437117633134564Gross profit ratio63%66%68%66%Net profit39870391823485432931Net sales106005107437117633134564Net profit ratio38%36%30%24%Current assets239882135048202375197560Current liability128722114602143067162990Current ratio1.8635661.1784091.4145471.212099Sales106005107437117633134564Average debtors168972.5140057.5107749137415.5Stock turnover ratio0.6273510.7670921.0917320.979249Net profit39870391823485432931Equity135585419677682156158Return on equity29%93%45%59%Interpretation Gross profit ratio: It is the ratio which is used to evaluate the firm profitability for thecertain duration. This method is used to evaluate the firm performance in terms of controlon direct expenses. These are those expenses that are related to the production process or
service delivery. Table given above is indicating that gross profit percentage is increasingfrom 63% to 66%. It is clear that there is almost little gap in the values of the ratios fromFY 2013 to 16. It must be noted that gross profit ratio remain stable in the range of 63%to 66%. However, in the current fiscal year some decline is observed in the gross profitratio. In the FY 2013 ratio was 63% which increased to 66% in the next year, valueplunged by 3% on year on year basis. Further, ratio value increased to 68% and growthrate in the gross profit ratio reduced to 2% from 3% on year on year basis. Finally, thisgrowth rate comes to end in the FY 2016 from 68% to 66%. However, such decline is notso huge and it can be said that firm maintain stability in its performance.Net profit ratio: Net profit ratio is another important method that is used often tonevaluate the firm performance (Kumbirai and Webb, (2010). Most of times managerscompute both gross and net profit ratio and by comparing both identify whether firmperformance was good or bad. Net profit ratio was 38% in the FY 2013 which reduced to36%, drop in value happened by -2% which is not big in number. One of the mostinteresting thing is that in further year’s net profit ratio value declined consistently. Thisis evident from the fact that net profit ratio value declined to 30% in the FY 2015 andfurther this rate reduced to 24%. So, overall scenario is that during the relevant timeperiod even in single year firm net profit ratio does not improved which is not good forthe business firm. Moreover, the rate of decline in the net profit ratio value increasedfrom -2% to -6%. This reflect that Trainline give very poor performance in its business.On comparison of the gross and net profit ratio value lots of things can be identified inrespect to company performance. Interesting fact is that gross profit ratio rose most ofyears apart from FY 2016. At same time net profit ratio value declined consistently. Thisrevealed that Trainline have control on its direct expenses but it does not have any sort ofcontrol over its indirect expenses. This is the reason due to which indirect expense areincreasing at sharp rate in the firm business instead of direct expenses. Current ratio: Current ratio is used by the managers to access the firm liquidity positionfor the specific duration (Cui and Ryan, 2011). This is the ratio which reflect theproportion of the current assets in the capital structure in comparison to current liabilityin the capital structure. The extent to which specific company can pay short term liabilityby using marketable security cash and receivables is measured by using mentioned ratio.
End of preview
Want to access all the pages? Upload your documents or become a member.
Related Documents
Finance and investment in SME Trainlinelg...
|15
|3988
|332
Finance in SME CONTEXT TABLE OF CONTENTS INTRODUCTION 3 Q1. Performance Analysis of Trainlinelg...
|14
|3975
|204
Trainline: An SME-driven Finance Platformlg...
|13
|4126
|69
Project Report on Finance in SMElg...
|17
|4223
|40
Financial Performance Analysis of GlaxoSmithKline, AstraZeneca and Shire PLClg...
|29
|6102
|177
Report On Ratio Analysis & Performance Analysislg...
|21
|5368
|111