Exploring Differences: Keynesian and Classical Macroeconomic Models
VerifiedAdded on 2023/05/05
|15
|2949
|53
Homework Assignment
AI Summary
This assignment provides a comparative analysis of Keynesian and Classical schools of thought in macroeconomics. It discusses the contributions of economists like John Maynard Keynes and Adam Smith, highlighting Keynes's interventionist approach versus the classical emphasis on self-regulating markets. The document explores the differences in their views on fiscal policy, wage rigidity, unemployment, and government borrowing. It also examines the limitations of using real GDP as a sole measure of economic well-being, considering factors like leisure time, nonmarket services, environmental quality, and income inequality. Furthermore, the assignment analyzes the Keynesian cross diagram, explaining equilibrium levels in relation to potential GDP, and delves into the importance and drawbacks of National Income Accounting and the two-sector model in determining national income equilibrium. Finally, it touches upon the IS-LM model, illustrating the effects of increased taxes in a closed economy.
Table of Contents
1.0 Introduction ……………………………………………………………………………….……….…..……… 3
2.0 Challenges that hinder “WeWork Inc” productivity and performance ………… .. 4
2.1 Challenges in respect of failing to safeguard the stakeholder’s interest ………. 4
2.2 Challenges of leadership ………………………………………………………………………………… 5
2.3 Challenges of resource management ……………………………………………………………. 7
2.4 Challenges in finance ……………………………………………………………………………………. 8
3.0 Improving WeWork resource management to enhance production
and performance ………………………………………………………………………………………………… 10
3.1 Sustainable Leadership …………………………………………………………………………………… 10
3.2 Resource Management Improvements …………………………………………………………… 11
3.3 Products & Process Improvements …………………………………………………………………. 12
3.4 Organizational culture rebuilding process ………………………………………………………. 14
4.0 Conclusion ……………………………………….…………………………………………………..……………… 16
5.0 Recommendation ………………………………..……………………………………………………………… 17
6.0 Reference ……….…………………….…………………………….…………………………………………..….. 18
PAGE \* MERGEFORMAT 14 | Page B B A 1 2 0 4 -
B u s i n e s s E c o n o m i c s
Paraphrase This Document
Need a fresh take? Get an instant paraphrase of this document with our AI Paraphraser
1.0 Name two economists and their contribution to the field of modern
macroeconomics
1.1 John Maynard Keynes & Adam Smith
John Maynard Keynes, a British economist, led a shift in economic theory that disproved the
then-dominant notion that full employment would be produced by free markets automatically,
i.e., that everyone would have a job as long as workers were flexible in their wage demands.
Prior to Keynes, the majority of European economies—and unquestionably the US—had relied
on Adam Smith's idea of free markets and the invisible hand. The expansion of capitalism was
generally beneficial to the nations that embraced it; as it should have, it created incentives for
creativity and a commitment to hard effort. However, it also brought about a boom-bust cycle,
which caused the economy to contract periodically and cost people their money and
employment. Keynes hypothesized that there might be a more effective strategy for
governments to influence the economy, one that would contribute to taming the bust-causing
economic cycle.
Keynes advocated for governments to actively participate in economic management. He
thought that governments may affect interest rates by participating in the bond market as both
buyers and sellers. Governments can encourage or dissuade people from saving money by
affecting interest rates. If the economy was having trouble, the government may purchase
bonds to lower interest rates. Because people could borrow money so cheaply and because
they wouldn't be able to generate much money on their savings, there would be more
spending, which would lead to economic development.
On the other hand, if inflation started to rise too quickly and the economy started to grow too
quickly, the government could sell bonds to remove money from circulation and raise interest
rates, which would encourage people to save money rather than spend it. Keynes firmly felt
that intervention might abolish, or at least substantially lessen, the severity and frequency of
economic busts, but his proposal needed ongoing monitoring and action by a centralized bank.
PAGE \* MERGEFORMAT 14 | Page B B A 1 2 0 4 -
B u s i n e s s E c o n o m i c s
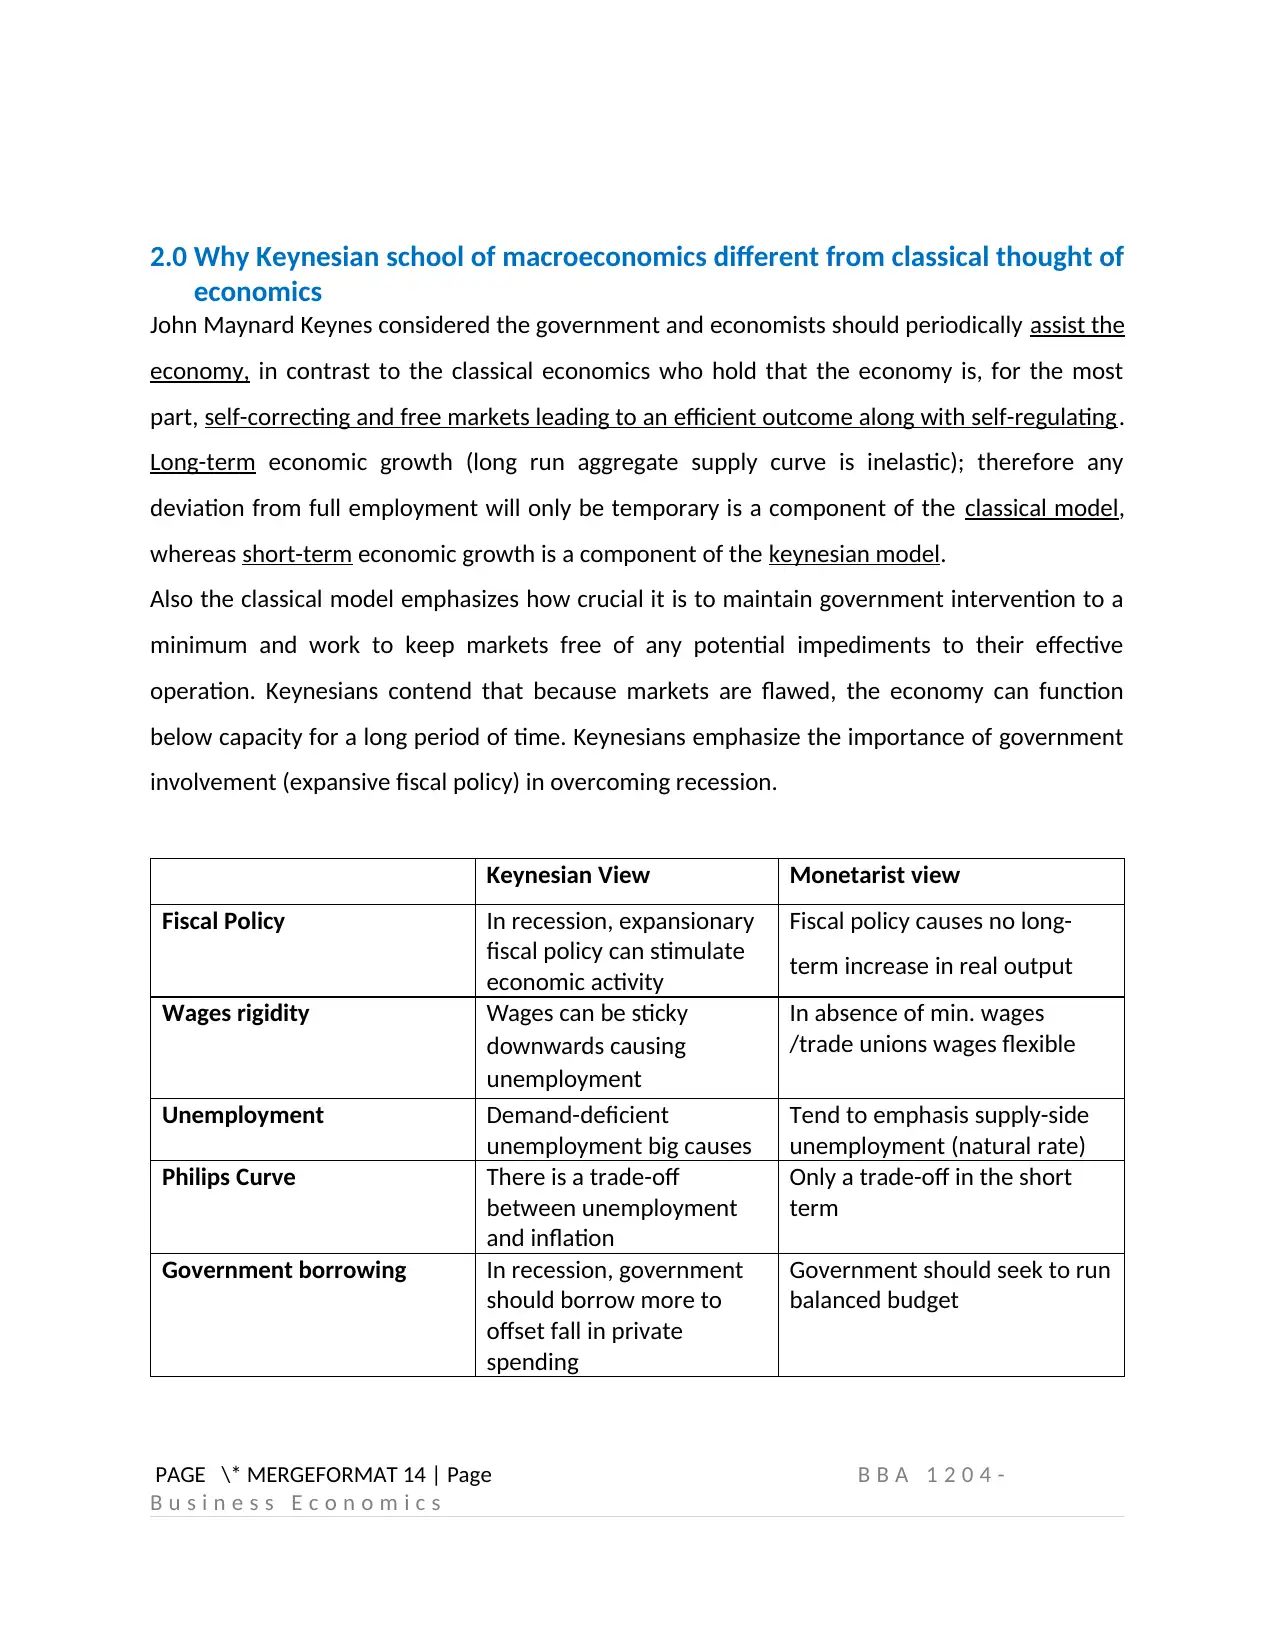
2.0 Why Keynesian school of macroeconomics different from classical thought of
economics
John Maynard Keynes considered the government and economists should periodically assist the
economy, in contrast to the classical economics who hold that the economy is, for the most
part, self-correcting and free markets leading to an efficient outcome along with self-regulating.
Long-term economic growth (long run aggregate supply curve is inelastic); therefore any
deviation from full employment will only be temporary is a component of the classical model,
whereas short-term economic growth is a component of the keynesian model.
Also the classical model emphasizes how crucial it is to maintain government intervention to a
minimum and work to keep markets free of any potential impediments to their effective
operation. Keynesians contend that because markets are flawed, the economy can function
below capacity for a long period of time. Keynesians emphasize the importance of government
involvement (expansive fiscal policy) in overcoming recession.
Keynesian View Monetarist view
Fiscal Policy In recession, expansionary
fiscal policy can stimulate
economic activity
Fiscal policy causes no long-
term increase in real output
Wages rigidity Wages can be sticky
downwards causing
unemployment
In absence of min. wages
/trade unions wages flexible
Unemployment Demand-deficient
unemployment big causes
Tend to emphasis supply-side
unemployment (natural rate)
Philips Curve There is a trade-off
between unemployment
and inflation
Only a trade-off in the short
term
Government borrowing In recession, government
should borrow more to
offset fall in private
spending
Government should seek to run
balanced budget
PAGE \* MERGEFORMAT 14 | Page B B A 1 2 0 4 -
B u s i n e s s E c o n o m i c s
⊘ This is a preview!⊘
Do you want full access?
Subscribe today to unlock all pages.
Trusted by 1+ million students worldwide
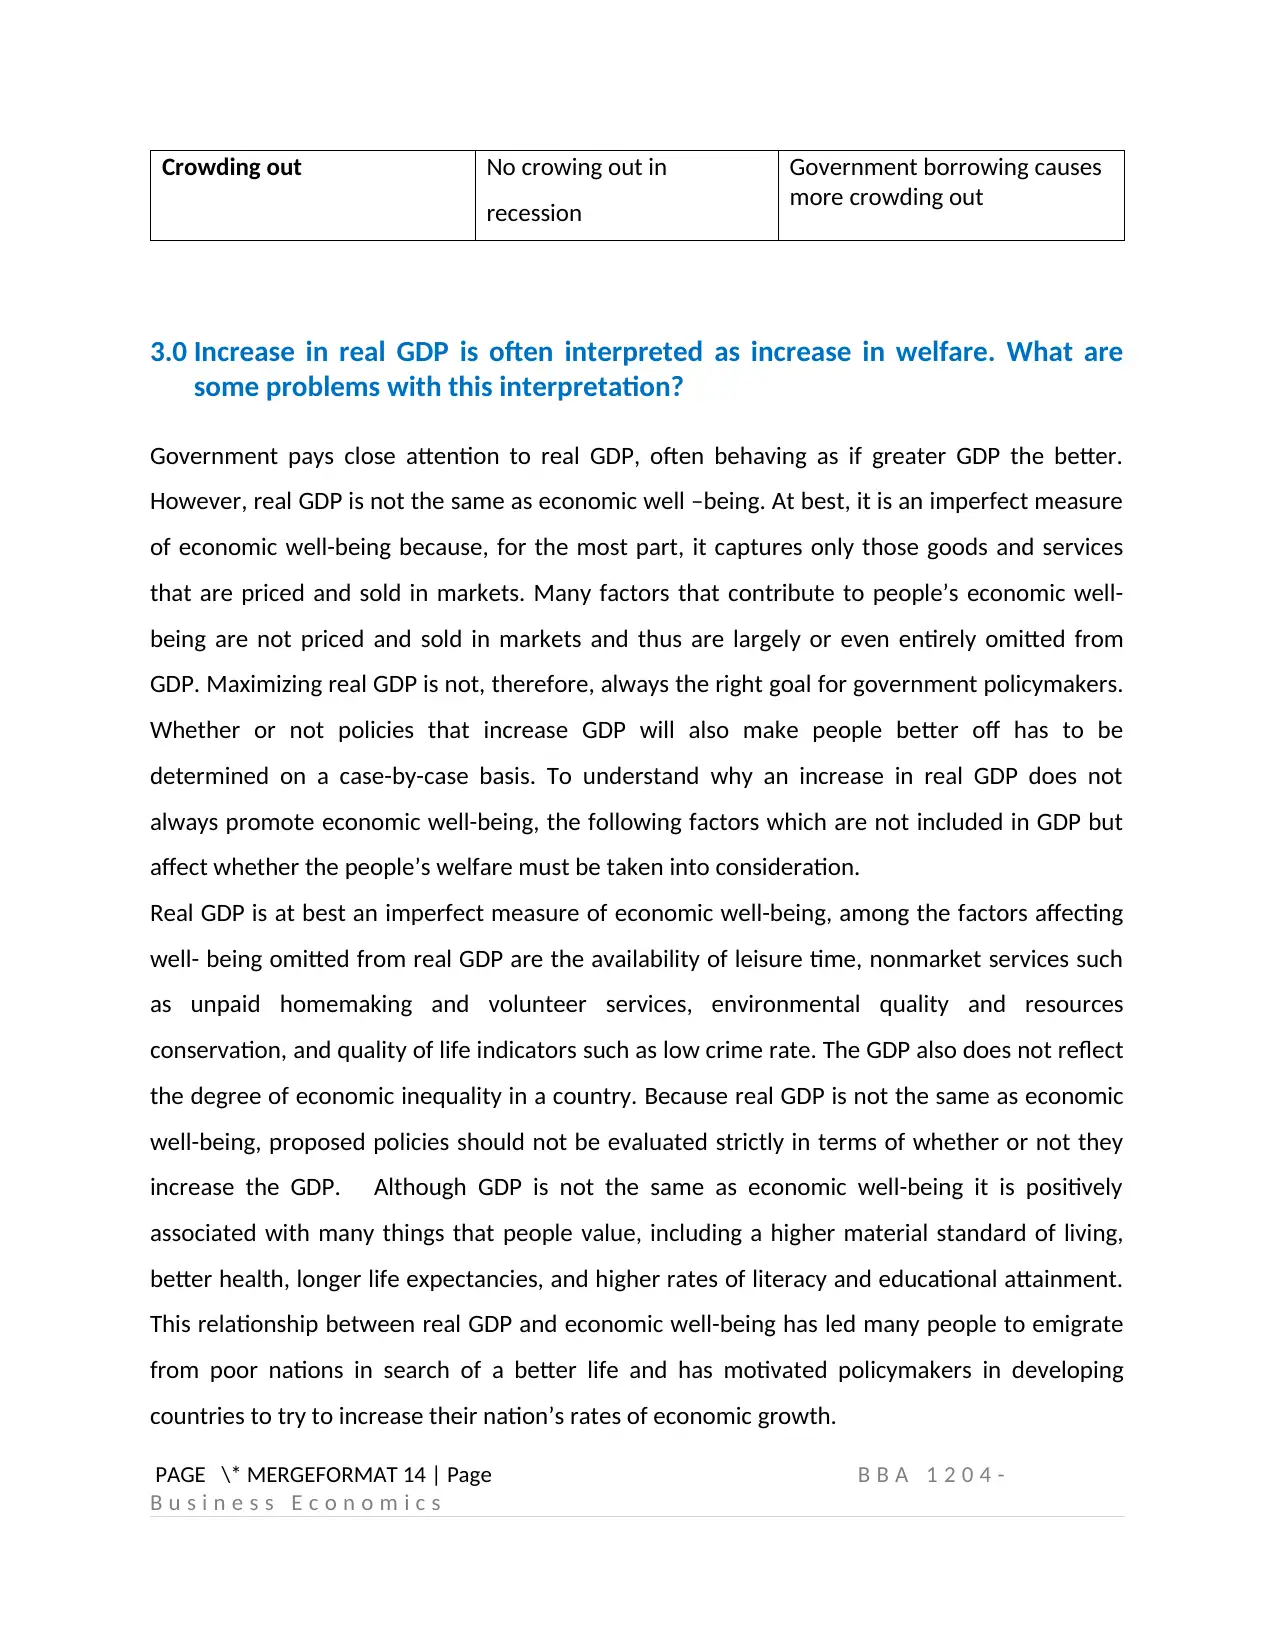
Crowding out No crowing out in
recession
Government borrowing causes
more crowding out
3.0 Increase in real GDP is often interpreted as increase in welfare. What are
some problems with this interpretation?
Government pays close attention to real GDP, often behaving as if greater GDP the better.
However, real GDP is not the same as economic well –being. At best, it is an imperfect measure
of economic well-being because, for the most part, it captures only those goods and services
that are priced and sold in markets. Many factors that contribute to people’s economic well-
being are not priced and sold in markets and thus are largely or even entirely omitted from
GDP. Maximizing real GDP is not, therefore, always the right goal for government policymakers.
Whether or not policies that increase GDP will also make people better off has to be
determined on a case-by-case basis. To understand why an increase in real GDP does not
always promote economic well-being, the following factors which are not included in GDP but
affect whether the people’s welfare must be taken into consideration.
Real GDP is at best an imperfect measure of economic well-being, among the factors affecting
well- being omitted from real GDP are the availability of leisure time, nonmarket services such
as unpaid homemaking and volunteer services, environmental quality and resources
conservation, and quality of life indicators such as low crime rate. The GDP also does not reflect
the degree of economic inequality in a country. Because real GDP is not the same as economic
well-being, proposed policies should not be evaluated strictly in terms of whether or not they
increase the GDP. Although GDP is not the same as economic well-being it is positively
associated with many things that people value, including a higher material standard of living,
better health, longer life expectancies, and higher rates of literacy and educational attainment.
This relationship between real GDP and economic well-being has led many people to emigrate
from poor nations in search of a better life and has motivated policymakers in developing
countries to try to increase their nation’s rates of economic growth.
PAGE \* MERGEFORMAT 14 | Page B B A 1 2 0 4 -
B u s i n e s s E c o n o m i c s
Paraphrase This Document
Need a fresh take? Get an instant paraphrase of this document with our AI Paraphraser
4.0 Is the equilibrium in a Keynesian cross diagram usually expected to be at or
near potential GDP? Use appropriate figures for the discussion.
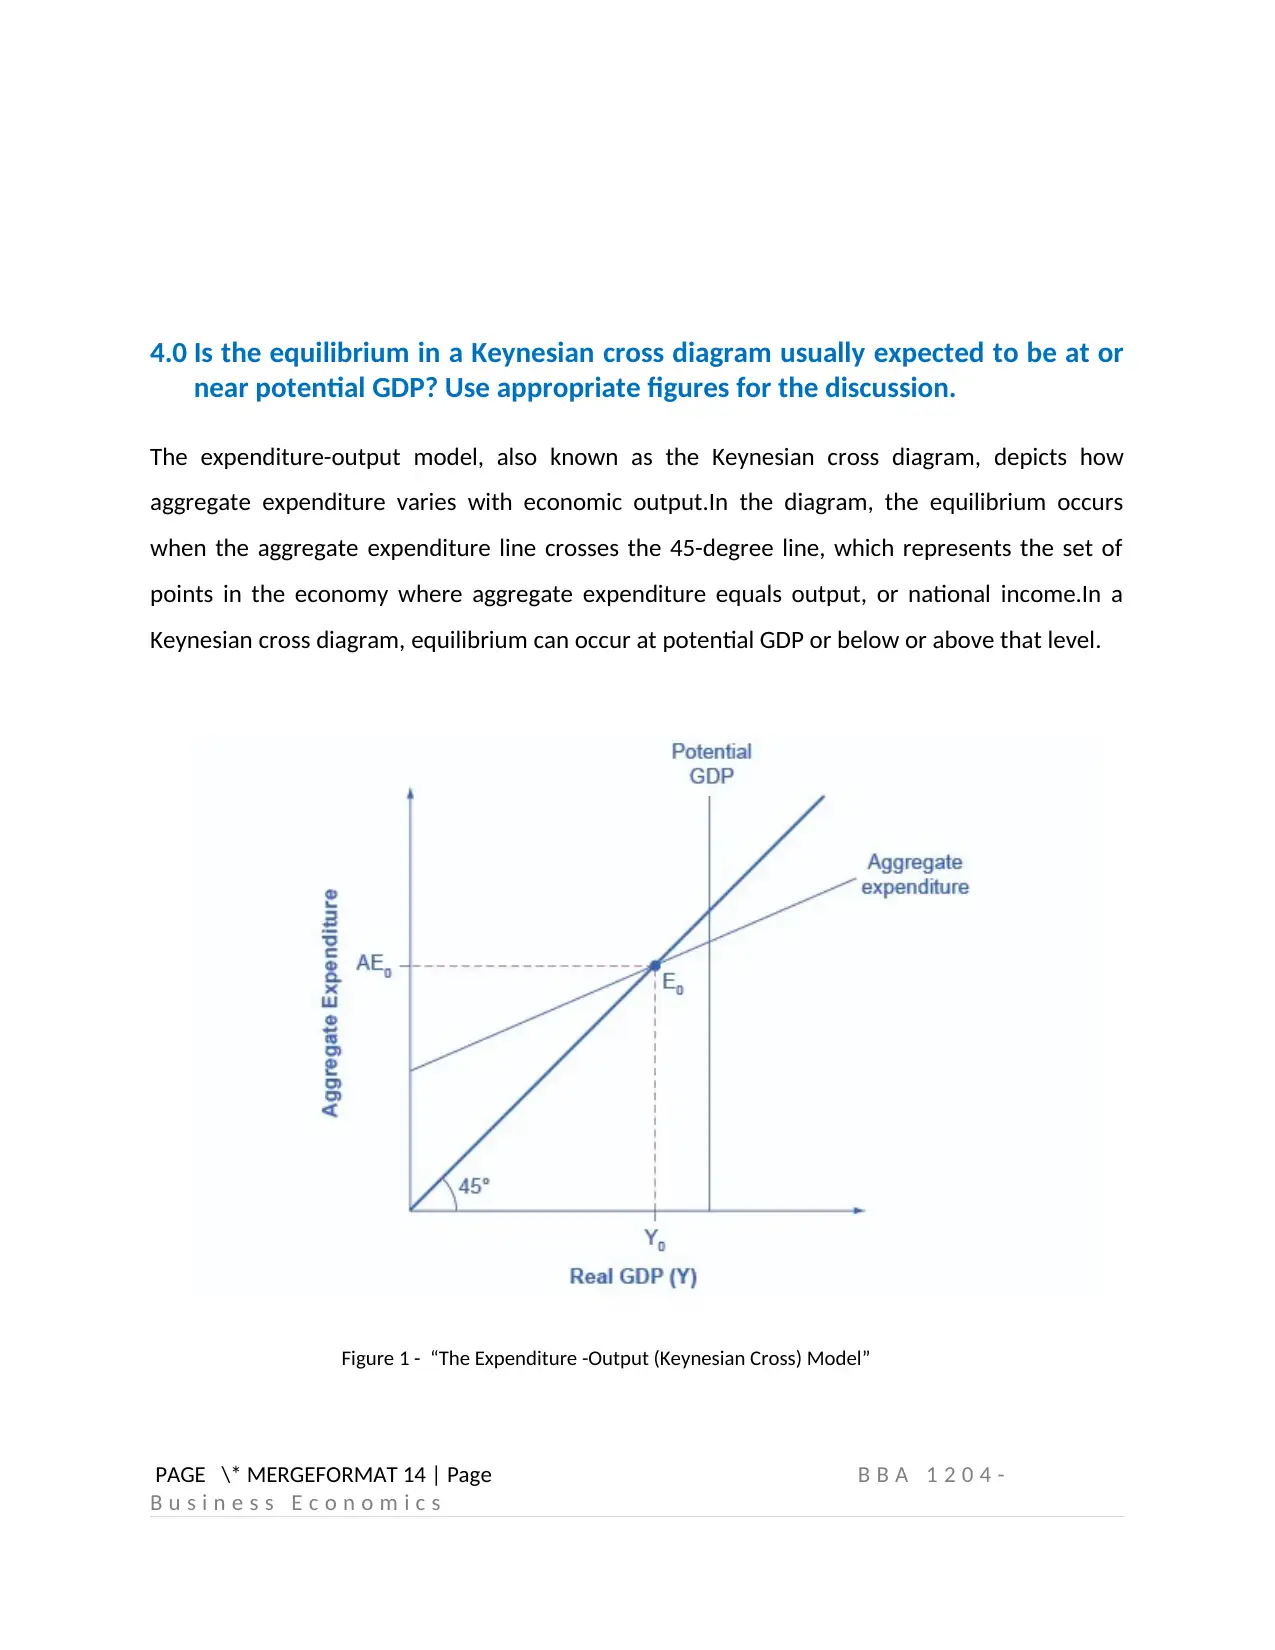
The expenditure-output model, also known as the Keynesian cross diagram, depicts how
aggregate expenditure varies with economic output.In the diagram, the equilibrium occurs
when the aggregate expenditure line crosses the 45-degree line, which represents the set of
points in the economy where aggregate expenditure equals output, or national income.In a
Keynesian cross diagram, equilibrium can occur at potential GDP or below or above that level.
Figure 1 - “The Expenditure -Output (Keynesian Cross) Model”
PAGE \* MERGEFORMAT 14 | Page B B A 1 2 0 4 -
B u s i n e s s E c o n o m i c s
near potential GDP? Use appropriate figures for the discussion.
The expenditure-output model, also known as the Keynesian cross diagram, depicts how
aggregate expenditure varies with economic output.In the diagram, the equilibrium occurs
when the aggregate expenditure line crosses the 45-degree line, which represents the set of
points in the economy where aggregate expenditure equals output, or national income.In a
Keynesian cross diagram, equilibrium can occur at potential GDP or below or above that level.
Figure 1 - “The Expenditure -Output (Keynesian Cross) Model”
PAGE \* MERGEFORMAT 14 | Page B B A 1 2 0 4 -
B u s i n e s s E c o n o m i c s
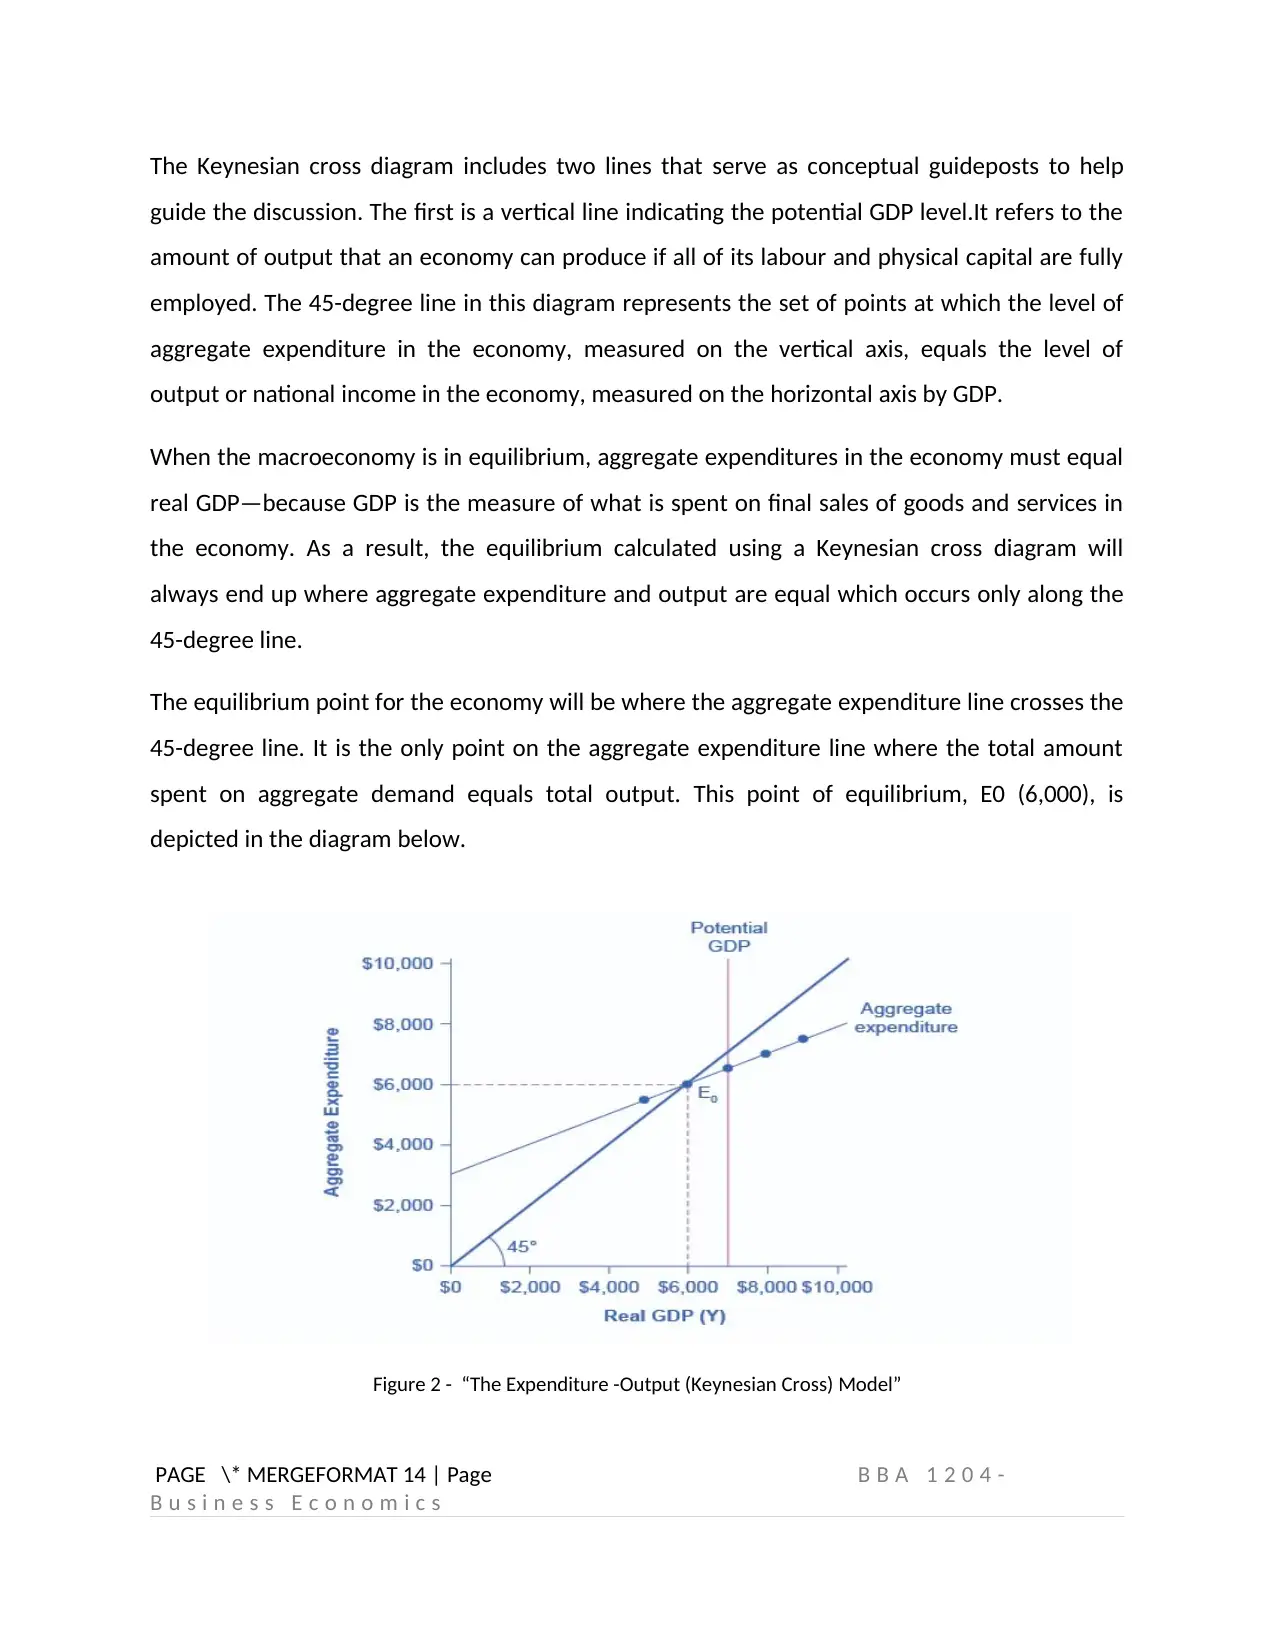
The Keynesian cross diagram includes two lines that serve as conceptual guideposts to help
guide the discussion. The first is a vertical line indicating the potential GDP level.It refers to the
amount of output that an economy can produce if all of its labour and physical capital are fully
employed. The 45-degree line in this diagram represents the set of points at which the level of
aggregate expenditure in the economy, measured on the vertical axis, equals the level of
output or national income in the economy, measured on the horizontal axis by GDP.
When the macroeconomy is in equilibrium, aggregate expenditures in the economy must equal
real GDP—because GDP is the measure of what is spent on final sales of goods and services in
the economy. As a result, the equilibrium calculated using a Keynesian cross diagram will
always end up where aggregate expenditure and output are equal which occurs only along the
45-degree line.
The equilibrium point for the economy will be where the aggregate expenditure line crosses the
45-degree line. It is the only point on the aggregate expenditure line where the total amount
spent on aggregate demand equals total output. This point of equilibrium, E0 (6,000), is
depicted in the diagram below.
Figure 2 - “The Expenditure -Output (Keynesian Cross) Model”
PAGE \* MERGEFORMAT 14 | Page B B A 1 2 0 4 -
B u s i n e s s E c o n o m i c s
⊘ This is a preview!⊘
Do you want full access?
Subscribe today to unlock all pages.
Trusted by 1+ million students worldwide
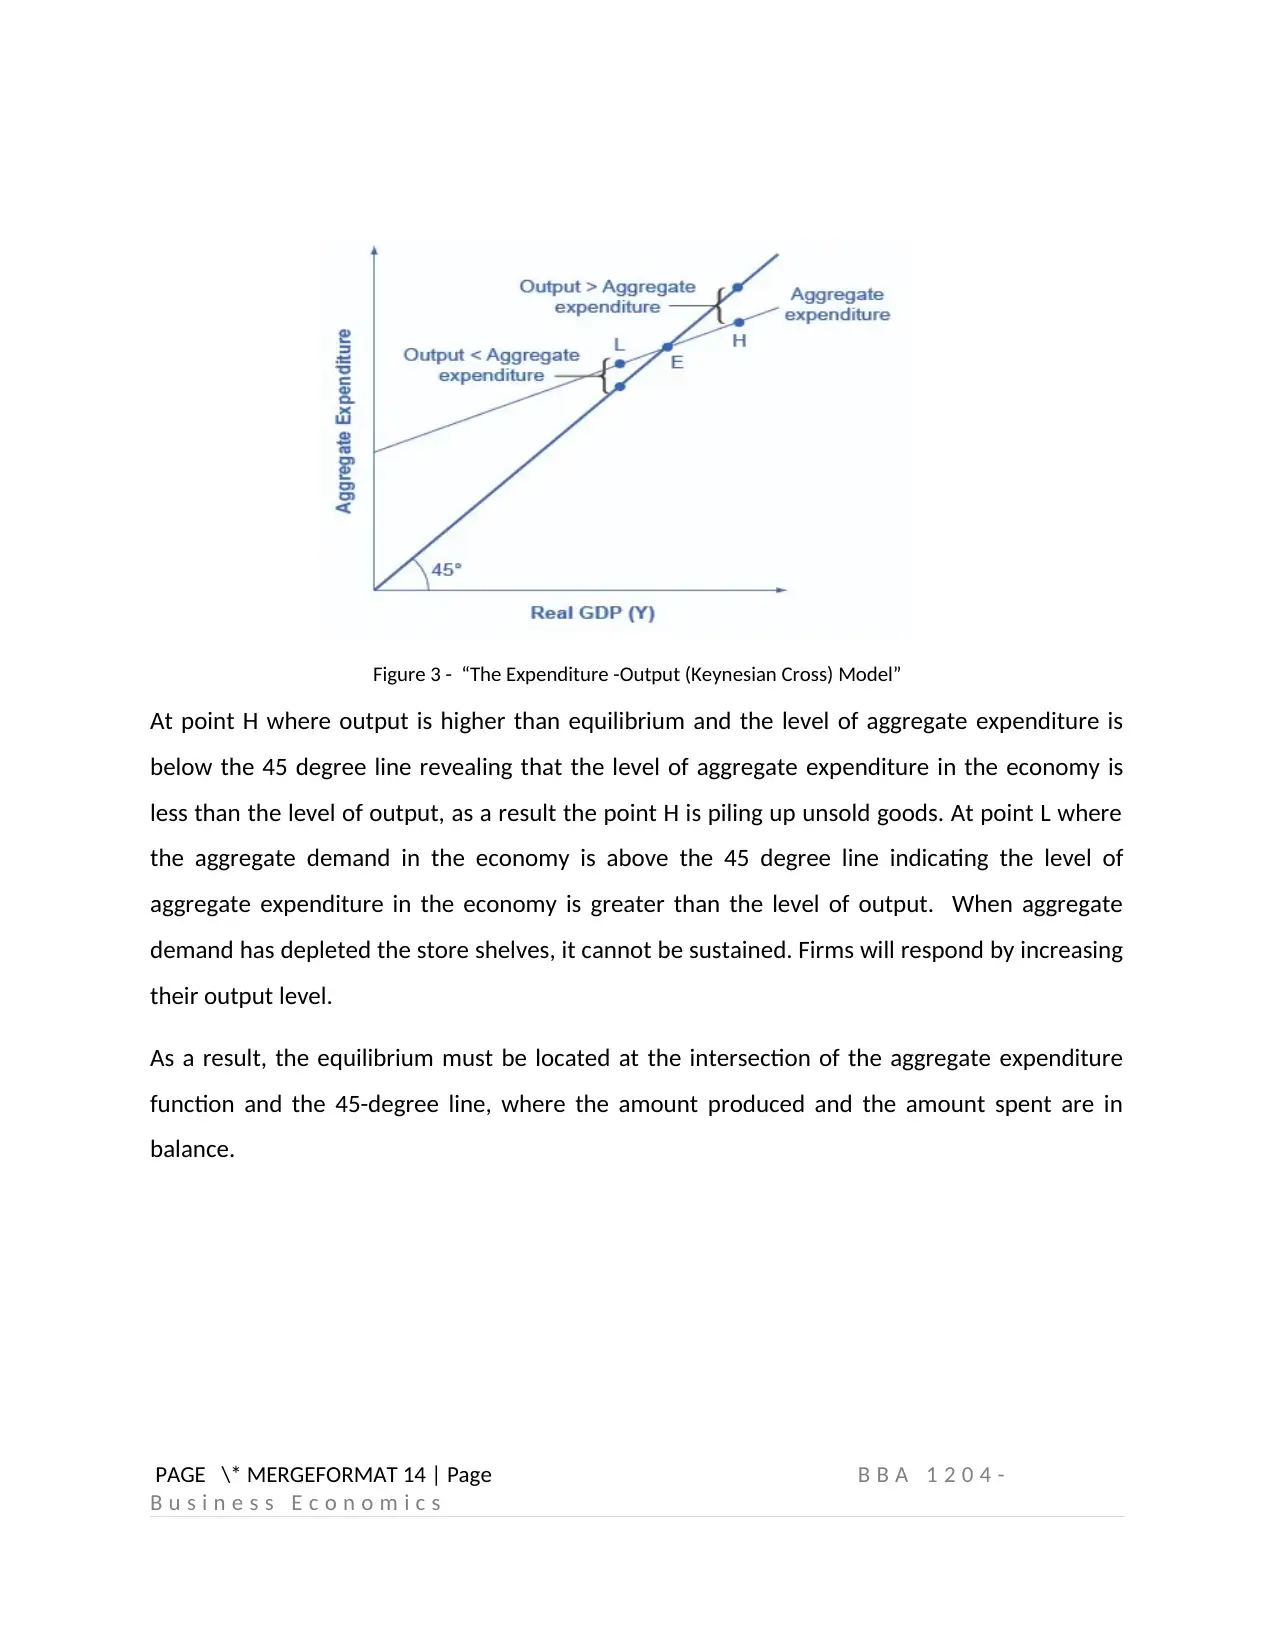
Figure 3 - “The Expenditure -Output (Keynesian Cross) Model”
At point H where output is higher than equilibrium and the level of aggregate expenditure is
below the 45 degree line revealing that the level of aggregate expenditure in the economy is
less than the level of output, as a result the point H is piling up unsold goods. At point L where
the aggregate demand in the economy is above the 45 degree line indicating the level of
aggregate expenditure in the economy is greater than the level of output. When aggregate
demand has depleted the store shelves, it cannot be sustained. Firms will respond by increasing
their output level.
As a result, the equilibrium must be located at the intersection of the aggregate expenditure
function and the 45-degree line, where the amount produced and the amount spent are in
balance.
PAGE \* MERGEFORMAT 14 | Page B B A 1 2 0 4 -
B u s i n e s s E c o n o m i c s
Paraphrase This Document
Need a fresh take? Get an instant paraphrase of this document with our AI Paraphraser
5.0 What is the importance of National Income Accounting (NIA)?
In economics, National Income Accounting is the financial accounting used to track economic
activity and forecast growth in the overall economy.
National income accounting methods can help track an economy's progress and the flow of
money within a country. The following well-known international organizations use national
income accounting data to make economic policies that affect billions of people and the US
Department of Commerce, World Bank, and the IMF and the OECD. Accounting for National
Income can be used to determine other economic activities such as Gross Domestic Product,
Gross National Product, and National Income.
The most common application of national income accounting is calculating the number of
goods and services purchased and sold in a country. Most national income accounting methods
only account for goods and services produced and sold within a country's borders in a given
year. National income accounting involves a large amount of data, which takes time to collect
and then calculate. There are numerous sectors and industries from which national income
accounting methods collect data, and each industry or even individual business may have
different reporting practices.
PAGE \* MERGEFORMAT 14 | Page B B A 1 2 0 4 -
B u s i n e s s E c o n o m i c s
6.0 What are the drawbacks as you observed from the two-sector model in
determining the equilibrium level of national income?
Aggregate spending or aggregate demand in a two-sector closed economy has two parts:
Demand for products for consumption comes first, followed by investment need, which is a
demand for capital goods. Therefore, when we talk about aggregate expenditure, we mean the
total amount that families and business owners are ready to spend on consumption and
investment.
Although such an economy does not actually exist, it offers a straightforward and practical
foundation for understanding the Keynesian theory of income determination. The simple two
sector economy model makes the assumption that there are only two economic sectors,
namely, households and businesses, with just expenditures for consumption and investment.
All factors of production are owned by households, who sell their factor services to generate
factor incomes that are used exclusively to purchase all finished commodities and services
created by commercial enterprises. The assumption is that the business enterprises recruit
labour from the homes; they manufacture and sell goods and services to the households and do
not keep any money. Retained earnings, corporations, or corporate savings don't exist.
The supply of capital, all prices (including factor prices), and technological advancements
remain constant. There are no taxes, government spending, or transfer payments because
there is no government sector. Since there is no foreign trade and no exports, imports, or
external inflows and outflows, the economy is closed. All investment expenditures are
autonomous (not based on income or interest rates), all investment is net, and as a result,
national income equals net national product.
Aggregate Demand / Aggregate Expenditure = Consumer Goods (C ) + Investment Goods (I)
PAGE \* MERGEFORMAT 14 | Page B B A 1 2 0 4 -
B u s i n e s s E c o n o m i c s
⊘ This is a preview!⊘
Do you want full access?
Subscribe today to unlock all pages.
Trusted by 1+ million students worldwide
7.0 IS –LM Models in a closed economy
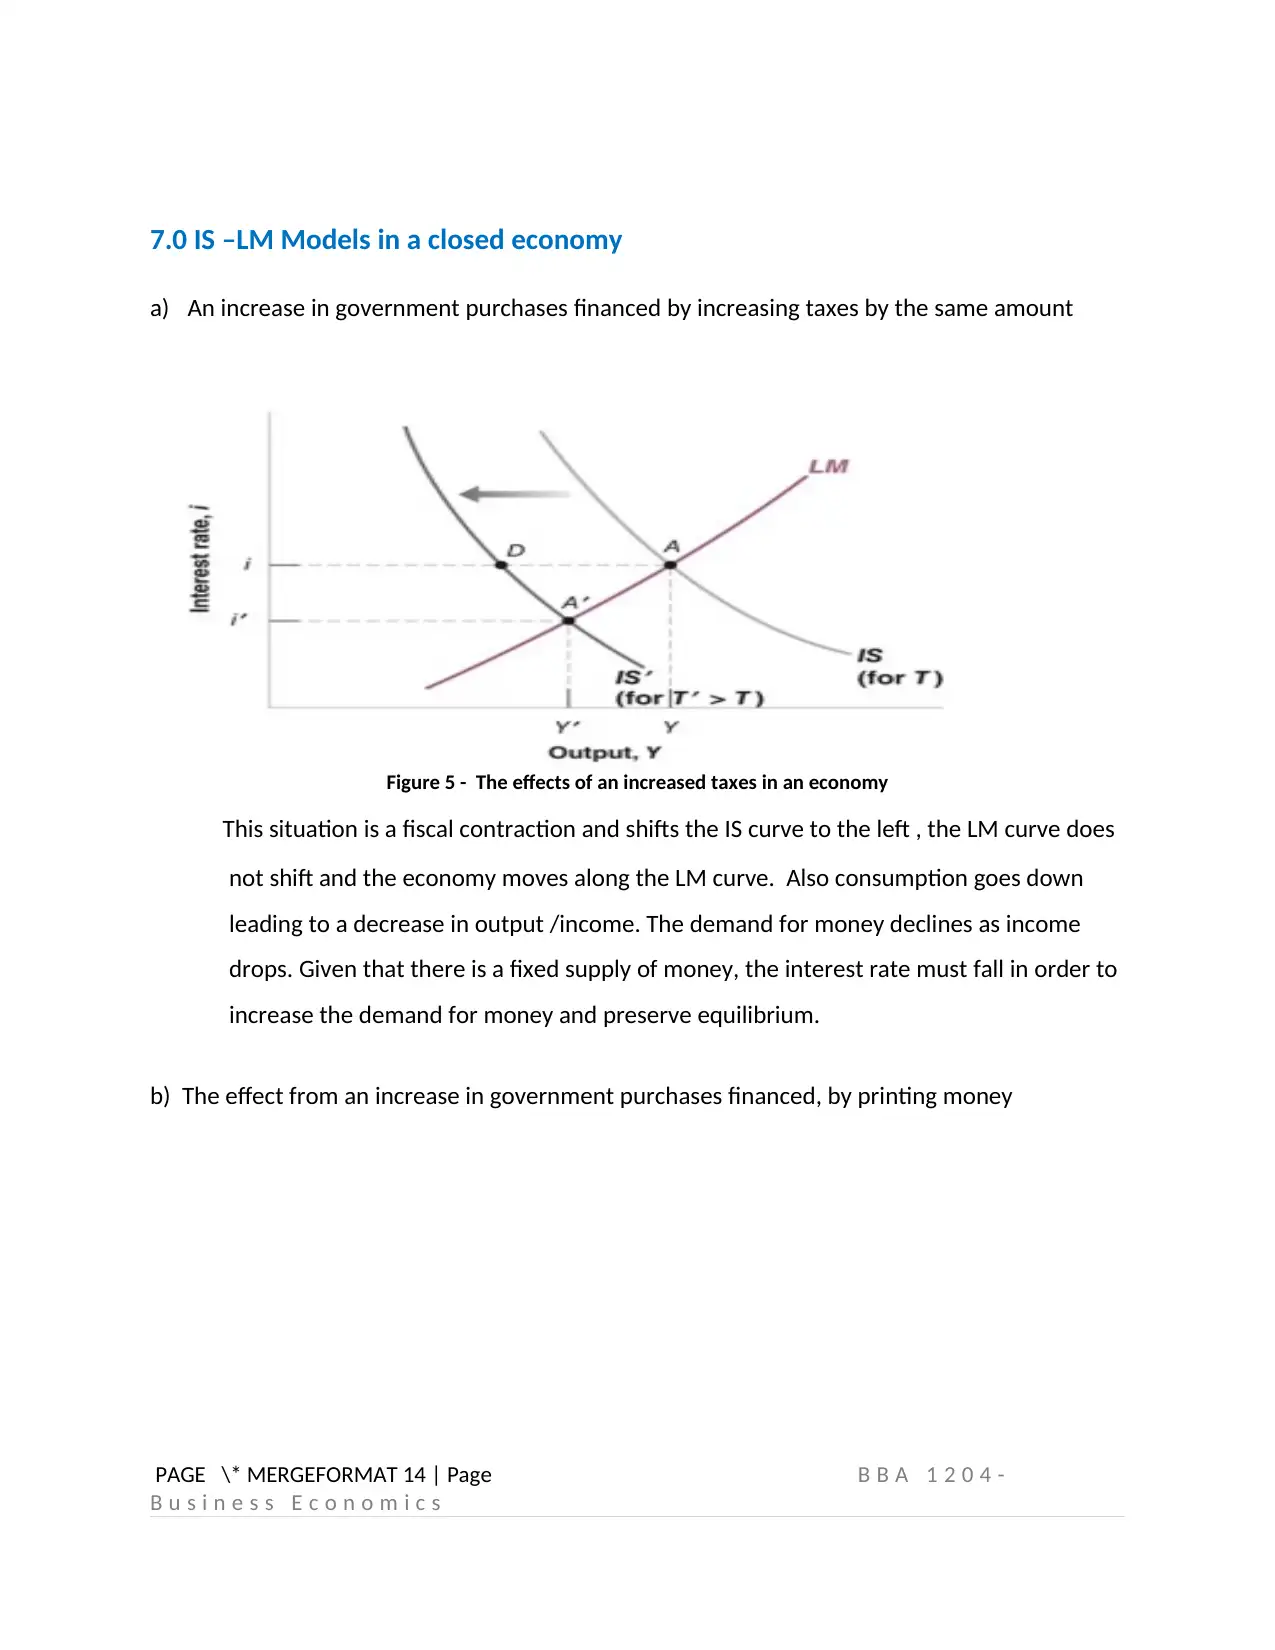
a) An increase in government purchases financed by increasing taxes by the same amount
Figure 5 - The effects of an increased taxes in an economy
This situation is a fiscal contraction and shifts the IS curve to the left , the LM curve does
not shift and the economy moves along the LM curve. Also consumption goes down
leading to a decrease in output /income. The demand for money declines as income
drops. Given that there is a fixed supply of money, the interest rate must fall in order to
increase the demand for money and preserve equilibrium.
b) The effect from an increase in government purchases financed, by printing money
PAGE \* MERGEFORMAT 14 | Page B B A 1 2 0 4 -
B u s i n e s s E c o n o m i c s
Paraphrase This Document
Need a fresh take? Get an instant paraphrase of this document with our AI Paraphraser
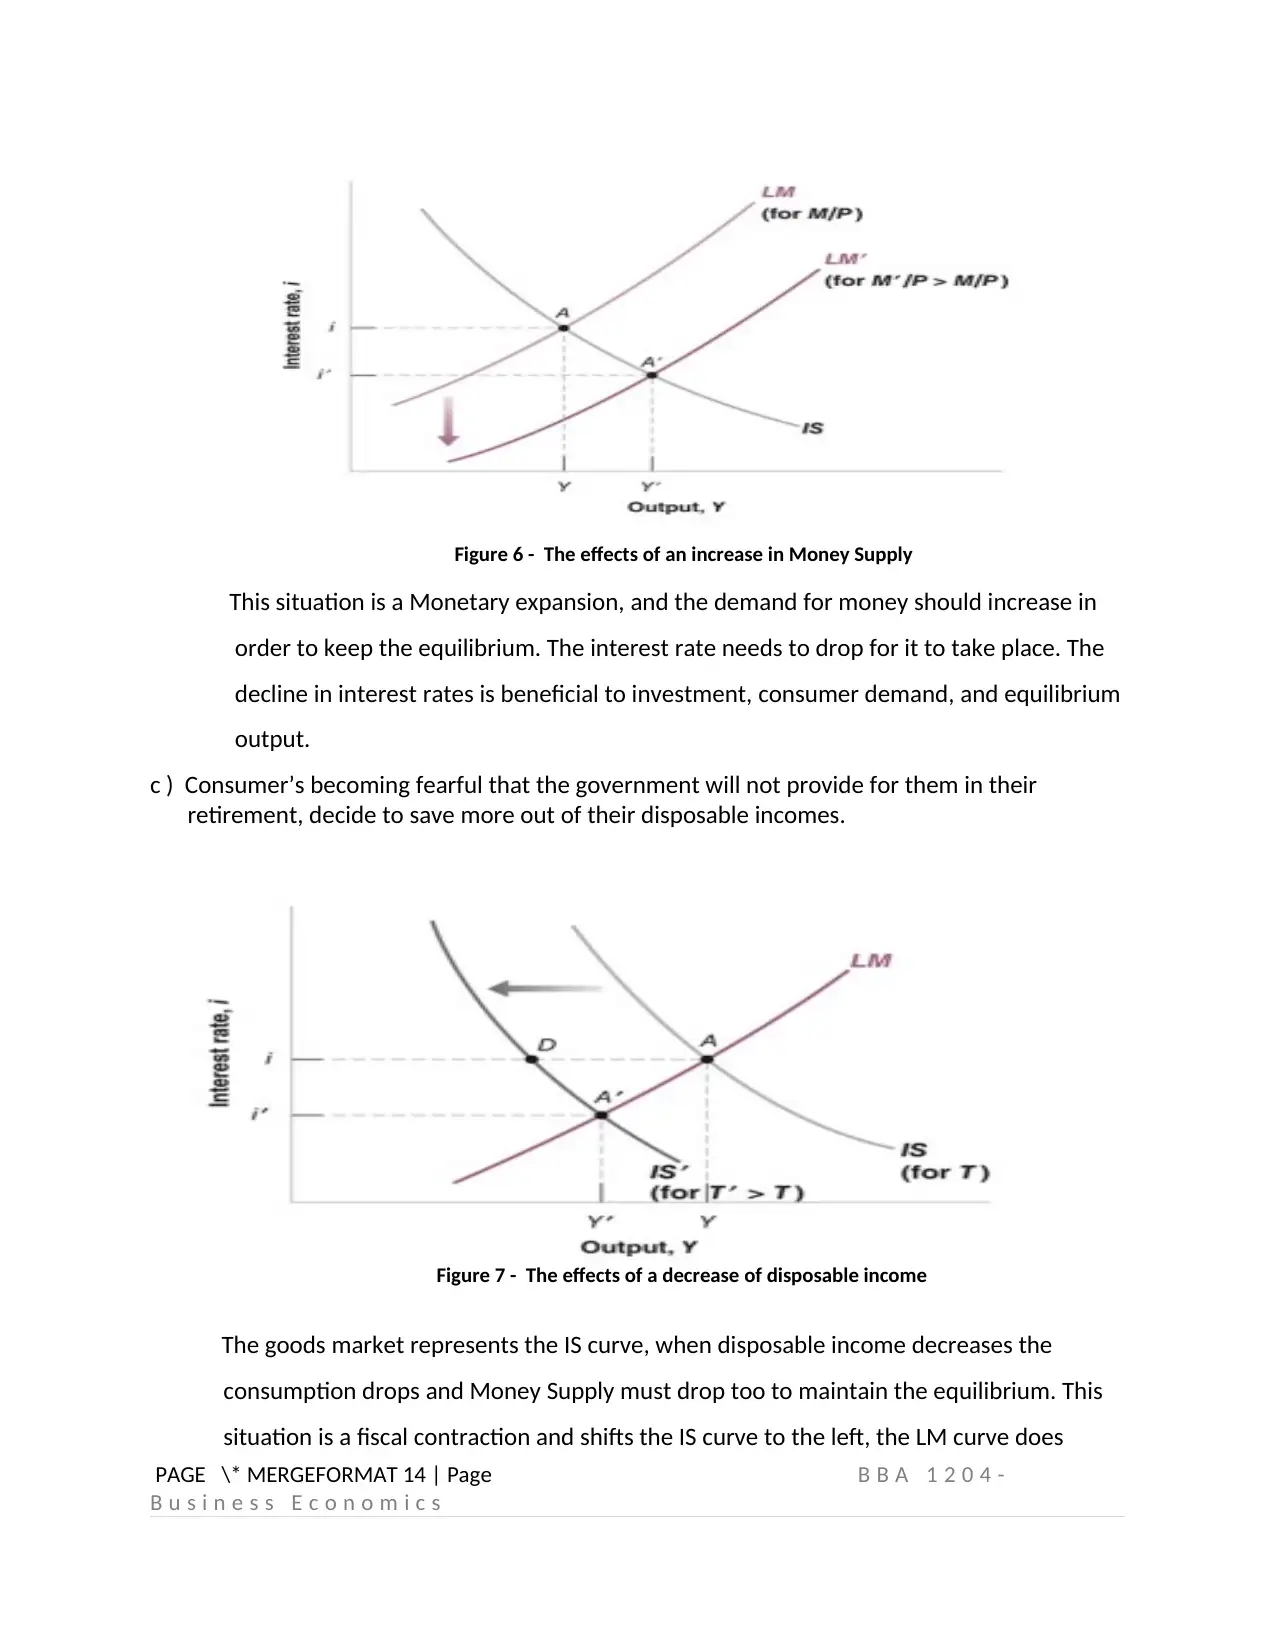
Figure 6 - The effects of an increase in Money Supply
This situation is a Monetary expansion, and the demand for money should increase in
order to keep the equilibrium. The interest rate needs to drop for it to take place. The
decline in interest rates is beneficial to investment, consumer demand, and equilibrium
output.
c ) Consumer’s becoming fearful that the government will not provide for them in their
retirement, decide to save more out of their disposable incomes.
Figure 7 - The effects of a decrease of disposable income
The goods market represents the IS curve, when disposable income decreases the
consumption drops and Money Supply must drop too to maintain the equilibrium. This
situation is a fiscal contraction and shifts the IS curve to the left, the LM curve does
PAGE \* MERGEFORMAT 14 | Page B B A 1 2 0 4 -
B u s i n e s s E c o n o m i c s
not shift and the economy moves along the LM curve
8.0 In a closed economy describe the following;
(a) Equation that describes the IS curve
A closed economy seeks complete self-sufficiency, supplying domestic consumers with
everything they require from within the country's borders. Closed economies are more of a
theoretical concept than a reality in today's interconnected world, though some economies are
more closed than others.
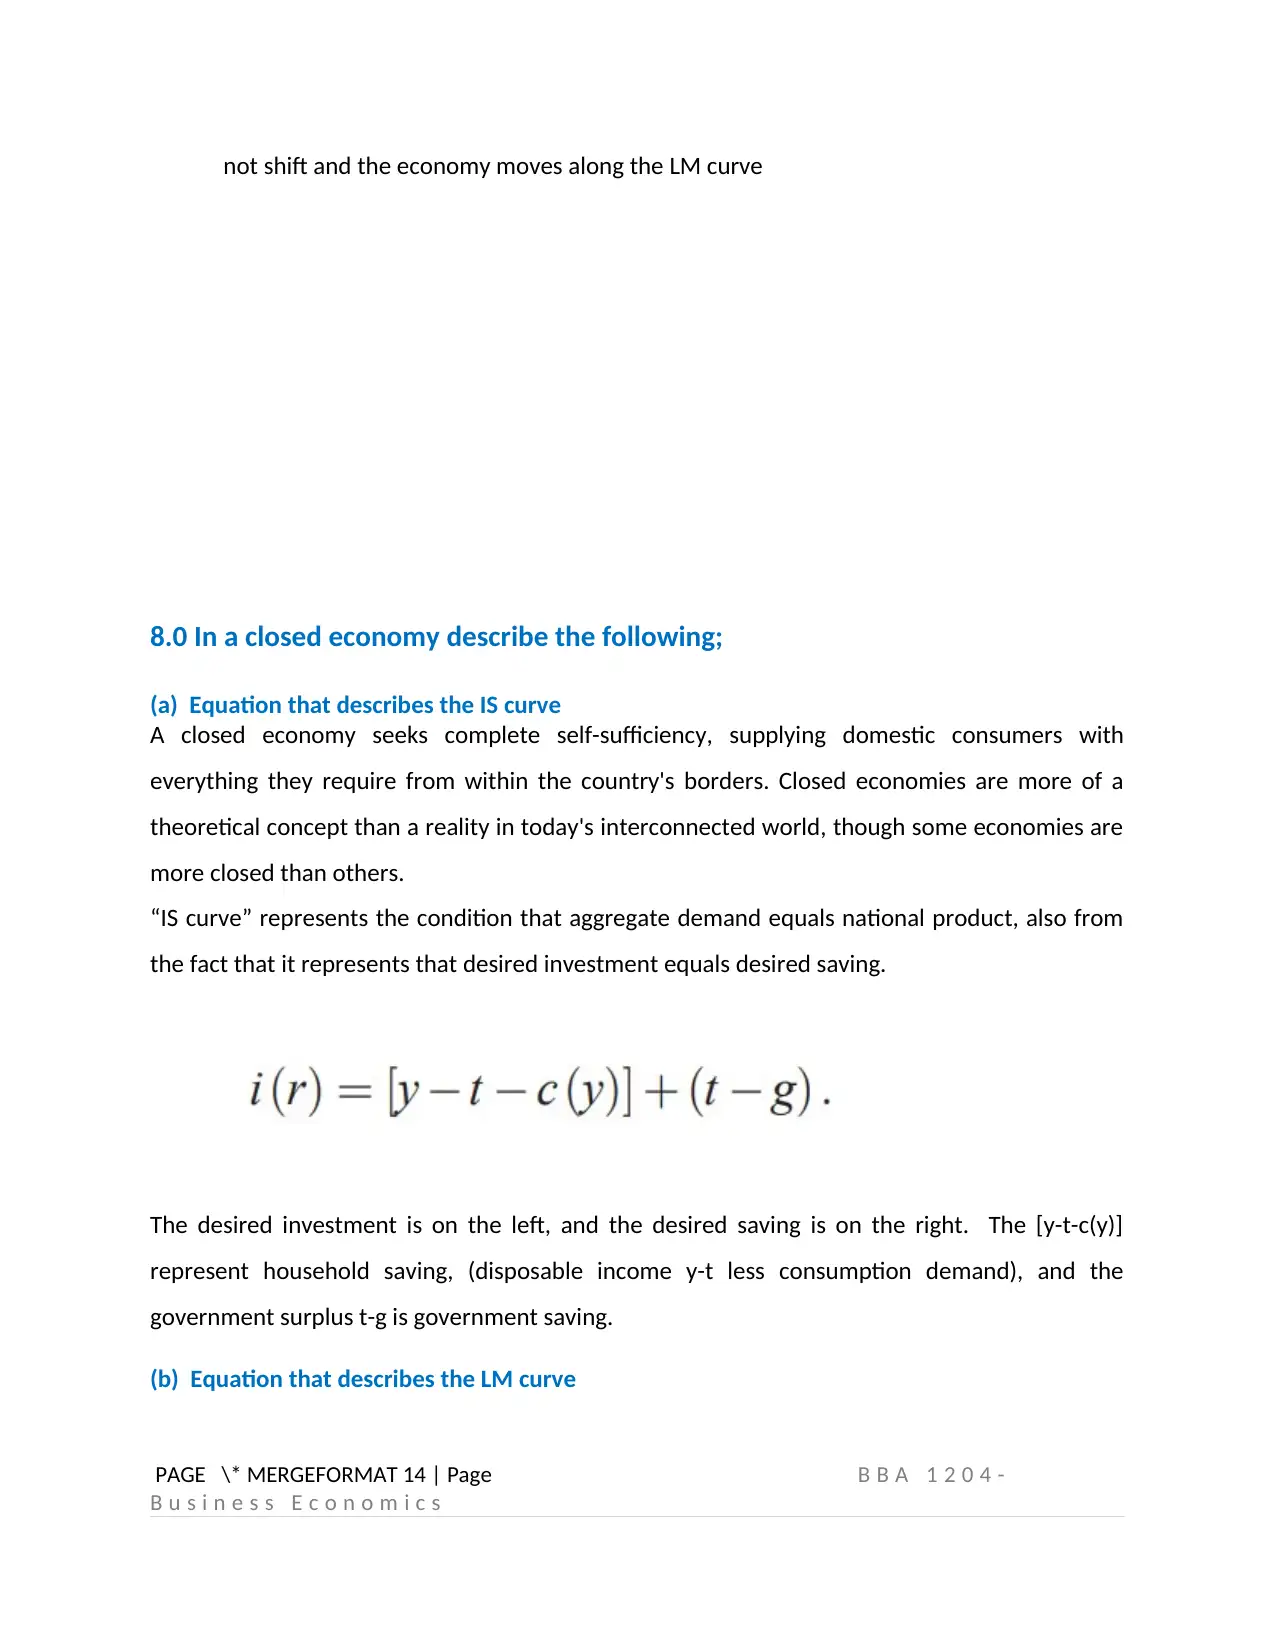
“IS curve” represents the condition that aggregate demand equals national product, also from
the fact that it represents that desired investment equals desired saving.
The desired investment is on the left, and the desired saving is on the right. The [y-t-c(y)]
represent household saving, (disposable income y-t less consumption demand), and the
government surplus t-g is government saving.
(b) Equation that describes the LM curve
PAGE \* MERGEFORMAT 14 | Page B B A 1 2 0 4 -
B u s i n e s s E c o n o m i c s
8.0 In a closed economy describe the following;
(a) Equation that describes the IS curve
A closed economy seeks complete self-sufficiency, supplying domestic consumers with
everything they require from within the country's borders. Closed economies are more of a
theoretical concept than a reality in today's interconnected world, though some economies are
more closed than others.
“IS curve” represents the condition that aggregate demand equals national product, also from
the fact that it represents that desired investment equals desired saving.
The desired investment is on the left, and the desired saving is on the right. The [y-t-c(y)]
represent household saving, (disposable income y-t less consumption demand), and the
government surplus t-g is government saving.
(b) Equation that describes the LM curve
PAGE \* MERGEFORMAT 14 | Page B B A 1 2 0 4 -
B u s i n e s s E c o n o m i c s
⊘ This is a preview!⊘
Do you want full access?
Subscribe today to unlock all pages.
Trusted by 1+ million students worldwide
1 out of 15
Related Documents


Your All-in-One AI-Powered Toolkit for Academic Success.
+13062052269
info@desklib.com
Available 24*7 on WhatsApp / Email
![[object Object]](/_next/static/media/star-bottom.7253800d.svg)
Unlock your academic potential
Copyright © 2020–2026 A2Z Services. All Rights Reserved. Developed and managed by ZUCOL.