Statistical Report: Analyzing Pretest and Posttest Data Results
VerifiedAdded on 2021/01/14
|10
|834
|27
Report
AI Summary
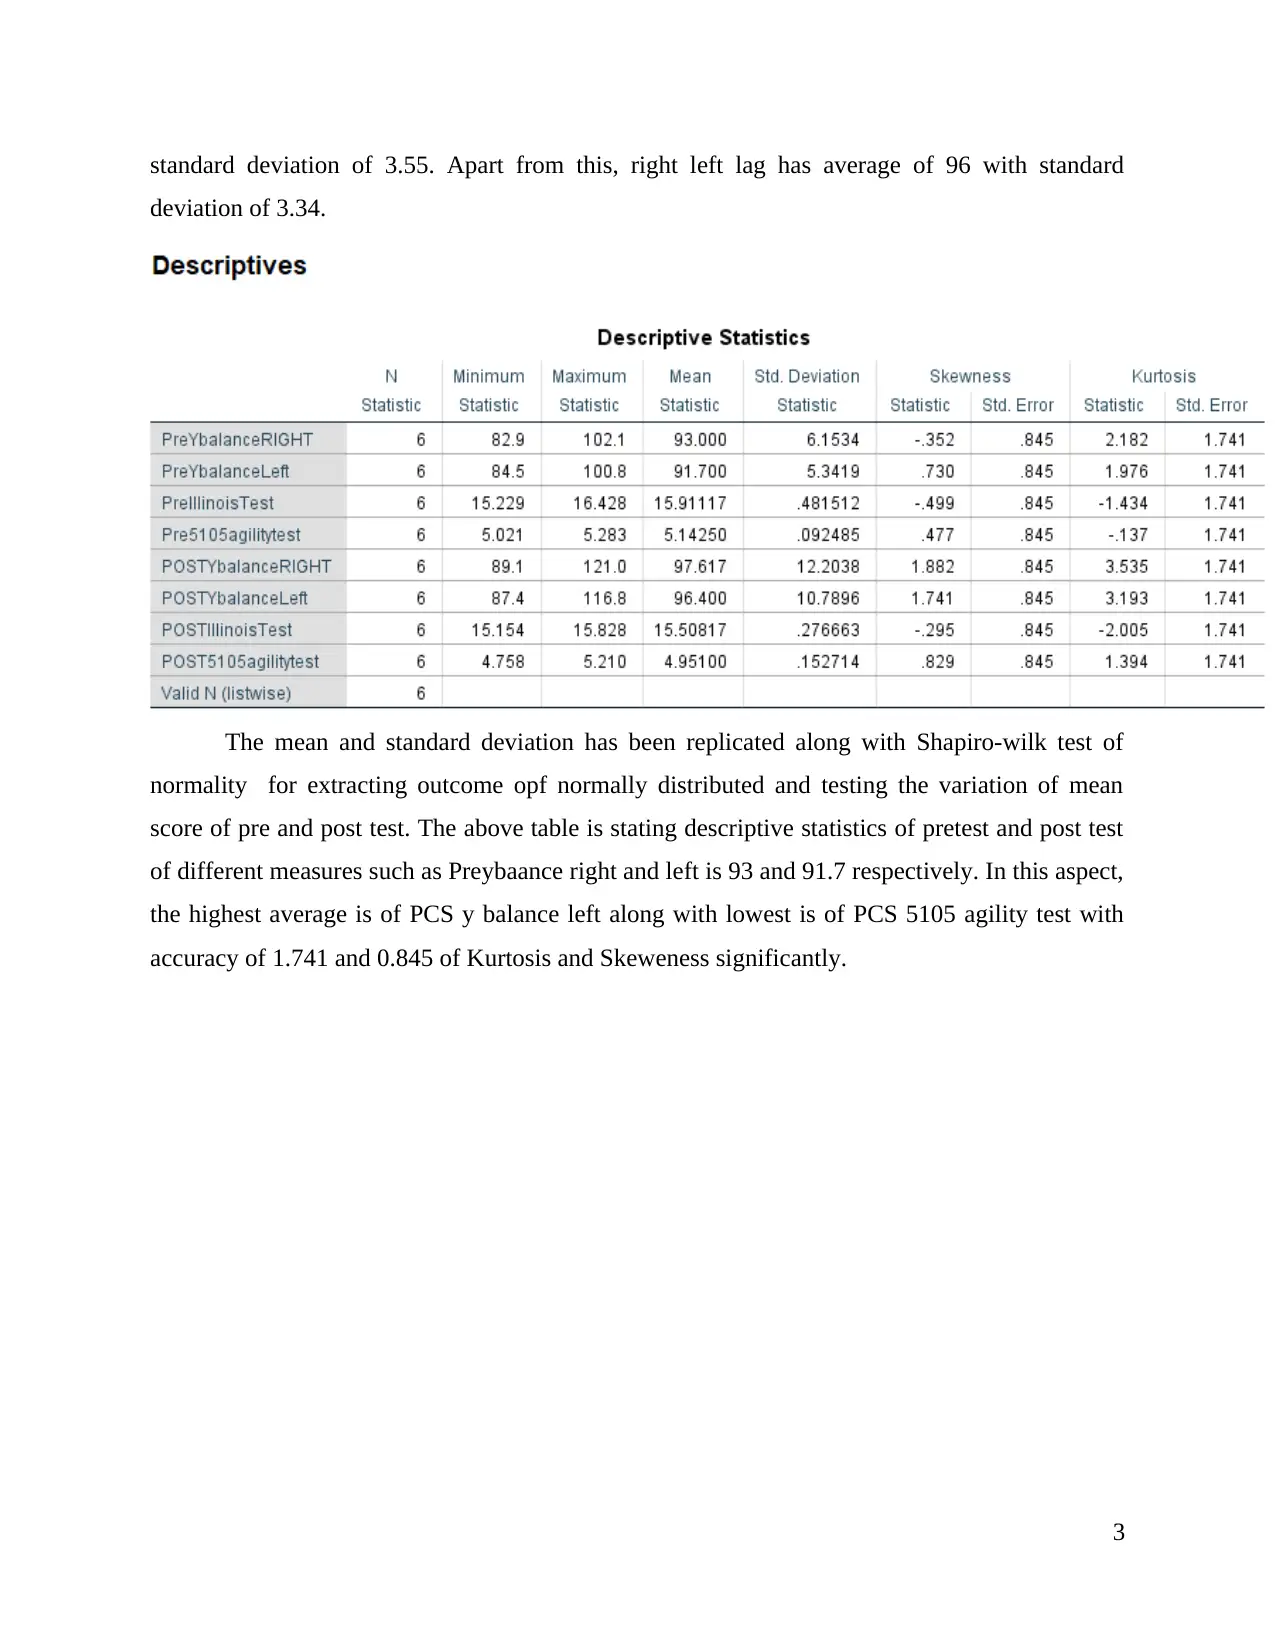
This report presents a statistical analysis of pretest and posttest data, employing various statistical techniques to compare and interpret the results. The analysis begins with an examination of the data's normal distribution, followed by the application of paired sample t-tests to assess the mean differences between pretest and posttest scores. The report also includes the application of the Wilcoxon matched-pairs test, a non-parametric alternative used when the assumption of normality is not met. The report provides descriptive statistics, correlation analysis, and significance testing using SPSS output. The findings are interpreted to determine the effectiveness of interventions or treatments based on the comparison of pretest and posttest scores, providing insights into the relationships and significant differences within the data. The report highlights the importance of understanding statistical significance and the implications of the findings.


1 out of 10
Related Documents


Your All-in-One AI-Powered Toolkit for Academic Success.
+13062052269
info@desklib.com
Available 24*7 on WhatsApp / Email
![[object Object]](/_next/static/media/star-bottom.7253800d.svg)
Copyright © 2020–2026 A2Z Services. All Rights Reserved. Developed and managed by ZUCOL.