Comparative Analysis of Rio Tinto and BHP Billiton Limited
21 Pages3820 Words356 Views
Added on 2023-06-05
About This Document
This report provides a comparative analysis of Rio Tinto and BHP Billiton Limited in the mining and natural resources sector. It includes performance ratios, share price movements, factors that may have influenced share price, beta values, expected rates of return, and dividend policies.
Comparative Analysis of Rio Tinto and BHP Billiton Limited
Added on 2023-06-05
ShareRelated Documents
HI5002 Finance for Business Group Assignment T2
2018
2018

TABLE OF CONTENTS
TABLE OF CONTENTS...................................................................................................................................1
CHAPTER 1 : INTRODUCTION.......................................................................................................................2
CHAPTER 2 :OPERATIONS AND COMPARATIVE ADVANTAGES....................................................................3
CHAPTER 3 :PERFORMANCE RATIOS...........................................................................................................5
3.1 Profitability Ratio..............................................................................................................................6
3.2Liquidity Ratios..................................................................................................................................7
3.3 Leverage Ratios.................................................................................................................................8
CHAPTER 4 : 2014-2017 SHARE PRICE MOVEMENT.....................................................................................9
CHAPTER 5 : FACTORS THAT MAY HAVE INFLUENCED SHARE PRICE MOVEMENT....................................11
CHAPTER 6 : BETA VALUES AND EXPECTED RATES OF RETURN.................................................................12
CHAPTER 7 : COMPANY DIVIDEND POLICIES.............................................................................................13
CHAPTER 8 : LETTER OF RECOMMENDATION............................................................................................14
CHAPTER 9 : REFERENCES..........................................................................................................................17
CHAPTER 10 : APPENDIX............................................................................................................................19
1
CHAPTER 1: INTRODUCTION
The purpose of this report is to evaluate and compare two companies. The companies we have
chosen in this report are in the mining and natural resources sector. They include Rio Tinto
Limited (RIO) and BHP Billiton Limited (BHP). The report is divided nine sections as follows:
In section two, we discuss the operations and comparative advantages of the two companies.
In section three,we calculate the performance ratios of the two companies based on liquidity,
profitability and capital structure.
In section four, we analyze the share price movement of the two companies within the last three
years.
In section five, the factors that may have influenced the share price are identified.
In section six, the beta values and expected rates of return are determined using CAPM.
In section seven, the dividend policies under the two chosen companies are compared.
In section eight, a letter of recommendation is made to the investor, based on which company
they should invest in.
2
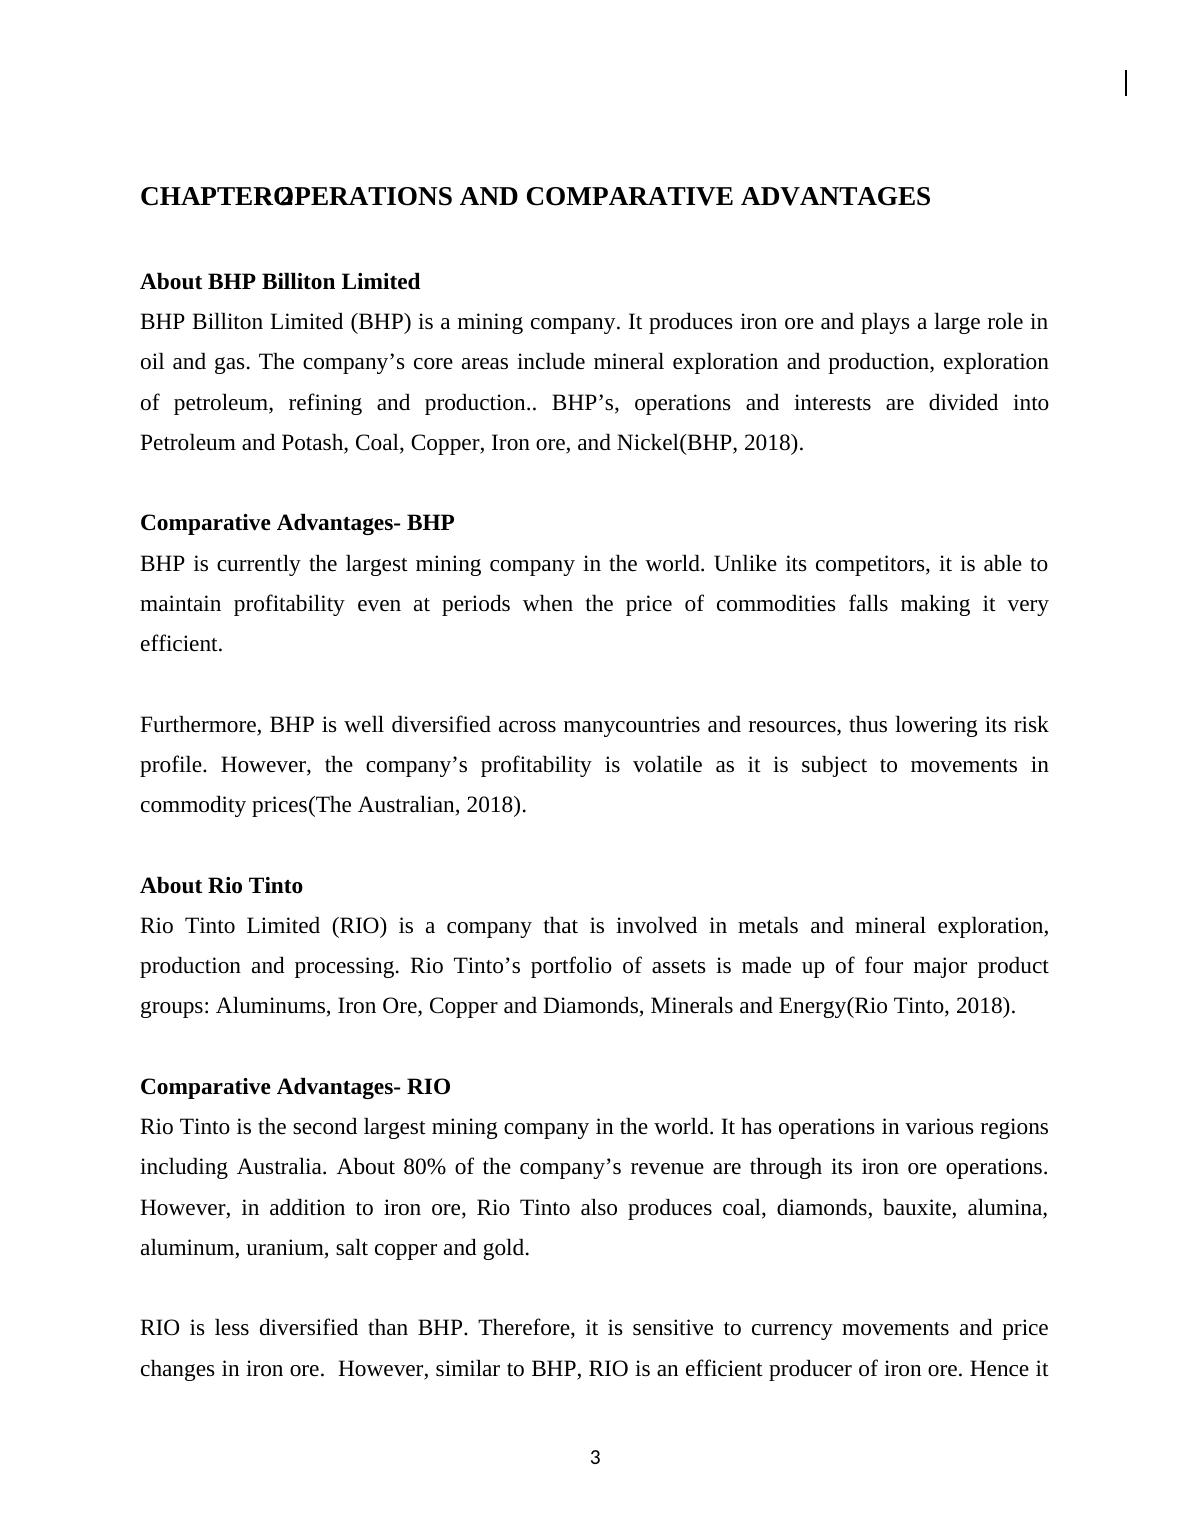
CHAPTER 2:OPERATIONS AND COMPARATIVE ADVANTAGES
About BHP Billiton Limited
BHP Billiton Limited (BHP) is a mining company. It produces iron ore and plays a large role in
oil and gas. The company’s core areas include mineral exploration and production, exploration
of petroleum, refining and production.. BHP’s, operations and interests are divided into
Petroleum and Potash, Coal, Copper, Iron ore, and Nickel(BHP, 2018).
Comparative Advantages- BHP
BHP is currently the largest mining company in the world. Unlike its competitors, it is able to
maintain profitability even at periods when the price of commodities falls making it very
efficient.
Furthermore, BHP is well diversified across manycountries and resources, thus lowering its risk
profile. However, the company’s profitability is volatile as it is subject to movements in
commodity prices(The Australian, 2018).
About Rio Tinto
Rio Tinto Limited (RIO) is a company that is involved in metals and mineral exploration,
production and processing. Rio Tinto’s portfolio of assets is made up of four major product
groups: Aluminums, Iron Ore, Copper and Diamonds, Minerals and Energy(Rio Tinto, 2018).
Comparative Advantages- RIO
Rio Tinto is the second largest mining company in the world. It has operations in various regions
including Australia. About 80% of the company’s revenue are through its iron ore operations.
However, in addition to iron ore, Rio Tinto also produces coal, diamonds, bauxite, alumina,
aluminum, uranium, salt copper and gold.
RIO is less diversified than BHP. Therefore, it is sensitive to currency movements and price
changes in iron ore. However, similar to BHP, RIO is an efficient producer of iron ore. Hence it
3
is able to ‘withstand’ abrupt movements in iron ore prices. Furthermore, the company is able to
benefit when higher cost producers close production(The Australian, 2018).
4
benefit when higher cost producers close production(The Australian, 2018).
4

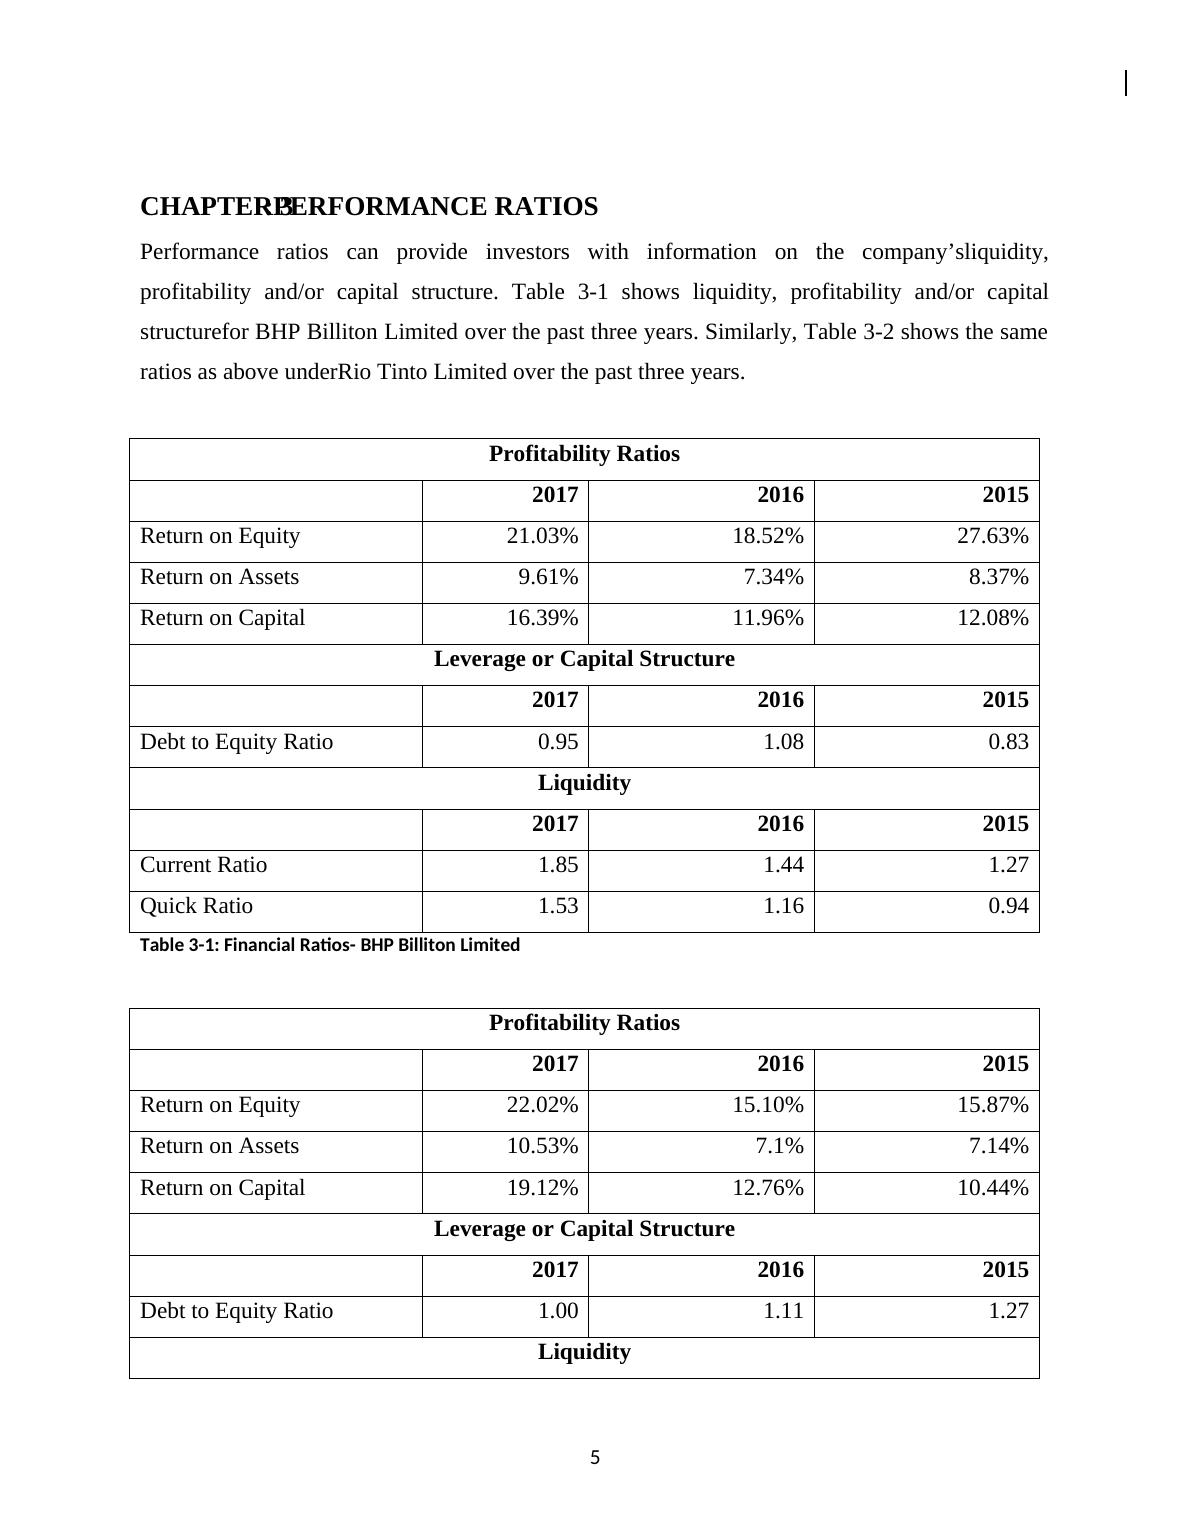
CHAPTER 3:PERFORMANCE RATIOS
Performance ratios can provide investors with information on the company’sliquidity,
profitability and/or capital structure. Table 3-1 shows liquidity, profitability and/or capital
structurefor BHP Billiton Limited over the past three years. Similarly, Table 3-2 shows the same
ratios as above underRio Tinto Limited over the past three years.
Profitability Ratios
2017 2016 2015
Return on Equity 21.03% 18.52% 27.63%
Return on Assets 9.61% 7.34% 8.37%
Return on Capital 16.39% 11.96% 12.08%
Leverage or Capital Structure
2017 2016 2015
Debt to Equity Ratio 0.95 1.08 0.83
Liquidity
2017 2016 2015
Current Ratio 1.85 1.44 1.27
Quick Ratio 1.53 1.16 0.94
Table 3-1: Financial Ratios- BHP Billiton Limited
Profitability Ratios
2017 2016 2015
Return on Equity 22.02% 15.10% 15.87%
Return on Assets 10.53% 7.1% 7.14%
Return on Capital 19.12% 12.76% 10.44%
Leverage or Capital Structure
2017 2016 2015
Debt to Equity Ratio 1.00 1.11 1.27
Liquidity
5
End of preview
Want to access all the pages? Upload your documents or become a member.
Related Documents
Contemporary Financial & Integrated Reportinglg...
|9
|1547
|79
BHP vs Rio: Financial Analysis and Investment Comparisonlg...
|20
|4555
|361
Financial Management Analysis of BHP Billiton and Rio Tinto Limitedlg...
|14
|3153
|103
Finance for Masters: Analysis of BHP Billiton and Rio Tintolg...
|22
|4784
|402
Principles of Financial Markets | Reportlg...
|15
|3684
|115
Corporate Accountinglg...
|23
|4909
|209