BUS286 Corporate Finance: Risk, Return, and Portfolio Diversification
VerifiedAdded on 2023/06/04
|6
|784
|128
Report
AI Summary
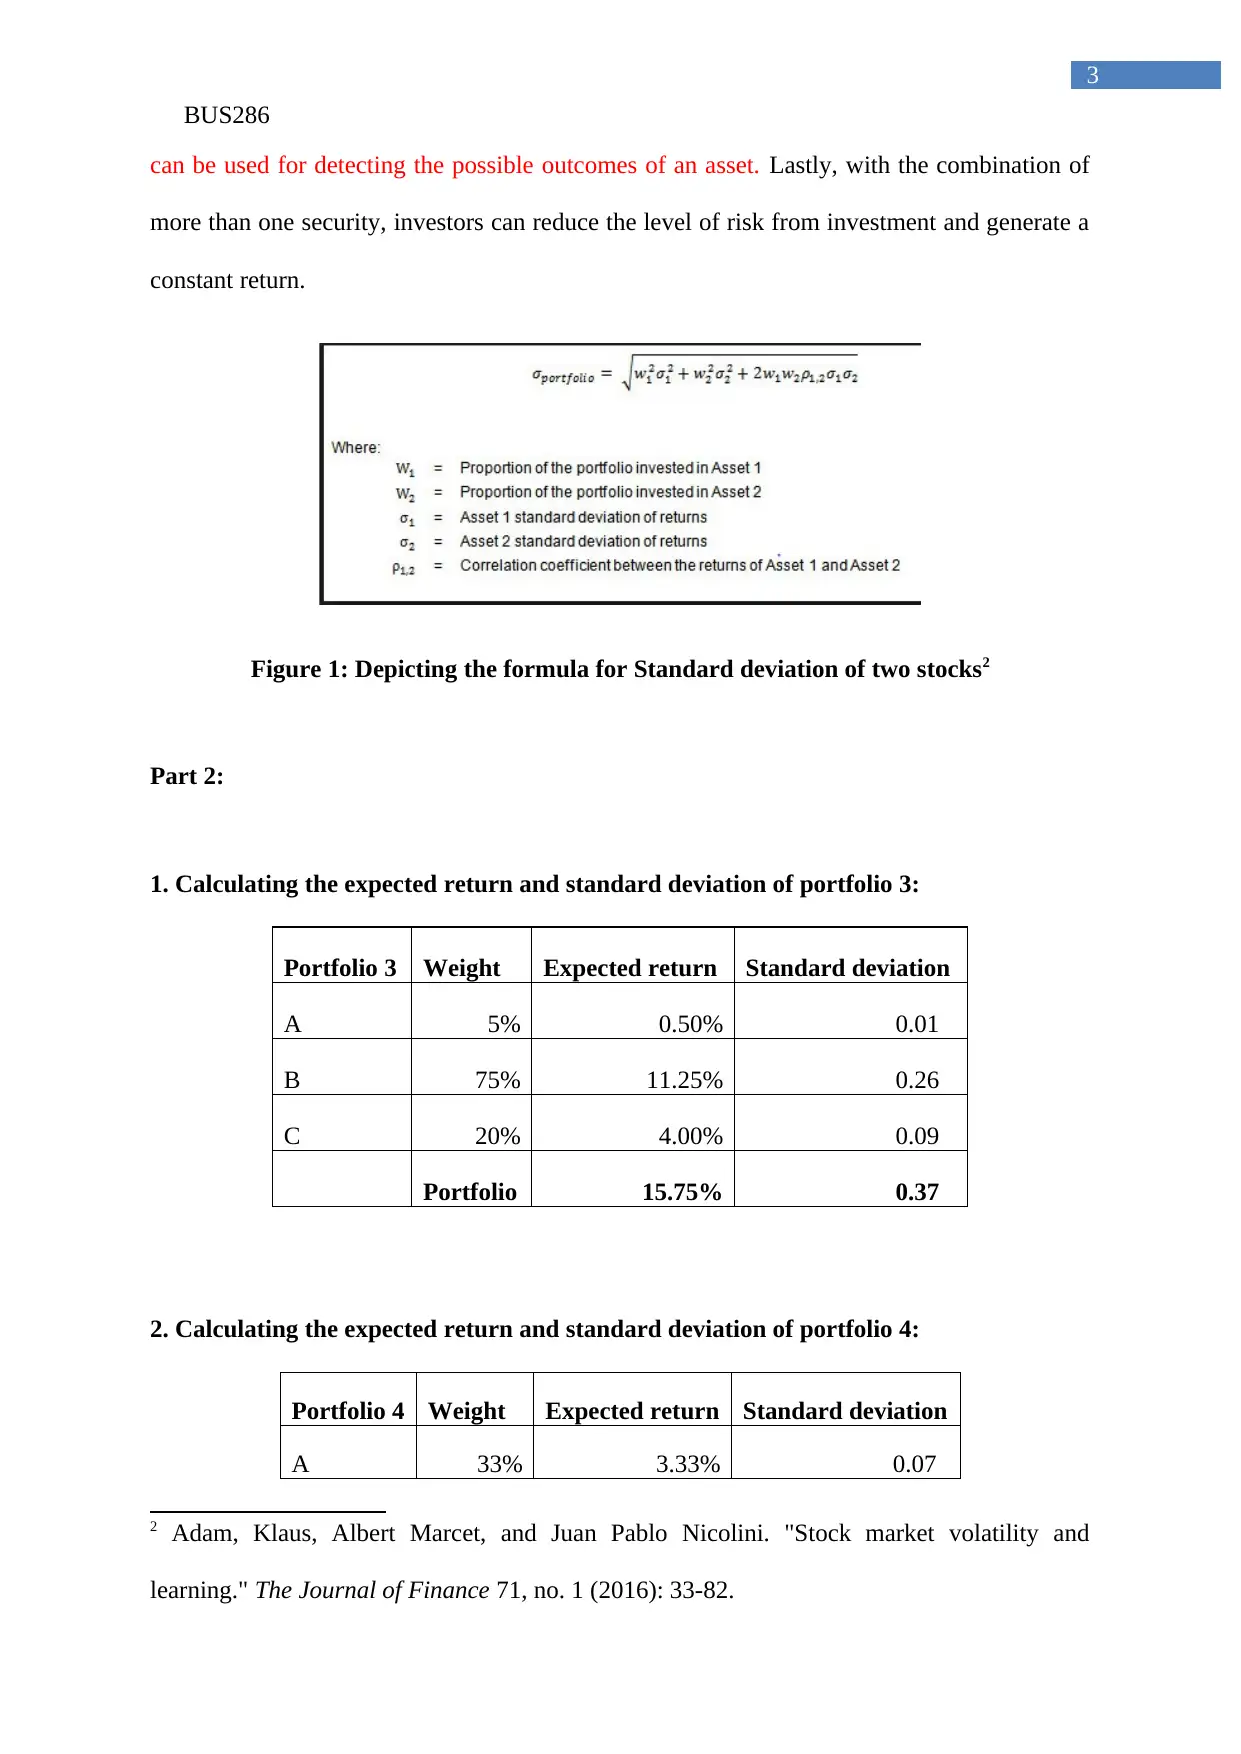
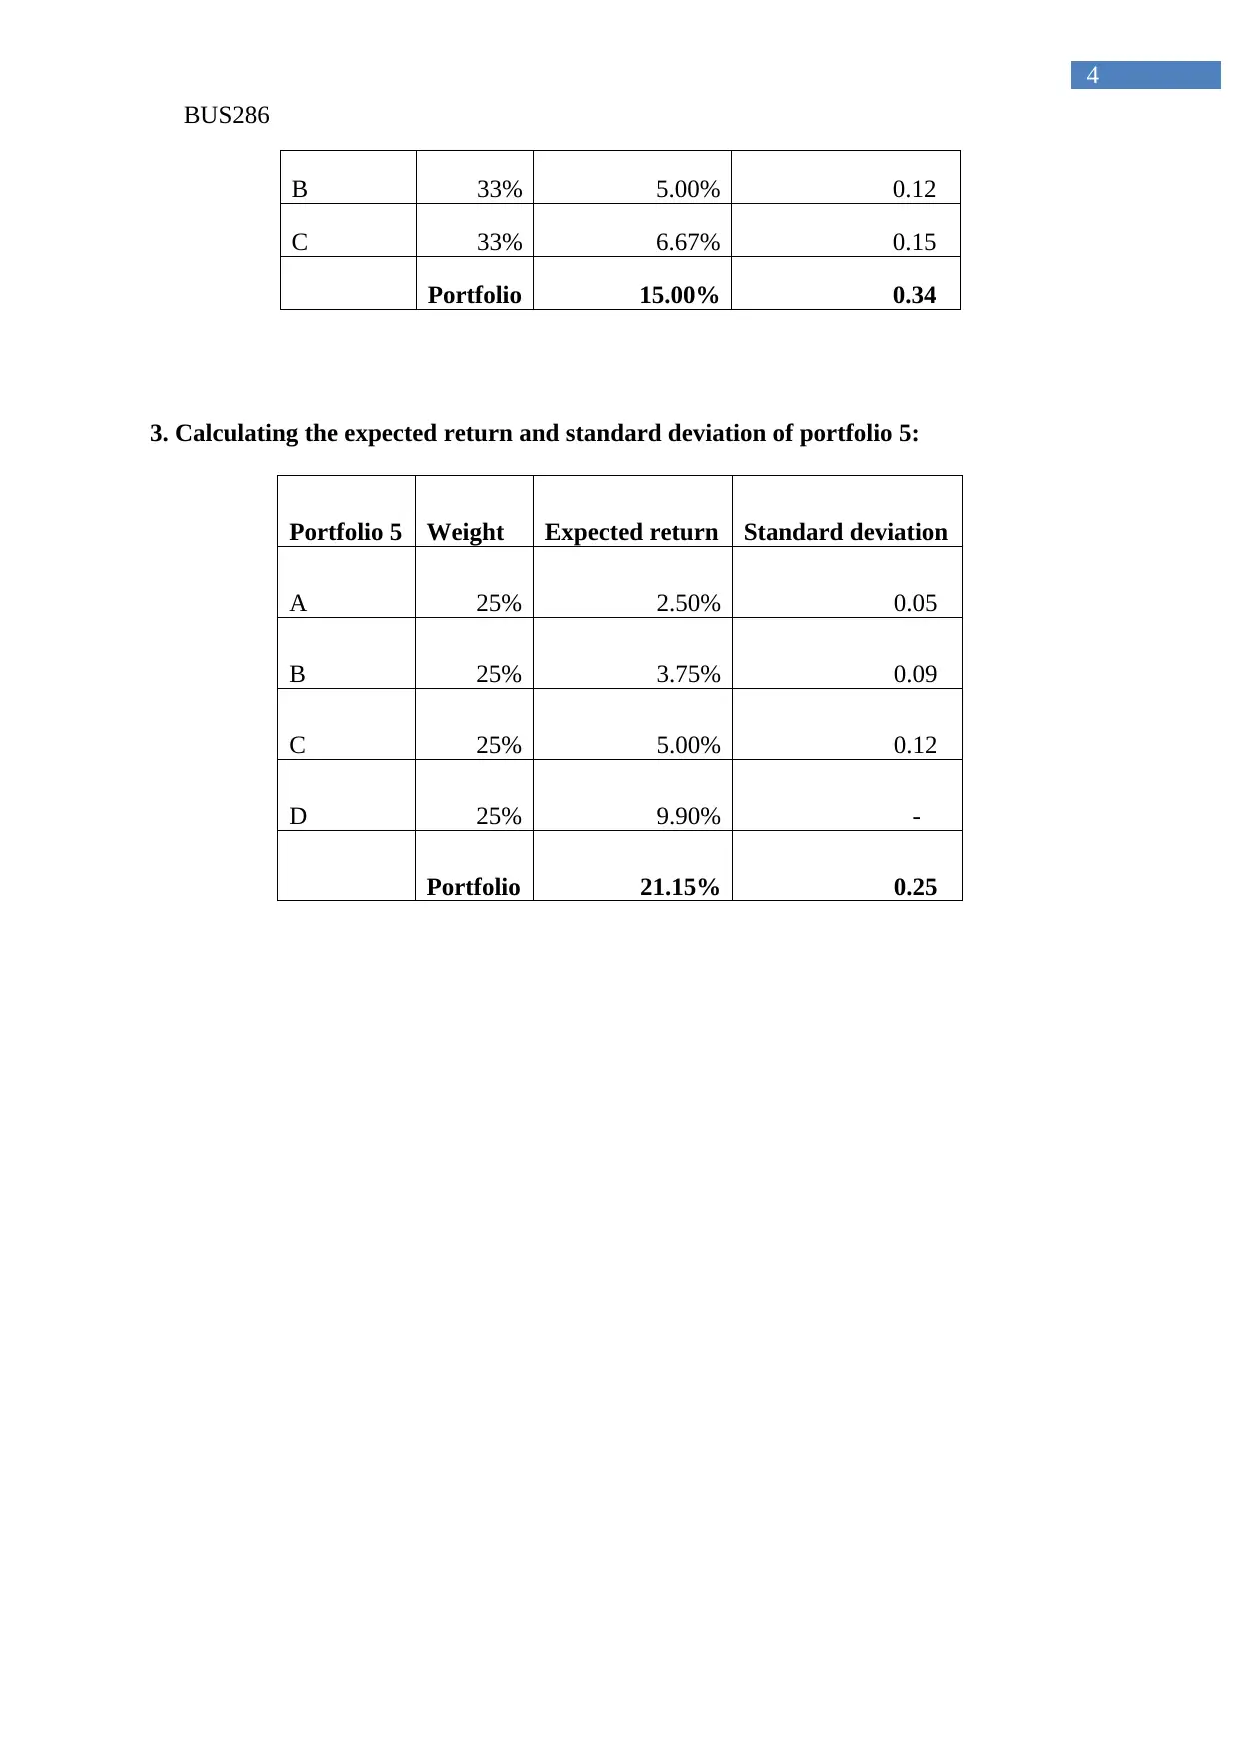
This report provides a comprehensive analysis of risk and return concepts in corporate finance, particularly within the context of investment portfolios. It addresses how standard deviation is used to assess the risk of shares and how correlation coefficients help in understanding the risk associated with combining multiple shares in a portfolio. The report includes calculations of expected return and standard deviation for various portfolios, demonstrating the impact of different asset allocations on overall portfolio risk and return. Key concepts such as the normal distribution curve and dispersion statistics are discussed to provide a deeper understanding of risk assessment in investment decisions. The document is available on Desklib, a platform offering a wide range of study resources for students.
1 out of 6
Related Documents


Your All-in-One AI-Powered Toolkit for Academic Success.
+13062052269
info@desklib.com
Available 24*7 on WhatsApp / Email
![[object Object]](/_next/static/media/star-bottom.7253800d.svg)
Copyright © 2020–2026 A2Z Services. All Rights Reserved. Developed and managed by ZUCOL.