Risk Perception and Analysis - Assignment
VerifiedAdded on 2021/06/17
|19
|4837
|33
AI Summary
Contribute Materials
Your contribution can guide someone’s learning journey. Share your
documents today.

Running head: RISK PERCEPTION AND ANALYSIS
RISK PERCEPTION AND ANALYSIS
RISK PERCEPTION AND ANALYSIS
Secure Best Marks with AI Grader
Need help grading? Try our AI Grader for instant feedback on your assignments.
RISK PERCEPTION AND ANALYSIS 1
Executive Summary:
This report describes the risk management process, its tools, techniques, and methods in order
to develop an understanding the concept of managing risk. It is a well-known fact that risk is
an unavoidable factor in all types of industries and business organizations. Although the type
of risks and their impacts can differ from company to company it is essential to manage these
risks to get success in the long run. This report creates a framework that how risks are
managed by using different techniques. It includes the whole process of risk management
system and the description of the steps of the process. Further, it also includes duties and
responsibilities of risk management department in developing healthy and safe risk managing
policies for the growth of the organization and its employees. Additional efforts are made to
create a wide understanding of the concept by analyzing a case study in terms of risk
management. Some examples are also being used to present all the methods and approaches
in an easy way.
RISK PERCEPTION AND ANALYSIS 2
Table of Contents
PART A:.....................................................................................................................................3
a). Difference between proactive and reactive risk management:..........................................3
b). Process of risk management:.............................................................................................3
Identification and description of risk:.................................................................................3
Understanding the consequences of risks:..........................................................................3
Recognition of existing risk management treatments:........................................................3
Evaluation:..........................................................................................................................3
c). Sources of risk:..................................................................................................................4
Energy:................................................................................................................................4
Functional failures:.............................................................................................................4
Liabilities:...........................................................................................................................4
d). Risk register:.....................................................................................................................4
e). Need to differentiate between general risks and operational risks:...................................4
f). The situation when risk is assumed to be under control:...................................................5
g). Systematic risk control and risk management system:.....................................................5
h). Elements of risk management system:..............................................................................5
Purpose:..............................................................................................................................5
Continuity:..........................................................................................................................6
Control:...............................................................................................................................6
Exercise 1- LTIFR:.................................................................................................................6
Exercise 2- Reason behind the preference given to lower loss and risk cost:........................7
Exercise 3- TCOR..................................................................................................................7
PART B:.....................................................................................................................................8
1. Type of risk:....................................................................................................................8
b). Parameters can be used to comparison of different risks:.................................................8
c). Parameters describing the comparison of similar type of risk:.........................................9
RISK PERCEPTION AND ANALYSIS 3
2. Risk Matrices:.................................................................................................................9
a). Meaning:........................................................................................................................9
b). Critical evaluation of risk matrix:..................................................................................9
PART C:...................................................................................................................................11
1. Mechanism analysis logic diagram...............................................................................11
References................................................................................................................................15
Secure Best Marks with AI Grader
Need help grading? Try our AI Grader for instant feedback on your assignments.
RISK PERCEPTION AND ANALYSIS 4
PART A:
a). Difference between proactive and reactive risk management:
The objectives of both types of the risk management styles are same but the process of
identification of risk is the main factor behind this differentiation. The main difference
between the both is that proactive risk management is a closed loop, adaptive and feedback
control strategy which is based on observation and measurement. On the other hand, reactive
risk management technique is based on the evaluation of accidents and findings of the audit.
It is responsive risk management in nature. Proactive risk management techniques are used to
reduce the tendency of all types of future accidents by ascertaining the boundaries of
functions. Whereas reactive risk management approach tends to minimize the occurrence of
same or similar accidents of past and can be repeated in future (Kilubi, 2016).
b). Process of risk management:
Process of risk management can be understood as follows:
Identification and description of risk:
It involves identifying the risk and describing all the risks in risk registers. This steps
involves the analysis of all risks so that required steps can be taken.
Understanding the consequences of risks:
In this step Consequences of risks are identified by using various comparative scales and
methods of risk estimation. The person who is analyzing risk is required to ensure that the
risk management policy is required to cover all the consequences identified in this step.
Insurance policy also needs to be examined to know the actual consequences of risks
(Khameneh, et al., 2016).
Recognition of existing risk management treatments:
In this step, tools and treatments that can be used to manage the identified risks are analyzed.
This also involves the measurement of comprehensive organizational structure and its
capacity to deal with the identified risks.
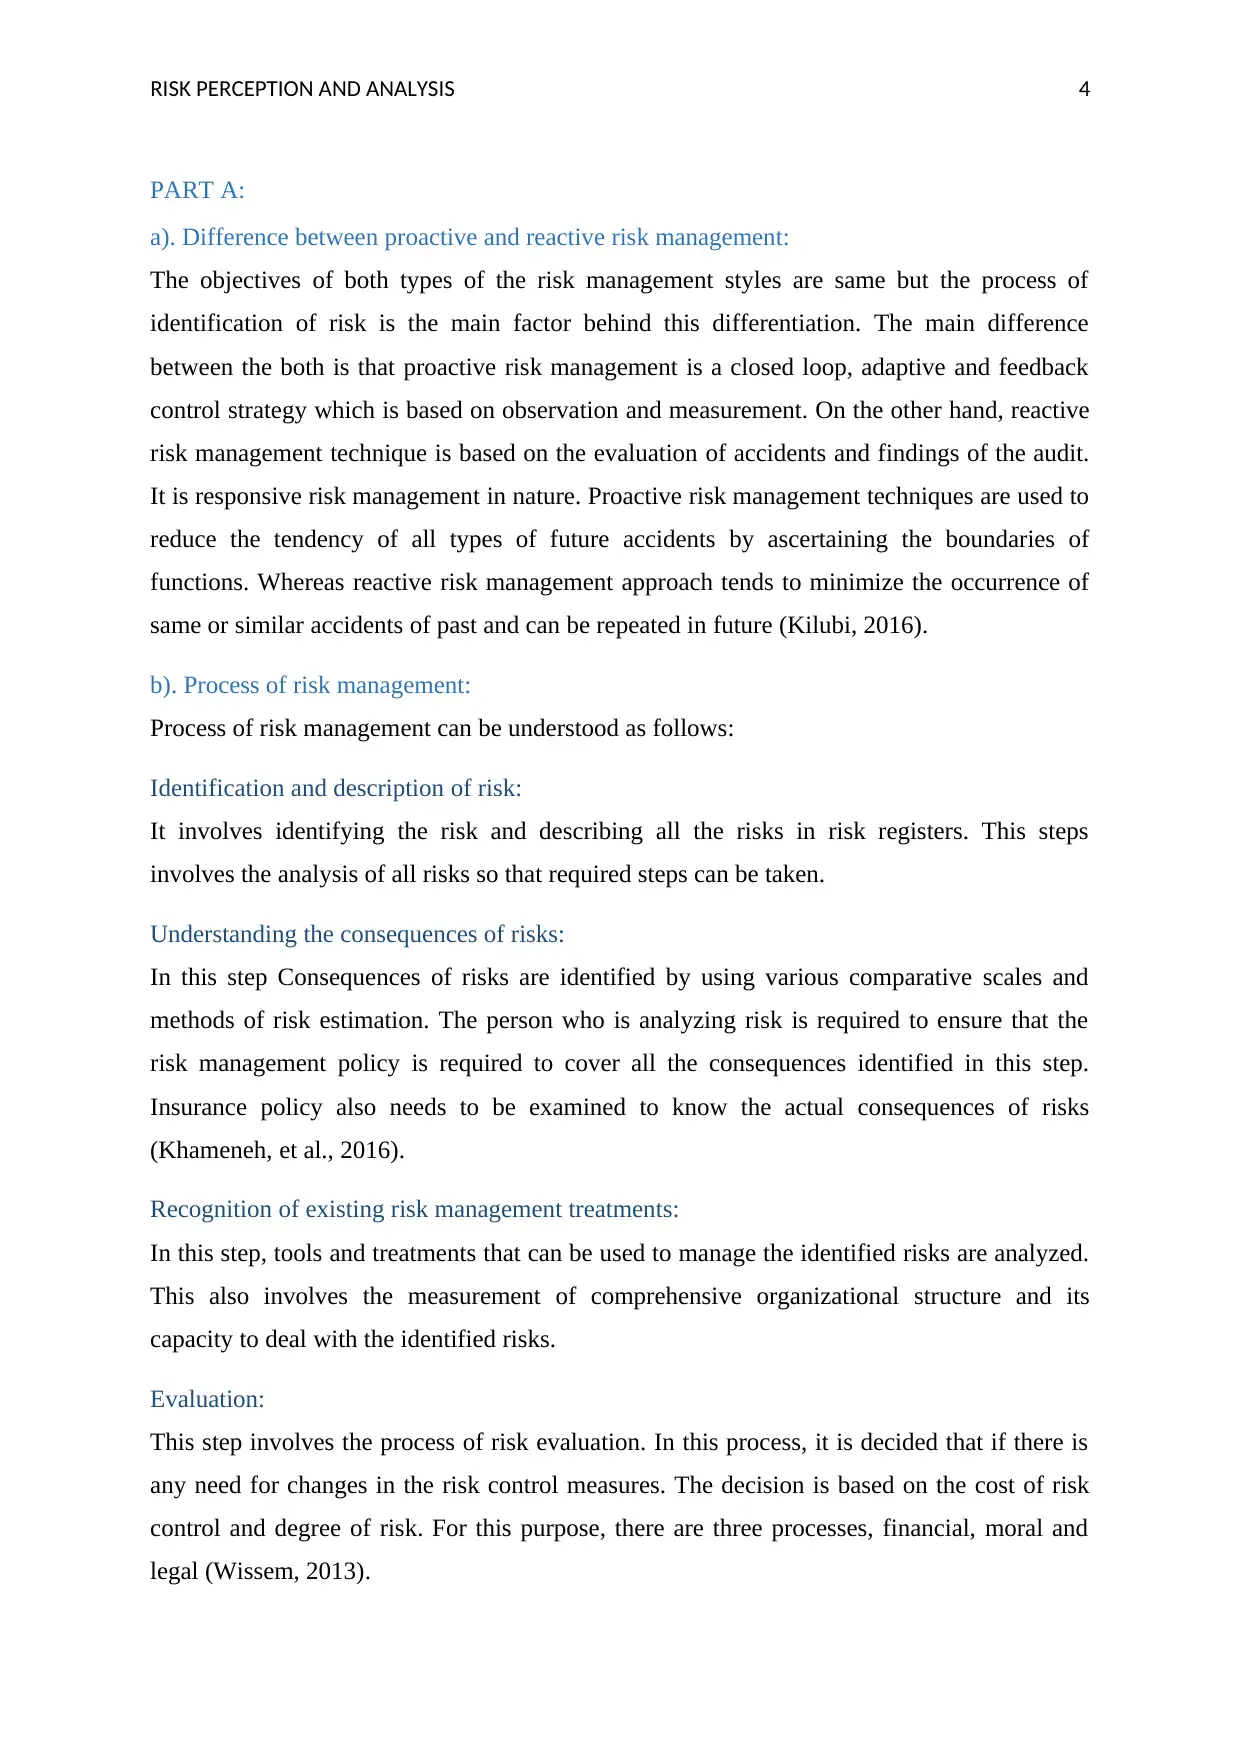
Evaluation:
This step involves the process of risk evaluation. In this process, it is decided that if there is
any need for changes in the risk control measures. The decision is based on the cost of risk
control and degree of risk. For this purpose, there are three processes, financial, moral and
legal (Wissem, 2013).
PART A:
a). Difference between proactive and reactive risk management:
The objectives of both types of the risk management styles are same but the process of
identification of risk is the main factor behind this differentiation. The main difference
between the both is that proactive risk management is a closed loop, adaptive and feedback
control strategy which is based on observation and measurement. On the other hand, reactive
risk management technique is based on the evaluation of accidents and findings of the audit.
It is responsive risk management in nature. Proactive risk management techniques are used to
reduce the tendency of all types of future accidents by ascertaining the boundaries of
functions. Whereas reactive risk management approach tends to minimize the occurrence of
same or similar accidents of past and can be repeated in future (Kilubi, 2016).
b). Process of risk management:
Process of risk management can be understood as follows:
Identification and description of risk:
It involves identifying the risk and describing all the risks in risk registers. This steps
involves the analysis of all risks so that required steps can be taken.
Understanding the consequences of risks:
In this step Consequences of risks are identified by using various comparative scales and
methods of risk estimation. The person who is analyzing risk is required to ensure that the
risk management policy is required to cover all the consequences identified in this step.
Insurance policy also needs to be examined to know the actual consequences of risks
(Khameneh, et al., 2016).
Recognition of existing risk management treatments:
In this step, tools and treatments that can be used to manage the identified risks are analyzed.
This also involves the measurement of comprehensive organizational structure and its
capacity to deal with the identified risks.
Evaluation:
This step involves the process of risk evaluation. In this process, it is decided that if there is
any need for changes in the risk control measures. The decision is based on the cost of risk
control and degree of risk. For this purpose, there are three processes, financial, moral and
legal (Wissem, 2013).
RISK PERCEPTION AND ANALYSIS 5
c). Sources of risk:
In every organization, there are mainly three sources of risks:
Energy:
Energy is the main source for introducing the risk related to physical loss and damage. To
avoid such loss, energy damage theory is used by the organizations to build an inclusive and
complete listing.
Functional failures:
Functional failures can lead to the financial loss of the organization. Functional failure means
failure in the completion of purpose for which the organization is working thus it ultimately
affects the profitability of the business.
Liabilities:
Liabilities include the situation in which an organization fails to deliver its output on time. It
also introduces the chances of loss to the business whether in terms of revenue, time, and
work or in teams of customer’s and stakeholder’s faith (Health, 2017).
d). Risk register:
The risk register is prepared at the very first stage of risk management process to record the
identified risk related to the business. It includes all the sources of risks and also includes the
elements for measuring those sources. All day to day transactions and their outcome provided
by comprehensive departments related to risk analyses are recorded in this register. A poorly
constructed risk register often shows the risk management capacity of an organization
(Uzulans, 2015).
e). Need to differentiate between general risks and operational risks:
General risks are the result of managerial decisions and easy to solve. An organization is
supposed to manage some level and type of risks in its day to day operations, such risks are
considered as general risks. On the other hand, operational risks are associated with the
decision that can impact the profitability and working of the whole organization on a very
large scale. Different strategies are needed to face both types of risk. In order to formulate
suitable policies for different risks, it is important to identify the difference between general
risks and operational risks (Junior & Carvalho, 2013).
RISK PERCEPTION AND ANALYSIS 6
f). The situation when risk is assumed to be under control:
A risk can be said under control the manager of the risk gets the statement that he wants to
see the outcome of his efforts. Feedbacks from the employees and measuring the
effectiveness of identified risk can ensure a person that whether the risk is under control or
not. It can also be assumed by studying the risk trending curve of the concerned organization.
It the curve shows decreasing line than it means the risks are managed efficiently and there
are no any chances of loss to the organization (Liu, et al., 2016).
g). Systematic risk control and risk management system:
Rowe provided a differentiated view of systematic risk control and risk management system.
The first one is related to a large entity like a state and country. It is a systematic approach
because features that are responsible for managing risk are made according to ways of
working of the community like educational institutions, industry, equipment suppliers,
insurance and government sector. On the other hand, risk management plan is something that
can be framed and adopted by any individual entity or an individual organization according to
its requirements.
According to Rowe, a plan and its implementation are required for the Systematic control of
risks that involves quality assurance, a philosophy of minimizing risks, training to employees,
registration and licensing of the operations and other required functions. But in case of risk
management system, there is no need and scope for managing plans globally. This approach
is limited to the boundaries of a company and has no wide aspect (Hao & Han, 2014).
h). Elements of risk management system:
The elements of a risk management system are required to follow in the process to managing
risks. If any of the below-mentioned elements is not considers, then there may be chances of
failure of risk management system:
Purpose:
The main purpose of the risk management strategies must be controlling the risks. Each risk
has its own controlling measures and efforts should be made separately for the purpose of
controlling the risk. There must be flexibility in the community standards according to the
requirement and complexity of risk. The total cost of risk (TCOR) is to be reduced over the
time.
Paraphrase This Document
Need a fresh take? Get an instant paraphrase of this document with our AI Paraphraser
RISK PERCEPTION AND ANALYSIS 7
Continuity:
There should be continuity in the process of risk management. Because the time of risk event
in quite lengthy and within this time frame, managers and employees may come and go.
Every new manager tries to apply his knowledge and new management processes which may
result in loss of the continuity of performance and knowledge.
Control:
Control system of an organization should be sound and strong in order to manage an effective
process of risk control. An organization is required have control over its operations,
functions, and objectives so that a predetermined and evaluated risk management process can
be implied.
Exercise 1- LTIFR:
Lost time injury frequency rate is used by companies to help them in maintaining workplace
safety and the efficiency of safety programs. LTIFR matrix is also used to compare and
calculate the frequency of occurring a number of injuries to the business. The rates are
calculated and compared using lost time injuries and medical treatment injuries. LTIFR is a
useful matrix to calculate low consequences value because its techniques and methods are not
sufficient to measure values containing heavy consequences. The methods of LTIFR does not
contain all the requirements on the basis of which high consequences values and their impacts
can be estimated. The main terms of LTIFR can be defined as follows:
Lost time injury:
All type of injuries faced by the employees while performing their jobs that stops them to
perform their duties at least for a day or a shift.
Lost time injury frequency rate:
It indicates the total number of lost time injuries occurred during the reporting period. Most
of the companies prefer to calculate LTIFR per million employee hours worked.
LTIFR is calculated by multiplying the number of lost time injuries occurred during a
reporting period to 1,00,000 and then dividing the result by the total number of hours worked
during the same reporting period.
Lost time injury frequency rate can be reduced by building an effective safety environment,
regular conducting hazard assessments and investing in the training of employees. Employee
RISK PERCEPTION AND ANALYSIS 8
health and safety (EHS) department is responsible to manage the increasing and decreasing
rate of LTIFR in an organization (Amoako & Suglo, 2015).
Exercise 2- Reason behind the preference given to lower loss and risk cost:
A competent management team would like to opt for lower loss and lower risk cost. Lower
loss and risk cost indicates that the decisions made by the company can create risks of the
lower level and the cost required to manage this risk is also very low in comparison to
managing high risks. If company invest in managing high risk than it would need a large sum
and after investing that sum it is also not necessary to get positive results. If results of the risk
management go beyond the expectations, then it may prove harmful to business. So after
considering that amount of loss and complexities, a team of competent managers would
always like to follow lower cost and lower risk policy. The lower loss also indicated that the
operations of the company would not get affected for a long time. Employee health and safety
department of an organization always ensures the use of such policies and frameworks which
may result into decreasing the rate of risk and loss because increased value of risks and losses
may also result in leaving jobs and dissatisfaction employee. The goodwill of the company
may also get affected if the risk and loss cost is high reported by an organization. Thus, most
of the reputed organizations prefer to maintain the lower loss and low cost in order to get
success in log run and to ensure the well-being and safety of their employees.
Exercise 3- TCOR
In the field of risk management, Total Cost of Risk popularly known as TCOR is a very
useful term. But its meaning has watered down by its overuse and from the point of view of
risk analyses, this is creating trouble. It is so because while evaluating TCOR, people are
missing its key components. This can be understood by the following example:
A company providing employment for more than 1500 employees in multiple regions. As the
company is one of the reputed organization, it uses TCOR to evaluate risks associated with
the business and its practices. Following are the constituents that frame the process for
calculating TCOR.
Evaluation of the multiple years is done so that a particular good or bad year cannot
affect the results.
In next step calculation of financing the risks are considered which is done by
merging the pure premiums of each year and dividing that sum by the net revenue of
each particular year.
RISK PERCEPTION AND ANALYSIS 9
After this, the company performs calculations of loss costs of both types including
indirect and direct.
In this step administration cost of the different line items are estimated by the
company but mainly it included charges and resources that a broker charged to for his
services.
This is the last step in which all the data and information collected from above steps is
measured by TCOR (AON, 2018).
TCOR suggest that if risk controlling activities are adopted and directed in a systematic
manner then an organization can expect a decrease in cost of loss. Here it can be said that law
of diminishing returns is applying (Garrick & Gekler, 2013).
PART B:
1. Type of risk:
An organization has to face any type of risks in performing its day to day operations as well
as to achieve its long-term objectives. The risk that is selected in this report is the risk
associated with specific energy or threat source.
a). Worker fatalities and injuries have long been concerning aspect of the organizations
working in manufacturing and concerning industry. To evaluate this concern, specific energy
method is based on the proactive risk management approaches to provide safety measures to
an organization. Although the quality and quantity of data related to managing risk have
improved a lot in recent years, the available data cannot be linked directly to the natural
principles and thus it is limited to its scientific extension and application. This method
provides a new a vast explanation to risk safety and measures by using the concept of energy.
In the method, all the threats are truly defined by the explanation often different forms of
energy including motion, electrical and gravity. This method aims to establish a direct link
between energy transfer and safety link. This concept is inspired by the model of natural
disaster. Thus, it is translated by defining the criticality of an event by examining the ratio of
the magnitude of exerted energy to the resiliency of affected part of human body and the
pressure exercised on the same part. In addition to this, the probability of the component of
risk is explained by the combination of social, human and technological factors contributing
to the chance of transferring the energy (Viner, 2018).
Secure Best Marks with AI Grader
Need help grading? Try our AI Grader for instant feedback on your assignments.
RISK PERCEPTION AND ANALYSIS 10
b). Parameters can be used to comparison of different risks:
The significance of risk is the main factor that differs it from another type of risk associated
with the same operations and functions. To define the significance of the different type of
risks different type of parameters can be used. For example risk of occurring car accidents
and risk of death of people due to heart attacks are two different type of risks. To compare
both types of risk, some bases can be used like the process of risks initiated, their impact on
totality, measures that can be taken to minimize such risks, government rules and regulation
related to both type of risks etc. It is not possible to use same parameters for the comparison
of dissimilar risks because both of them are different in nature as well as their significance
and impact are also different at different timings.
c). Parameters describing the comparison of similar type of risk:
All type of risk has some descriptive and expressive parameters that are usually common to
all risks of the same category. Those factors are called common of simple risk factors. Risk
factors are used to make difference between various circumstance and conditions that
describe a particular risk. This parameter depends mainly depends upon the environment of
the organization in which it is working. It also includes the rules and regulations of different
governing authorities of the different organizations. For example: in some countries, car
accidents are reported in high quantity than others. It is because of rules of traffic police,
conditions of vehicles and negligence of traffic rules. Parameters that can be used for the
comparison of similar risks are usually same but their level of adoption is different from
person to person. As given in example: the rate of conditions of vehicles, traffic rules and
other related parameters of analyzing the chances of accidents may differ from country to
country or region to region but they all are same to compare the risks (Pickering & Poowley,
2010).
2. Risk Matrices:
a). Meaning:
According to Pickering and Cowley, risk matrices are used to identify hazard and their
management. These are used to measure the level of risk related to the identified threats and
hazards, to rank the risks and to propose appropriate actions. Two dimensional matrices are
the most common type of matrices and are termed as effective and simple approaches to risk
management.
Example of risk matrices:
RISK PERCEPTION AND ANALYSIS 11
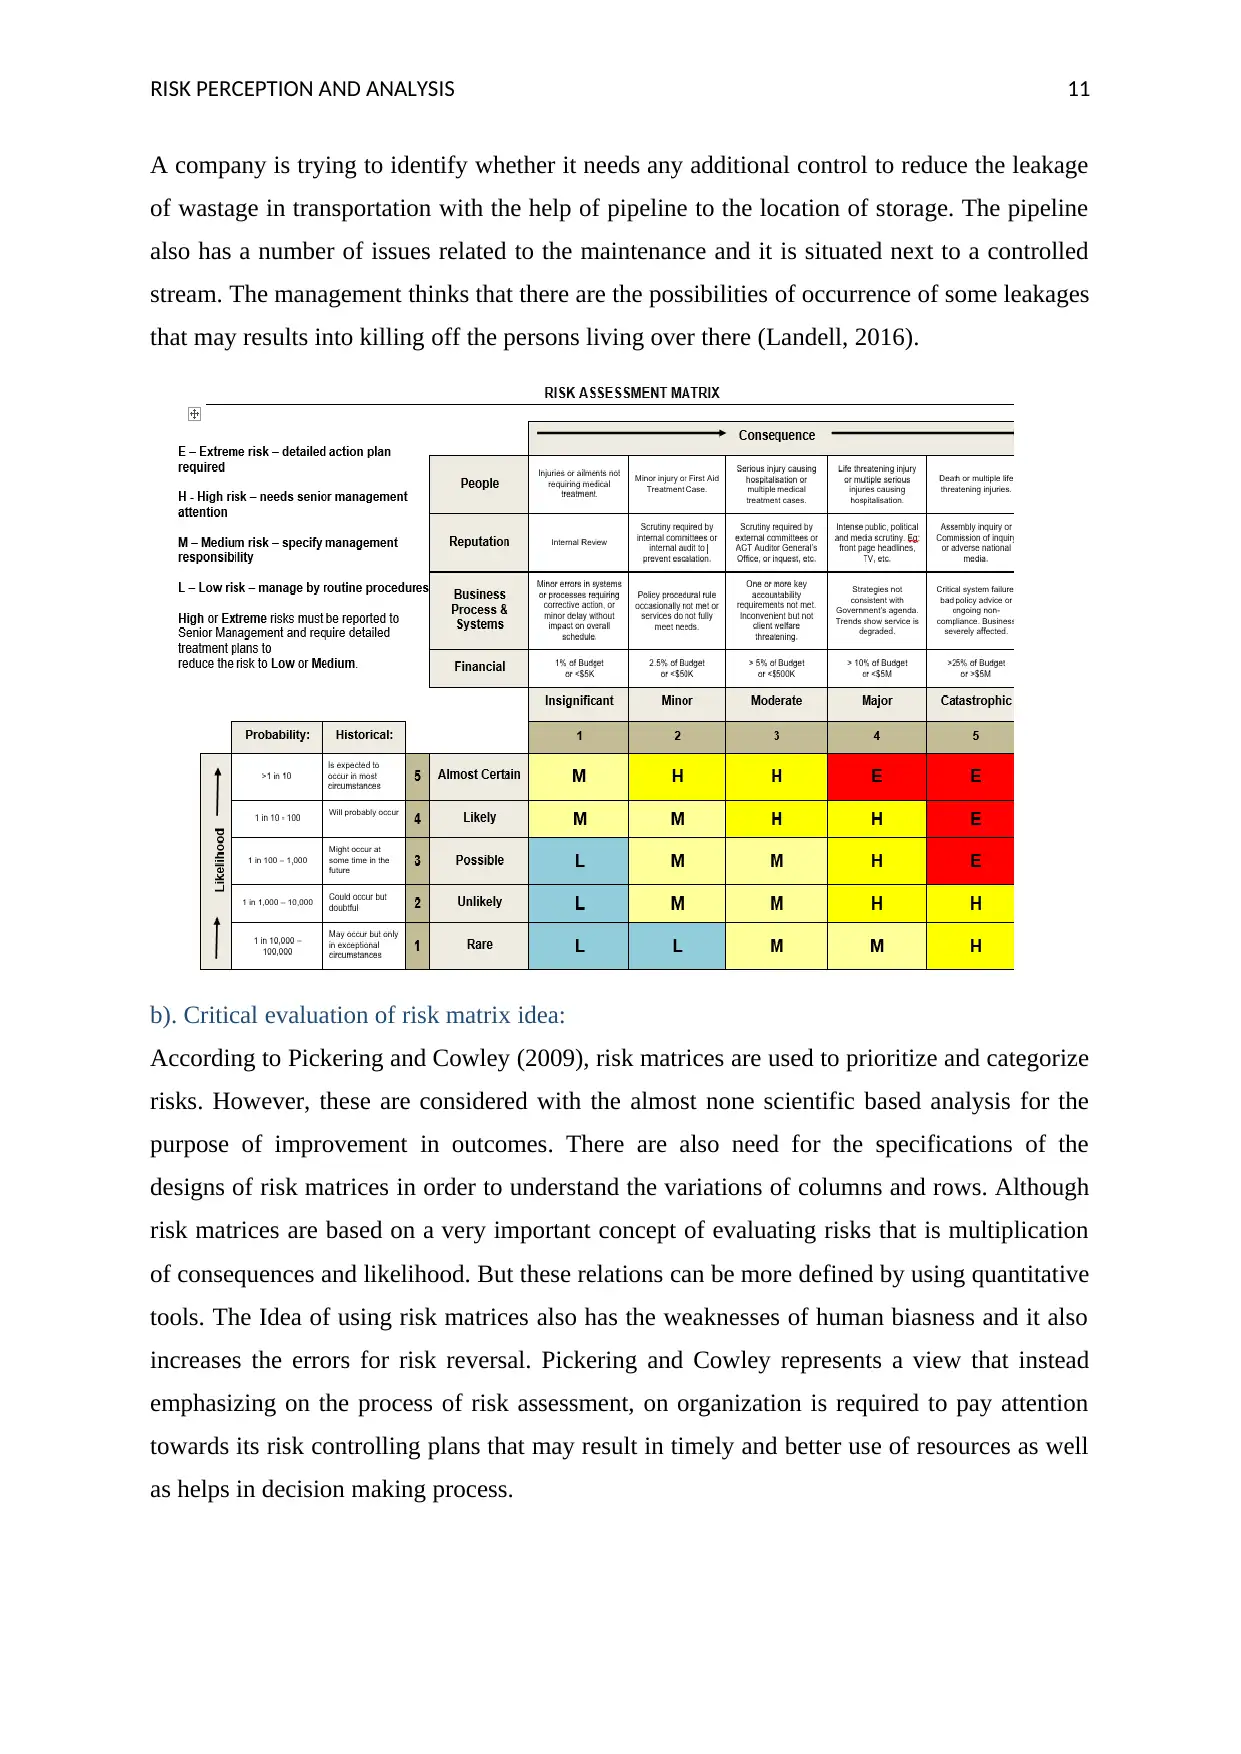
A company is trying to identify whether it needs any additional control to reduce the leakage
of wastage in transportation with the help of pipeline to the location of storage. The pipeline
also has a number of issues related to the maintenance and it is situated next to a controlled
stream. The management thinks that there are the possibilities of occurrence of some leakages
that may results into killing off the persons living over there (Landell, 2016).
b). Critical evaluation of risk matrix idea:
According to Pickering and Cowley (2009), risk matrices are used to prioritize and categorize
risks. However, these are considered with the almost none scientific based analysis for the
purpose of improvement in outcomes. There are also need for the specifications of the
designs of risk matrices in order to understand the variations of columns and rows. Although
risk matrices are based on a very important concept of evaluating risks that is multiplication
of consequences and likelihood. But these relations can be more defined by using quantitative
tools. The Idea of using risk matrices also has the weaknesses of human biasness and it also
increases the errors for risk reversal. Pickering and Cowley represents a view that instead
emphasizing on the process of risk assessment, on organization is required to pay attention
towards its risk controlling plans that may result in timely and better use of resources as well
as helps in decision making process.
RISK PERCEPTION AND ANALYSIS 12
According to Viner et. al (2003), different methods of risk evaluation have different
advantages and disadvantages according to the type of risk. While one of the methods would
not expect a group of persons working independently to generate equal assessments of a risks
analyzed, another one assumes that there should be as realistic degree of agreement among
different evaluators. In the study carried out by the above authors, statistical analysis of the
obtained results shows that in all methods, there were inconsistency between the evaluators.
It also shows that there was a level of similarity among all the distributions of the six sets of
assessment of risk category. In every case, the most common assessment was regarding the
measurement of the high end of presented risk scale. Using of risk methods for the purpose of
assessment of risk is more beneficial and result oriented than use of risk matrices because
these are based on quantitative basis and their scientific analysis is also possible. The results
based on the methods often helps in making decision regarding the control of risks.
Based on my personal experience of using risk matrices and risk assessment methods, I also
have an opinion that choice to methods for accessing the risk involves determining the
category of risk and their impact. Risk matrices are easy to use and evaluate but on the other
hand, risk matrices cannot provide more useful information in comparison to risk assessment
methods because there is lack of quantitative and scientific analyses of the information. In
risk matrices, only pre-determined theories and assumptions are made by studying the
consequences and likelihood of an event. The level of loss form that particular event is not
estimated properly by the use of risk matrices. Most of the organization are prefer to use the
risk assessment methods in order to make rules and policies regarding the safety of their
employees because results of the methods are more trustable than the matrices.
PART C:
1. Mechanism analysis logic diagram
Here the fault tree analysis is used to define the risk related to a situation. A fault tree
analysis creates a visual record of a well-defined system defining logical relationships
between causes and events which may lead to failure. It helps in in understanding results very
quickly and emphasis in the design and also identifies the errors.
Situation: If the main machines related to the operations in a company has some issues that
may lead to have an injury in the hands to worker operating it. There are chances that it may
lead to have major injury. The impacts of the above situation can be understood by the
analysis of below mention diagram.
According to Viner et. al (2003), different methods of risk evaluation have different
advantages and disadvantages according to the type of risk. While one of the methods would
not expect a group of persons working independently to generate equal assessments of a risks
analyzed, another one assumes that there should be as realistic degree of agreement among
different evaluators. In the study carried out by the above authors, statistical analysis of the
obtained results shows that in all methods, there were inconsistency between the evaluators.
It also shows that there was a level of similarity among all the distributions of the six sets of
assessment of risk category. In every case, the most common assessment was regarding the
measurement of the high end of presented risk scale. Using of risk methods for the purpose of
assessment of risk is more beneficial and result oriented than use of risk matrices because
these are based on quantitative basis and their scientific analysis is also possible. The results
based on the methods often helps in making decision regarding the control of risks.
Based on my personal experience of using risk matrices and risk assessment methods, I also
have an opinion that choice to methods for accessing the risk involves determining the
category of risk and their impact. Risk matrices are easy to use and evaluate but on the other
hand, risk matrices cannot provide more useful information in comparison to risk assessment
methods because there is lack of quantitative and scientific analyses of the information. In
risk matrices, only pre-determined theories and assumptions are made by studying the
consequences and likelihood of an event. The level of loss form that particular event is not
estimated properly by the use of risk matrices. Most of the organization are prefer to use the
risk assessment methods in order to make rules and policies regarding the safety of their
employees because results of the methods are more trustable than the matrices.
PART C:
1. Mechanism analysis logic diagram
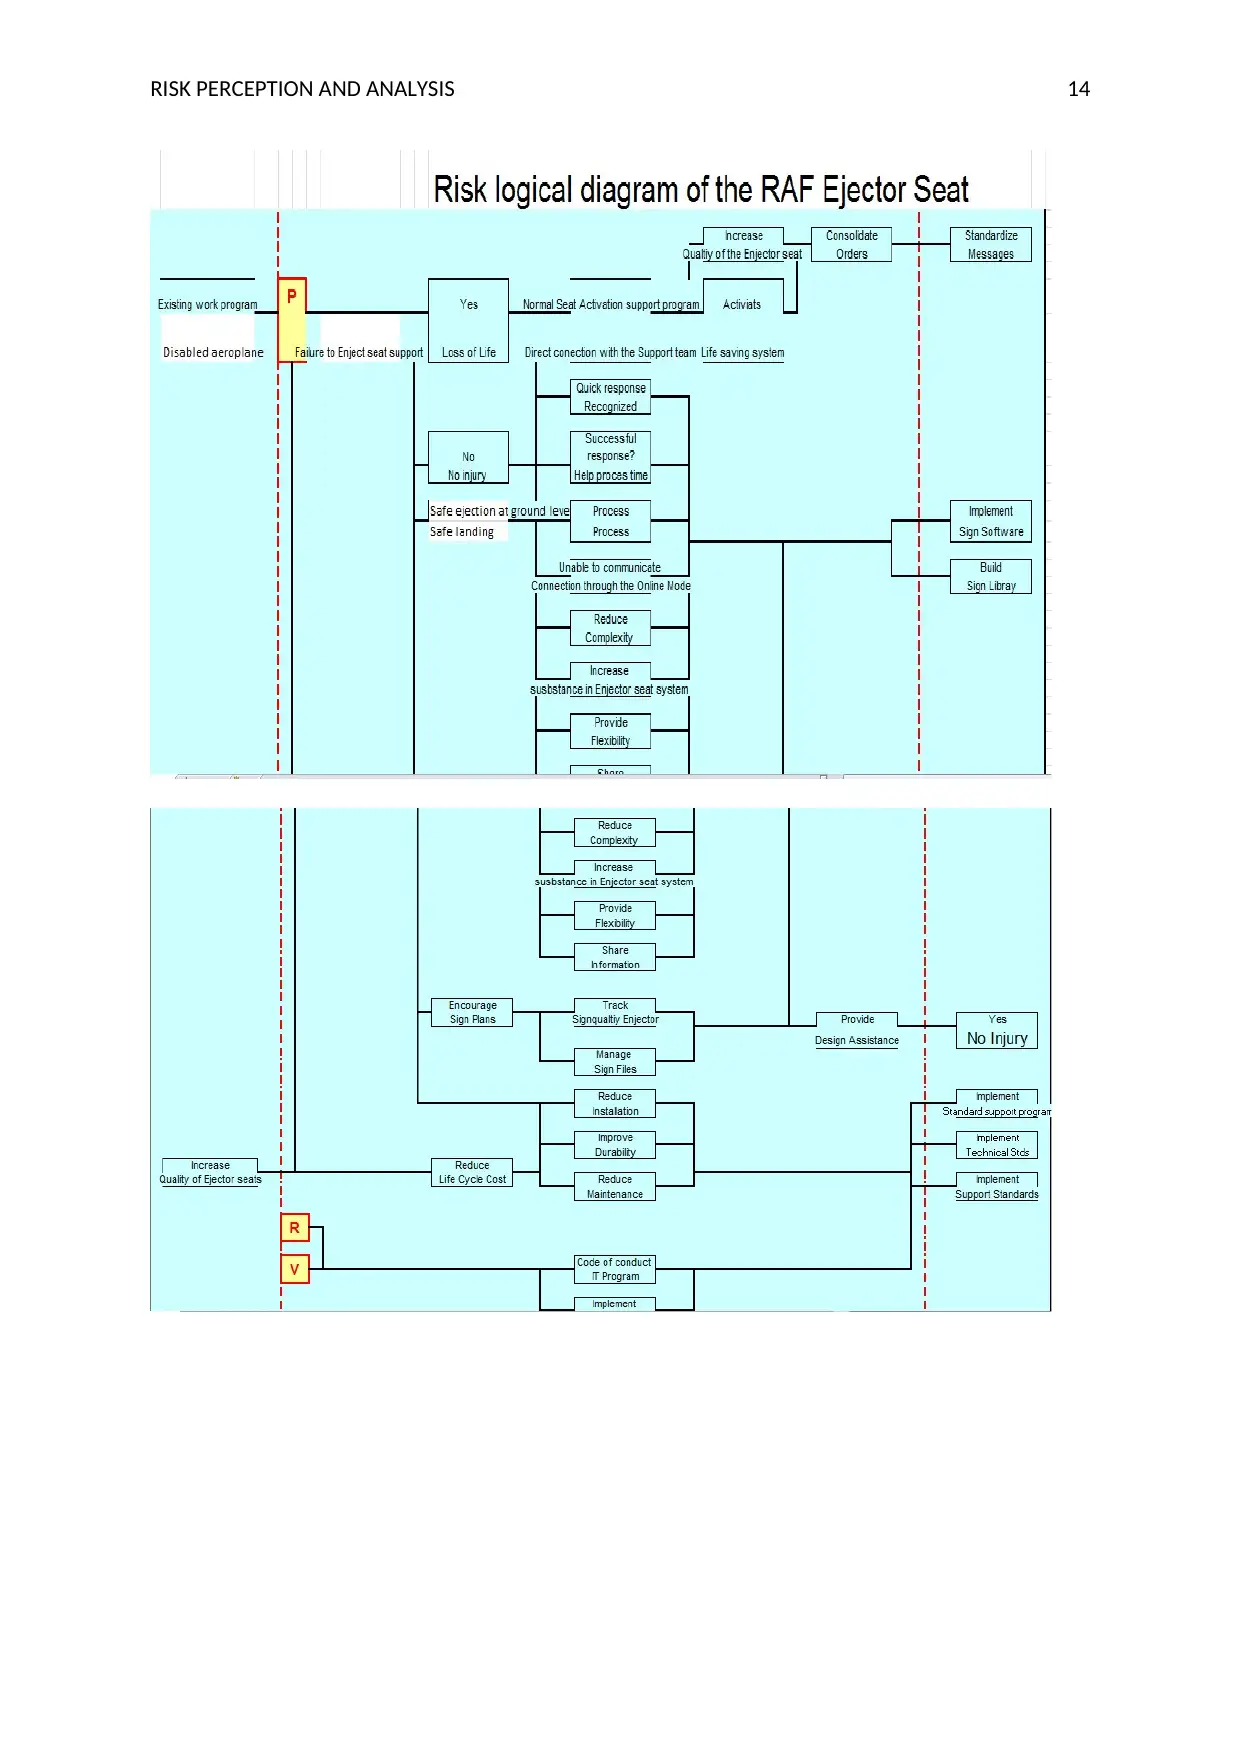
Here the fault tree analysis is used to define the risk related to a situation. A fault tree
analysis creates a visual record of a well-defined system defining logical relationships
between causes and events which may lead to failure. It helps in in understanding results very
quickly and emphasis in the design and also identifies the errors.
Situation: If the main machines related to the operations in a company has some issues that
may lead to have an injury in the hands to worker operating it. There are chances that it may
lead to have major injury. The impacts of the above situation can be understood by the
analysis of below mention diagram.
Paraphrase This Document
Need a fresh take? Get an instant paraphrase of this document with our AI Paraphraser
RISK PERCEPTION AND ANALYSIS 13
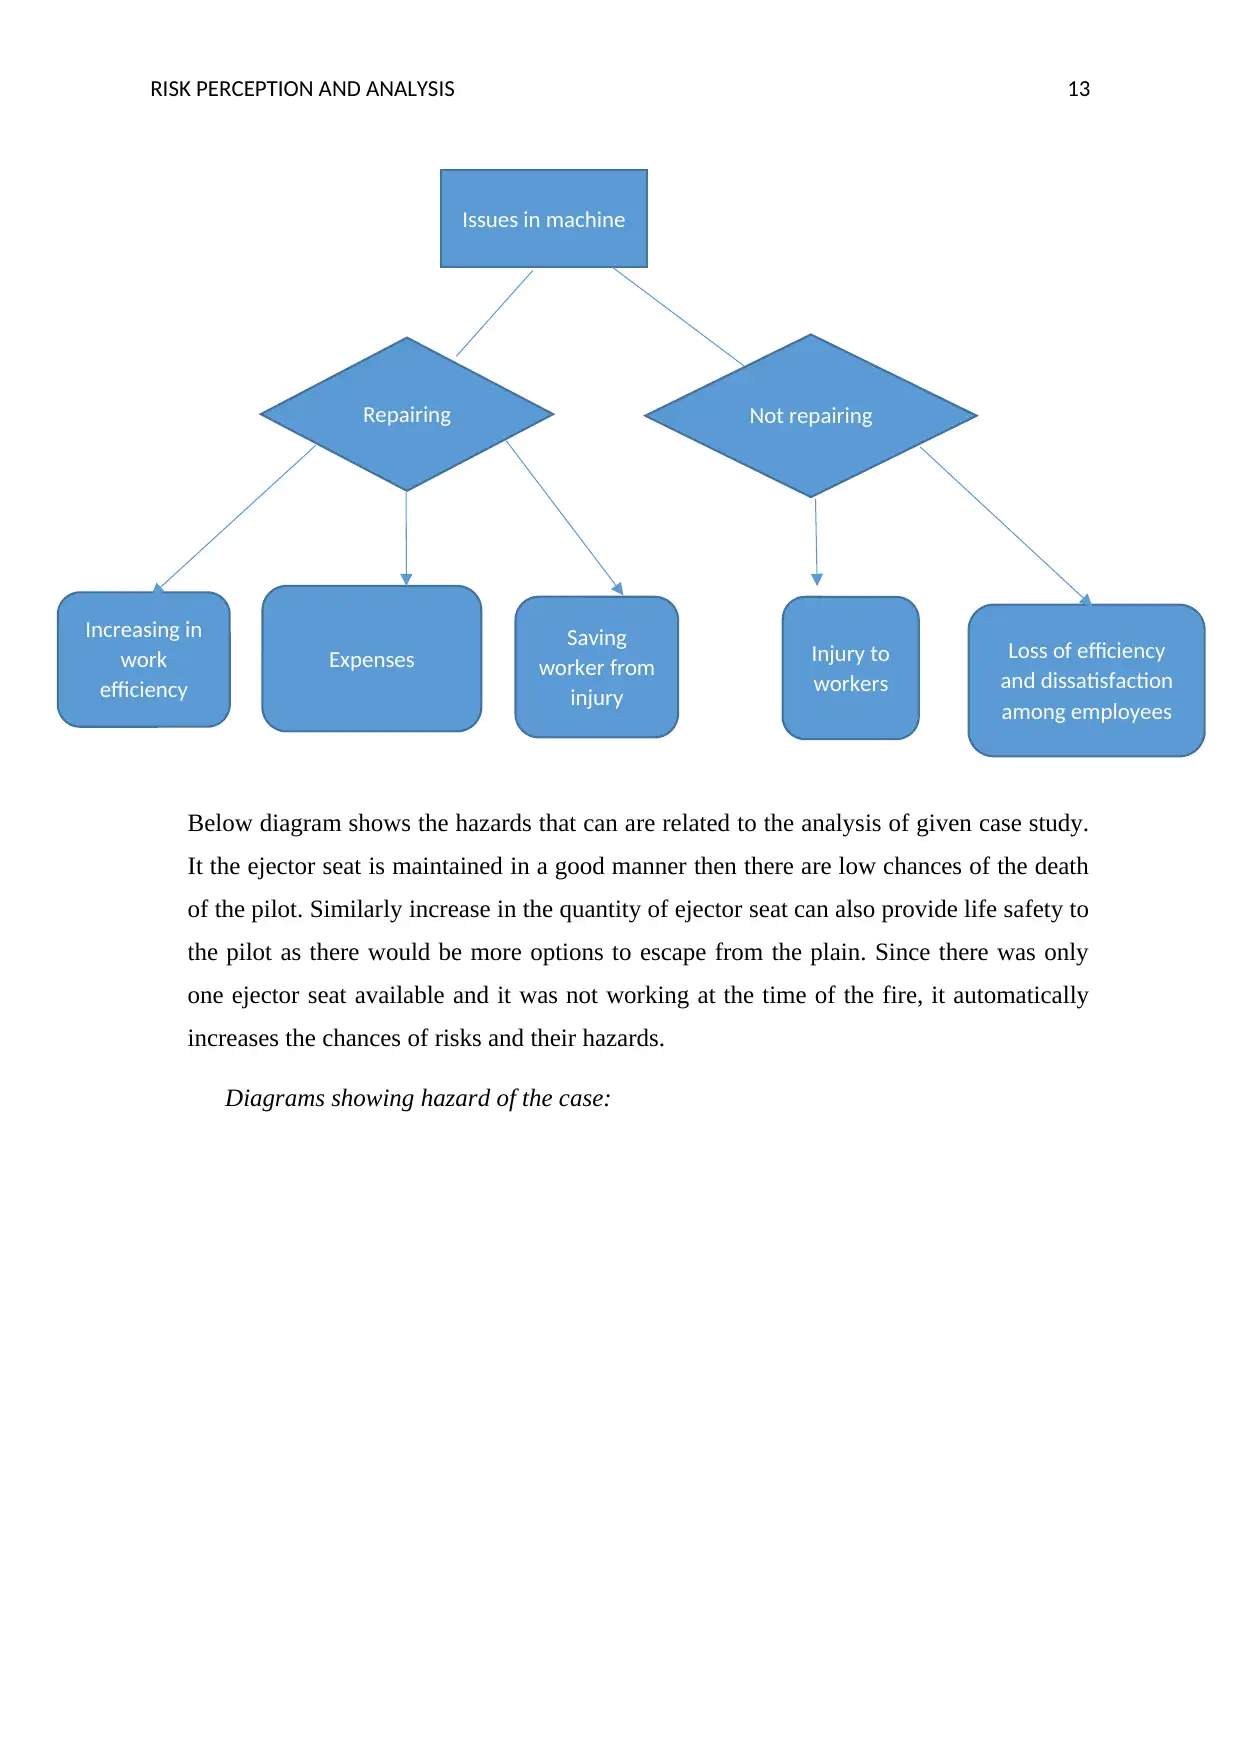
Below diagram shows the hazards that can are related to the analysis of given case study.
It the ejector seat is maintained in a good manner then there are low chances of the death
of the pilot. Similarly increase in the quantity of ejector seat can also provide life safety to
the pilot as there would be more options to escape from the plain. Since there was only
one ejector seat available and it was not working at the time of the fire, it automatically
increases the chances of risks and their hazards.
Diagrams showing hazard of the case:
Issues in machine
Repairing Not repairing
Increasing in
work
efficiency
Expenses Injury to
workers
Saving
worker from
injury
Loss of efficiency
and dissatisfaction
among employees
RISK PERCEPTION AND ANALYSIS 14
RISK PERCEPTION AND ANALYSIS 15
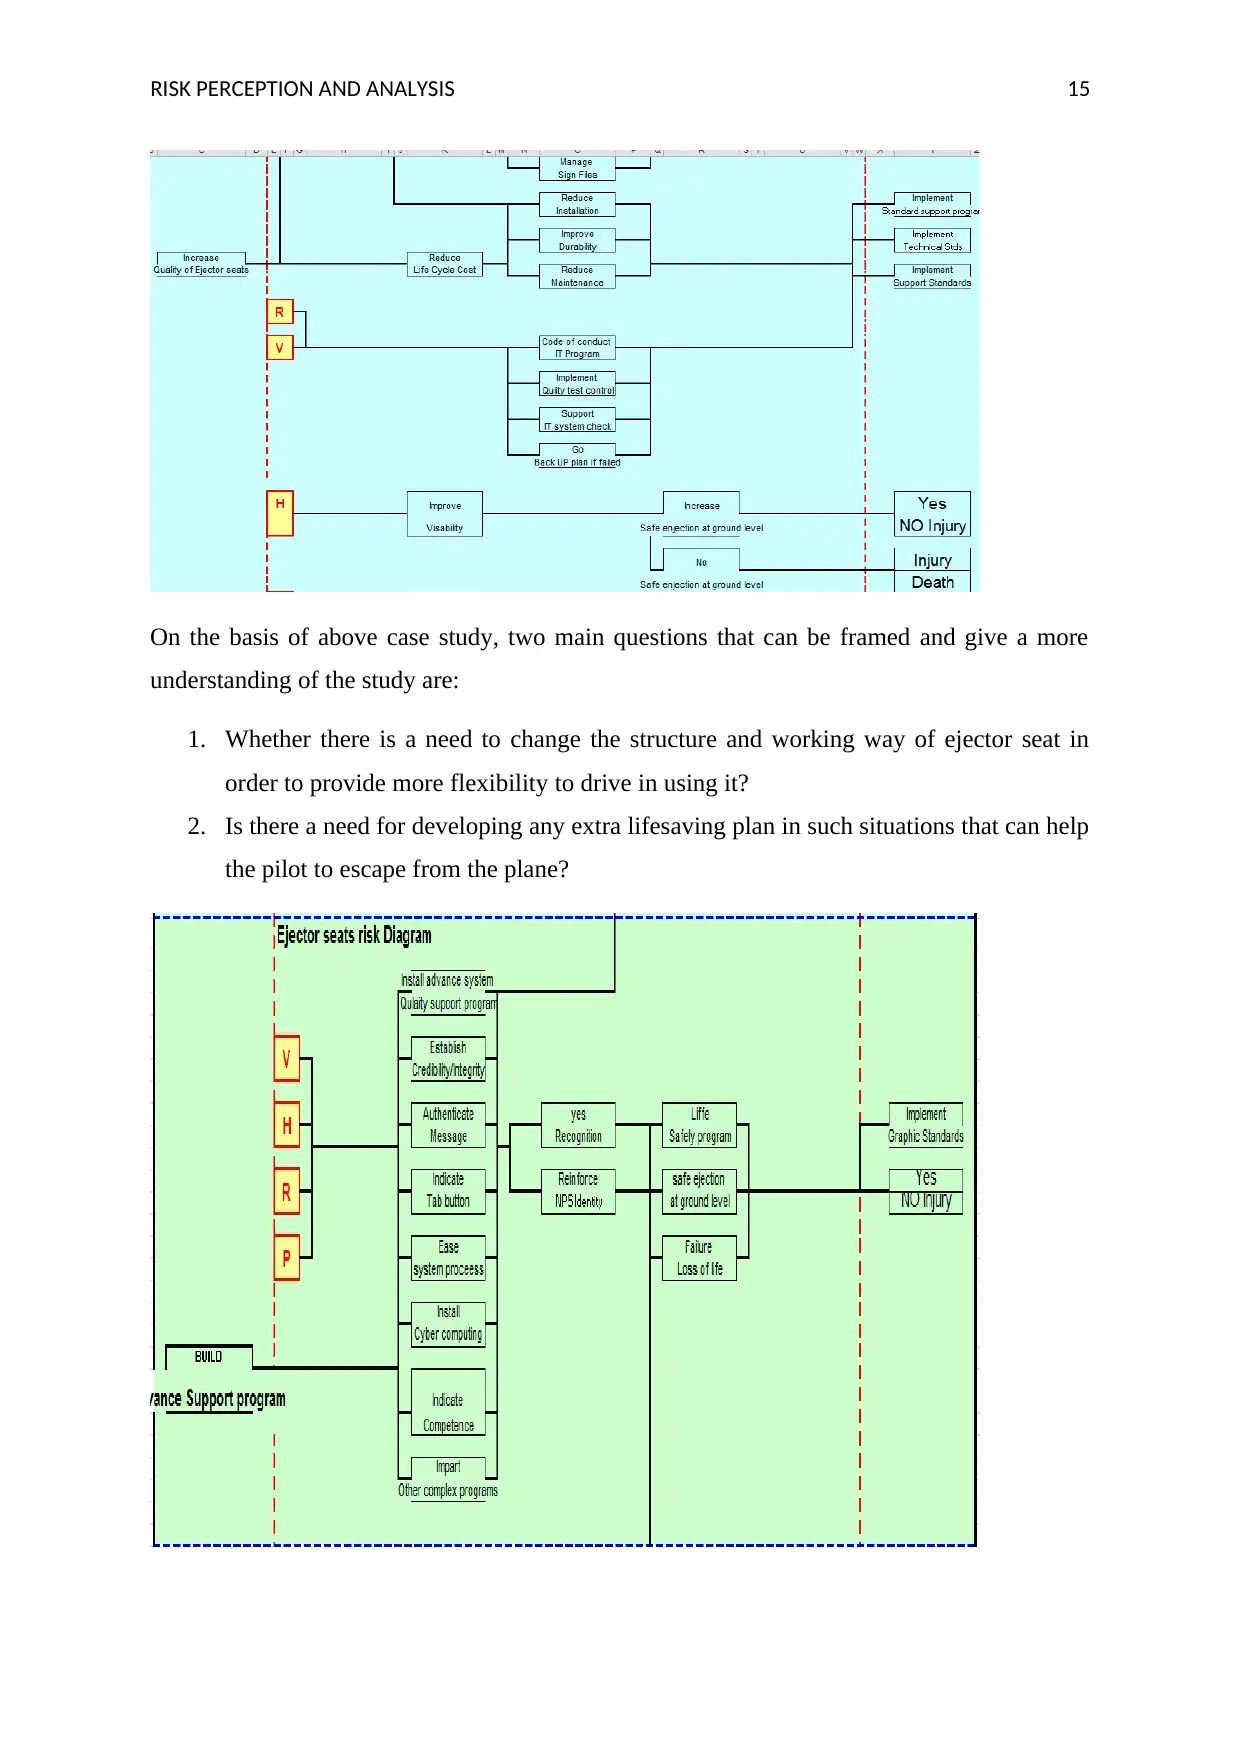
On the basis of above case study, two main questions that can be framed and give a more
understanding of the study are:
1. Whether there is a need to change the structure and working way of ejector seat in
order to provide more flexibility to drive in using it?
2. Is there a need for developing any extra lifesaving plan in such situations that can help
the pilot to escape from the plane?
Secure Best Marks with AI Grader
Need help grading? Try our AI Grader for instant feedback on your assignments.
RISK PERCEPTION AND ANALYSIS 16
RISK PERCEPTION AND ANALYSIS 17
References
Amoako, R. & Suglo, R. S., 2015. Assessment of Safety Management Practices at Ankonam
Boafo Mine. International Journal of Science, Environment, 4(6), pp. 1442-1456.
AON, 2018. Aon Property Laser: An Innovative Approach to TCOR Management. [Online]
Available at: http://www.aon.com/property-laser/
[Accessed 22 May 2018].
Dumbrava, V. & Lacob, V. S., 2013. Using Probability – Impact Matrix in Analysis and Risk
Assessment Projects. Journal of Knowledge Management, Economics and Information
Technology, Volume 42, pp. 76-96.
Garrick, B. & Gekler, W. C., 2013. The Analysis, Communication, and Perception of Risk.
Berlin: Springer Science & Business Media.
Health, A. G. D. o., 2017. Risk assessment of chemicals: assessment of exposure from all
sources. [Online]
Available at: https://www.nicnas.gov.au/notify-your-chemical/assessment-methodologies/
risk-assessment-of-chemicals-assessment-of-exposure-from-all-sources
[Accessed 22 May 2018].
Junior, R. R. & Carvalho, M. M. d., 2013. Understanding the Impact of Project Risk
Management on Project Performance: an Empirical Study. Journal of Technology
Management and Innovation, Volume 8, pp. 68-78.
Khameneh, A. H., Taheri, A. & Ershadi, M., 2016. Offering a framework for evaluating the
performance of project risk management system. Procedia Social and Behavioural Sciences,
Volume 226, pp. 82-90.
Kilubi, I., 2016. The strategies of supply chain risk management – a synthesis and
classification. International Journal of Logistics Research and Applications, 19(6), pp. 604-
629.
Landell, H., 2016. The Risk Matrix as a tool for risk analysis. [Online]
Available at: https://www.diva-portal.org/smash/get/diva2:944825/FULLTEXT01.pdf
[Accessed 22 May 2018].
RISK PERCEPTION AND ANALYSIS 18
Liu, Y., Ma, Z., Lv, J. & Bi, J., 2016. Identifying sources and hazardous risks of heavy metals
in topsoils of rapidly urbanizing East China. Journal of Gepgraphical Sciences, 26(6), pp.
735-749.
Pickering, A. & Poowley, S., 2010. Risk Matrices: implied accuracy and false assumptions.
Journal of Health and safety Research & Practice, 2(1), pp. 9-16.
Talbot, J., 2017. What's right with risk matrices?. [Online]
Available at: http://www.juliantalbot.com/single-post/2018/07/31/Whats-right-with-risk-
matrices
[Accessed 22 May 2018].
Uzulans, J., 2015. Project Risk Register Analysis and Practical Conclusions. PM World
Journal , 4(6), pp. 1-9.
Viner, D., 2018. RISK MANAGEMENT PROGRAMS. RISK PERCEPTION AND
ANALYSIS , May(22), p. 2018.
Wall, K. D., 2011. The Trouble With Risk Matrices. [Online]
Available at:
https://pdfs.semanticscholar.org/f2be/55d4454451788fca458da018ac9b4b7953f8.pdf
[Accessed 22 May 2018].
Wissem, E., 2013. Risk management: New Literature Review. Polish Journal of
Management Studies, Volume 8, pp. 289-297.
1 out of 19
Related Documents


Your All-in-One AI-Powered Toolkit for Academic Success.
+13062052269
info@desklib.com
Available 24*7 on WhatsApp / Email
![[object Object]](/_next/static/media/star-bottom.7253800d.svg)
Unlock your academic potential
© 2024 | Zucol Services PVT LTD | All rights reserved.