Analysis of Financial Performance and Cash Flow of Ryanair
Added on 2023-06-13
14 Pages3565 Words134 Views
Running head: ADVANCED REPORTING
Advance reporting
Name of the student
Name of the university
Student ID
Author note
Advance reporting
Name of the student
Name of the university
Student ID
Author note
1ADVANCED REPORTING
Table of Contents
Introduction................................................................................................................................2
1. Analysis of financial performance......................................................................................2
1. Analysis of cash flow, operating profit and earnings per share..........................................8
2. Potential investment review................................................................................................9
3. Overall conclusion..............................................................................................................9
Reference..................................................................................................................................11
Appendix..................................................................................................................................12
2ADVANCED REPORTING
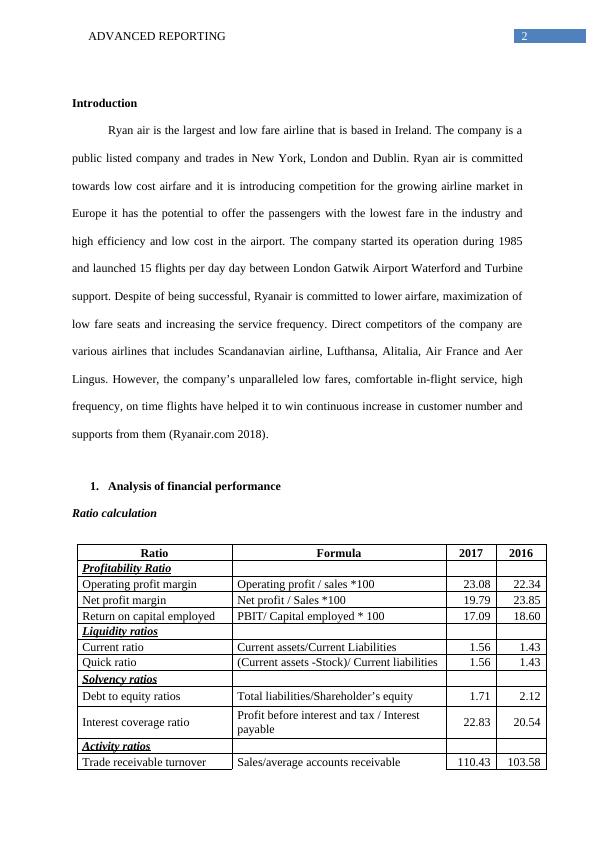
Introduction
Ryan air is the largest and low fare airline that is based in Ireland. The company is a
public listed company and trades in New York, London and Dublin. Ryan air is committed
towards low cost airfare and it is introducing competition for the growing airline market in
Europe it has the potential to offer the passengers with the lowest fare in the industry and
high efficiency and low cost in the airport. The company started its operation during 1985
and launched 15 flights per day day between London Gatwik Airport Waterford and Turbine
support. Despite of being successful, Ryanair is committed to lower airfare, maximization of
low fare seats and increasing the service frequency. Direct competitors of the company are
various airlines that includes Scandanavian airline, Lufthansa, Alitalia, Air France and Aer
Lingus. However, the company’s unparalleled low fares, comfortable in-flight service, high
frequency, on time flights have helped it to win continuous increase in customer number and
supports from them (Ryanair.com 2018).
1. Analysis of financial performance
Ratio calculation
Ratio Formula 2017 2016
Profitability Ratio
Operating profit margin Operating profit / sales *100 23.08 22.34
Net profit margin Net profit / Sales *100 19.79 23.85
Return on capital employed PBIT/ Capital employed * 100 17.09 18.60
Liquidity ratios
Current ratio Current assets/Current Liabilities 1.56 1.43
Quick ratio (Current assets -Stock)/ Current liabilities 1.56 1.43
Solvency ratios
Debt to equity ratios Total liabilities/Shareholder’s equity 1.71 2.12
Interest coverage ratio Profit before interest and tax / Interest
payable 22.83 20.54
Activity ratios
Trade receivable turnover Sales/average accounts receivable 110.43 103.58
3ADVANCED REPORTING
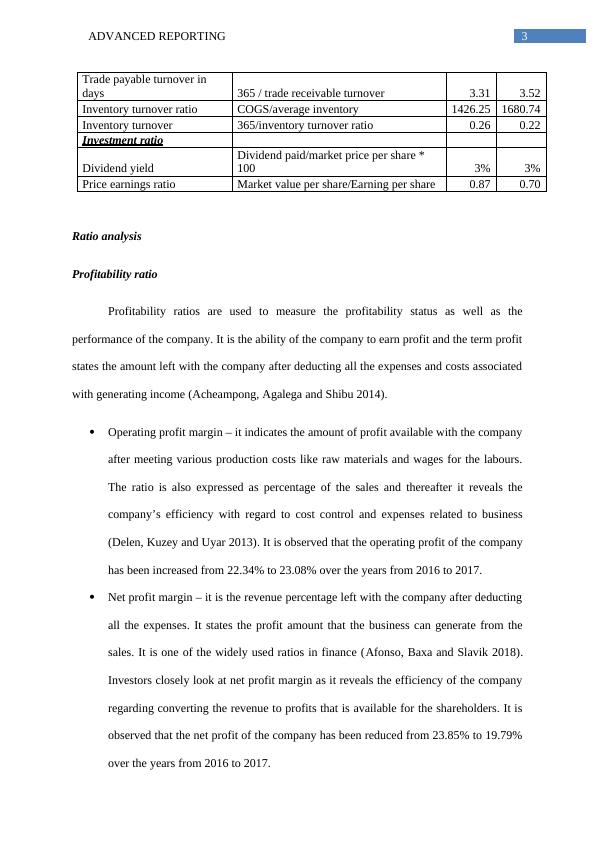
Trade payable turnover in
days 365 / trade receivable turnover 3.31 3.52
Inventory turnover ratio COGS/average inventory 1426.25 1680.74
Inventory turnover 365/inventory turnover ratio 0.26 0.22
Investment ratio
Dividend yield
Dividend paid/market price per share *
100 3% 3%
Price earnings ratio Market value per share/Earning per share 0.87 0.70
Ratio analysis
Profitability ratio
Profitability ratios are used to measure the profitability status as well as the
performance of the company. It is the ability of the company to earn profit and the term profit
states the amount left with the company after deducting all the expenses and costs associated
with generating income (Acheampong, Agalega and Shibu 2014).
Operating profit margin – it indicates the amount of profit available with the company
after meeting various production costs like raw materials and wages for the labours.
The ratio is also expressed as percentage of the sales and thereafter it reveals the
company’s efficiency with regard to cost control and expenses related to business
(Delen, Kuzey and Uyar 2013). It is observed that the operating profit of the company
has been increased from 22.34% to 23.08% over the years from 2016 to 2017.
Net profit margin – it is the revenue percentage left with the company after deducting
all the expenses. It states the profit amount that the business can generate from the
sales. It is one of the widely used ratios in finance (Afonso, Baxa and Slavik 2018).
Investors closely look at net profit margin as it reveals the efficiency of the company
regarding converting the revenue to profits that is available for the shareholders. It is
observed that the net profit of the company has been reduced from 23.85% to 19.79%
over the years from 2016 to 2017.
End of preview
Want to access all the pages? Upload your documents or become a member.
Related Documents
Financial Reporting Assignment - UNITE GROUPlg...
|13
|2912
|86
MOD003459 Financial Reporting for Businesseslg...
|15
|3422
|72
ASSESSMENT | FINANCIAL MANAGEMENTlg...
|9
|1381
|15
Analysis of Financial Performance of Easy Jetlg...
|13
|3936
|757
Principles of Financelg...
|6
|358
|75
Analysis of Operations with Accounting Ratiolg...
|14
|3361
|75