Customer Focus and Financial Performance: An Analysis
VerifiedAdded on 2019/09/24
|13
|2460
|179
Report
AI Summary
The provided content appears to be a case study on a customer-focused organization that provides high-quality products and excellent after-sales services, resulting in increased customer loyalty and retention. The organization has a budget of $30,500 for overheads, which is higher than its actual expenses. The profit margin is also higher than expected due to the focus on quality and customer satisfaction. Additionally, there are recommendations provided to increase customers by providing value, connecting with customers, collaborating between marketing and sales teams, and offering after-sales services. Furthermore, the content highlights various business and financial risks that an organization may face, including credit risk, profitability of sales, fixed cost investments, legal risks, and availability of raw materials.
Contribute Materials
Your contribution can guide someone’s learning journey. Share your
documents today.
Sales Management
1
1
Secure Best Marks with AI Grader
Need help grading? Try our AI Grader for instant feedback on your assignments.
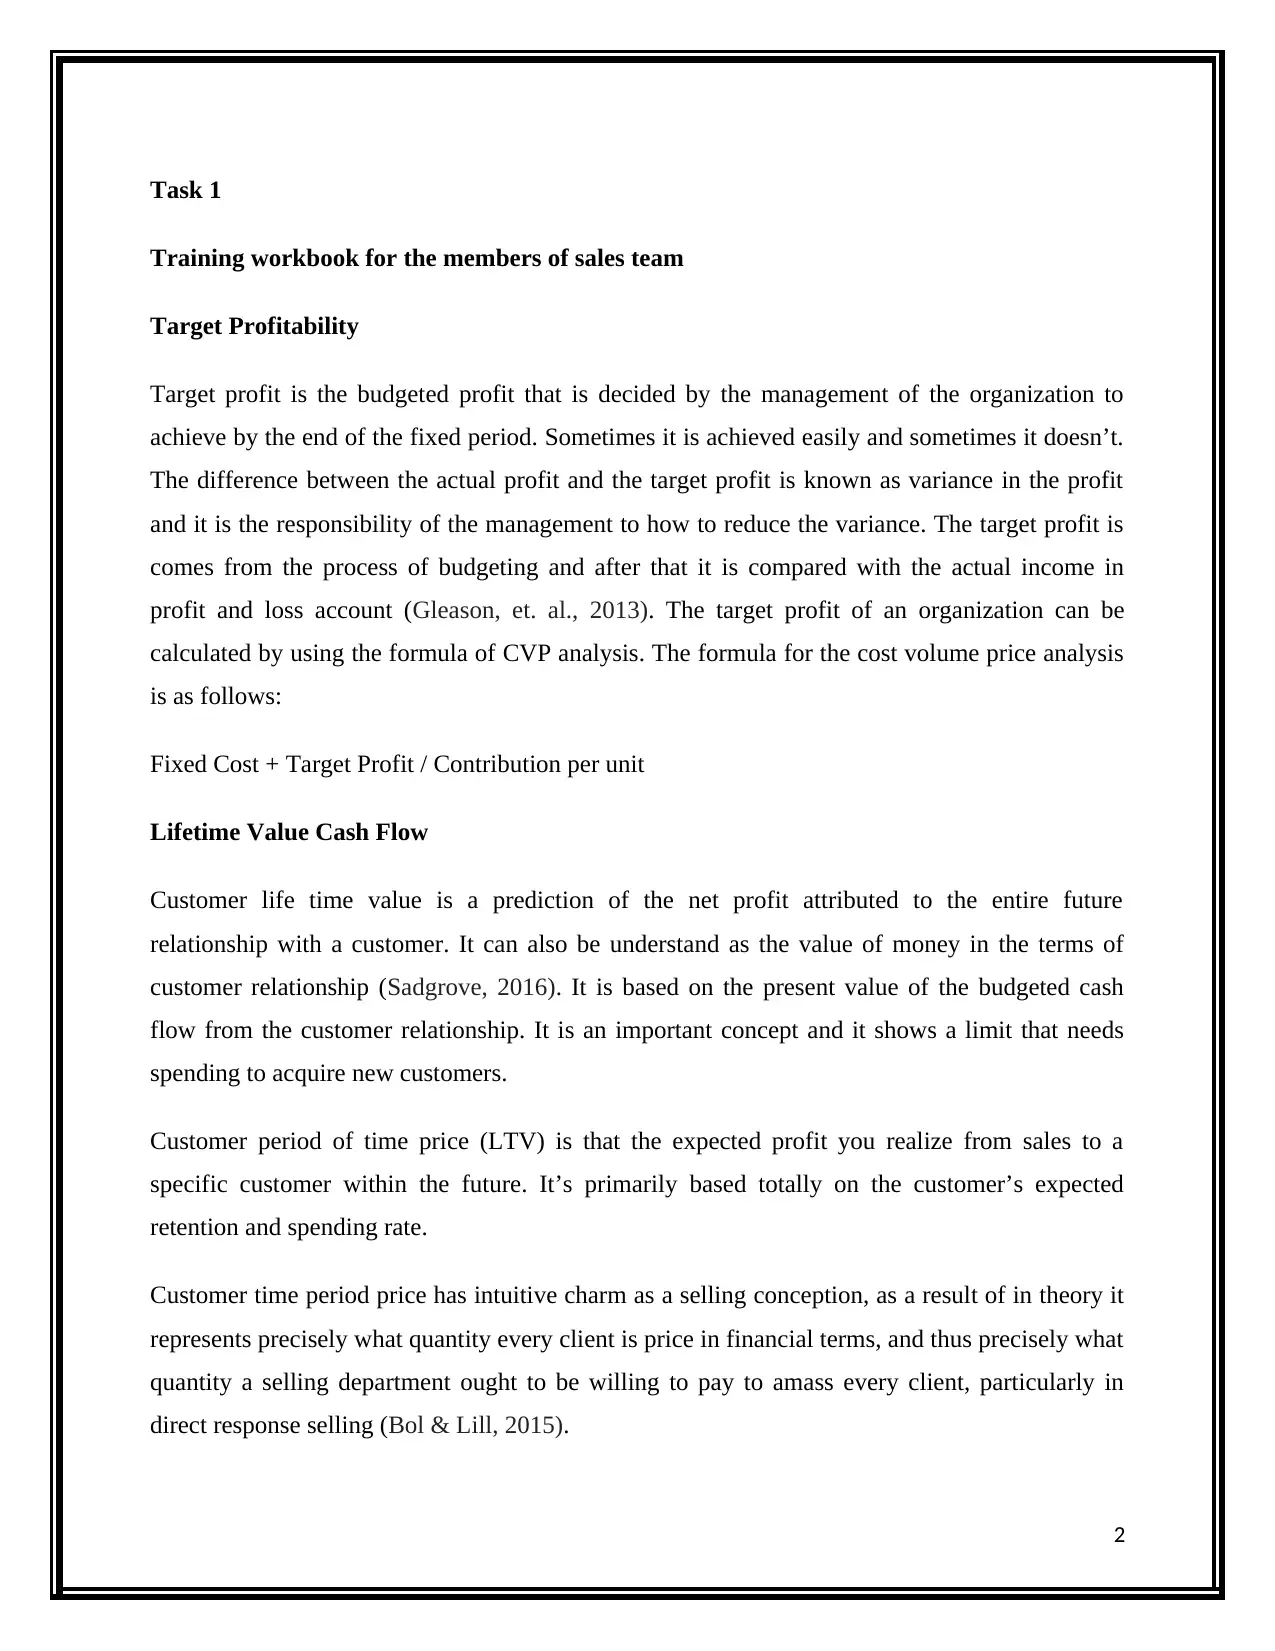
Task 1
Training workbook for the members of sales team
Target Profitability
Target profit is the budgeted profit that is decided by the management of the organization to
achieve by the end of the fixed period. Sometimes it is achieved easily and sometimes it doesn’t.
The difference between the actual profit and the target profit is known as variance in the profit
and it is the responsibility of the management to how to reduce the variance. The target profit is
comes from the process of budgeting and after that it is compared with the actual income in
profit and loss account (Gleason, et. al., 2013). The target profit of an organization can be
calculated by using the formula of CVP analysis. The formula for the cost volume price analysis
is as follows:
Fixed Cost + Target Profit / Contribution per unit
Lifetime Value Cash Flow
Customer life time value is a prediction of the net profit attributed to the entire future
relationship with a customer. It can also be understand as the value of money in the terms of
customer relationship (Sadgrove, 2016). It is based on the present value of the budgeted cash
flow from the customer relationship. It is an important concept and it shows a limit that needs
spending to acquire new customers.
Customer period of time price (LTV) is that the expected profit you realize from sales to a
specific customer within the future. It’s primarily based totally on the customer’s expected
retention and spending rate.
Customer time period price has intuitive charm as a selling conception, as a result of in theory it
represents precisely what quantity every client is price in financial terms, and thus precisely what
quantity a selling department ought to be willing to pay to amass every client, particularly in
direct response selling (Bol & Lill, 2015).
2
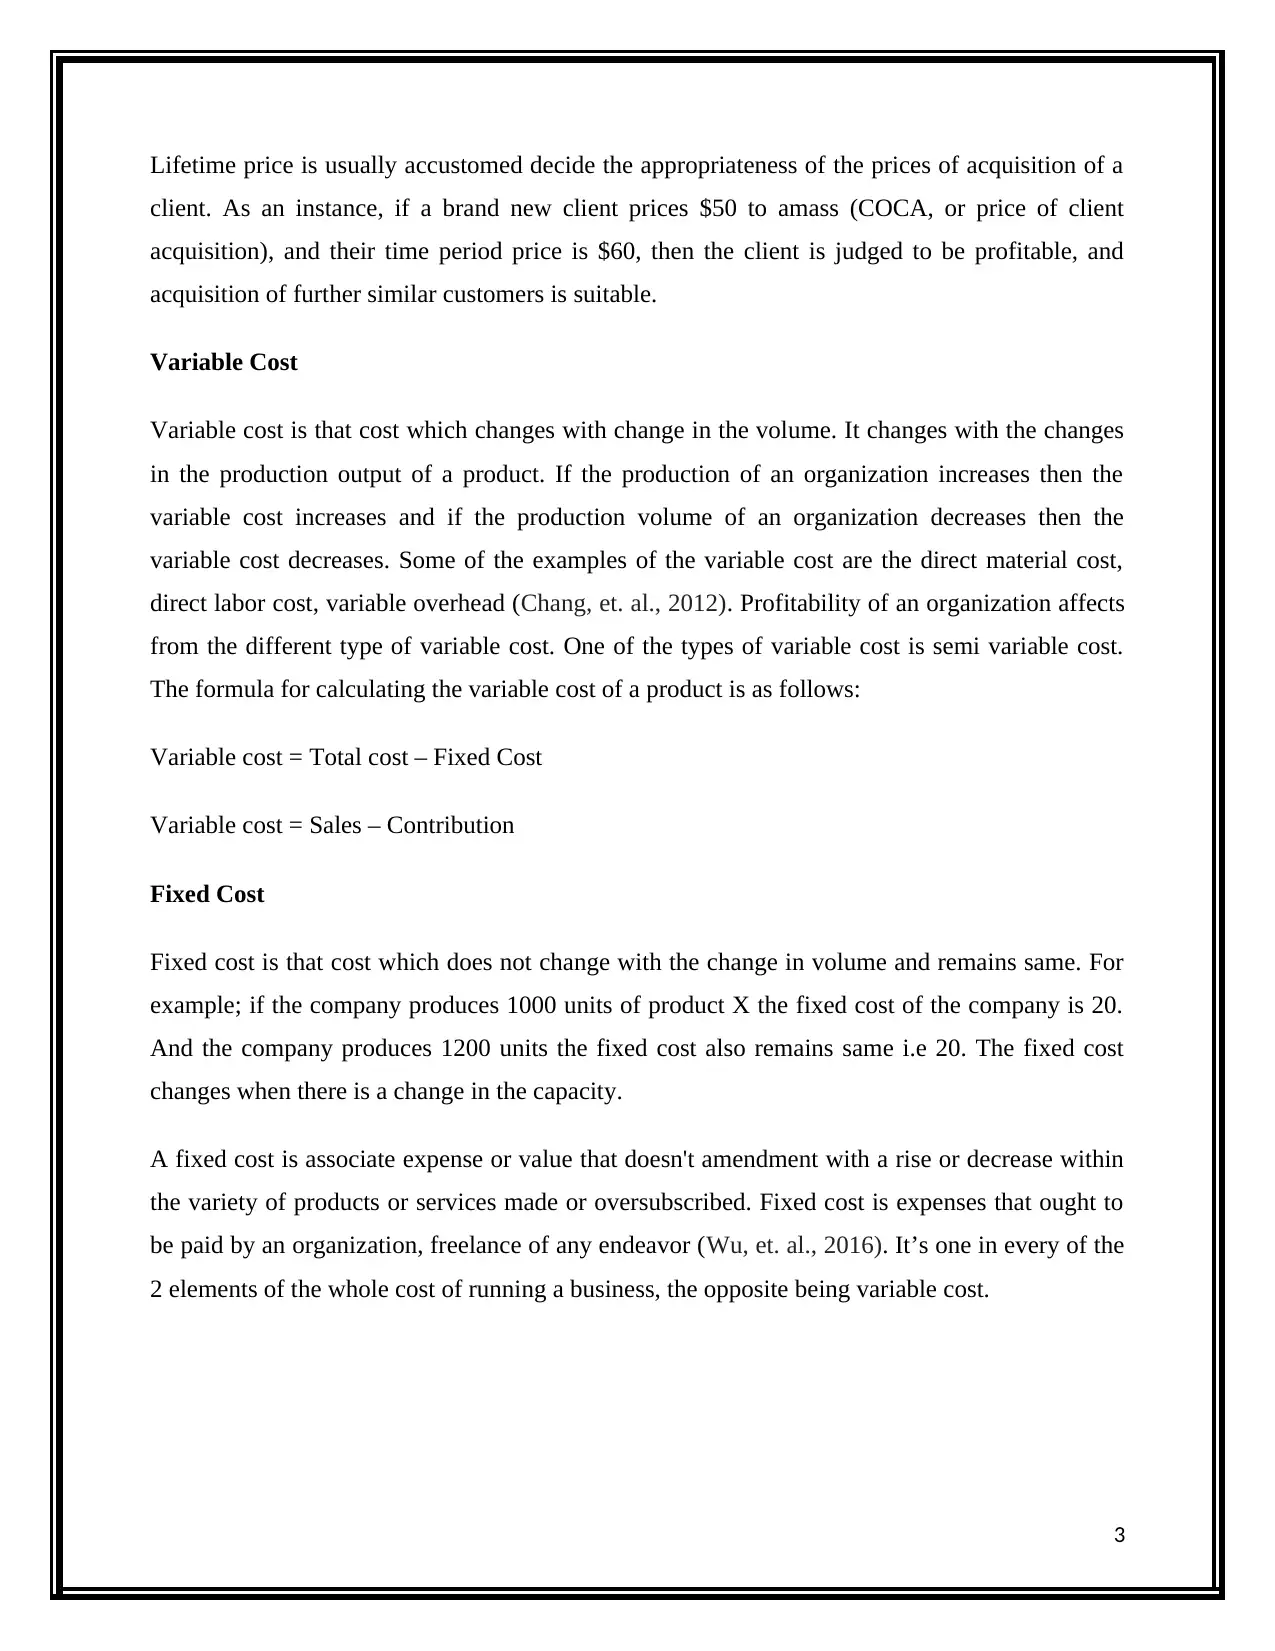
Lifetime price is usually accustomed decide the appropriateness of the prices of acquisition of a
client. As an instance, if a brand new client prices $50 to amass (COCA, or price of client
acquisition), and their time period price is $60, then the client is judged to be profitable, and
acquisition of further similar customers is suitable.
Variable Cost
Variable cost is that cost which changes with change in the volume. It changes with the changes
in the production output of a product. If the production of an organization increases then the
variable cost increases and if the production volume of an organization decreases then the
variable cost decreases. Some of the examples of the variable cost are the direct material cost,
direct labor cost, variable overhead (Chang, et. al., 2012). Profitability of an organization affects
from the different type of variable cost. One of the types of variable cost is semi variable cost.
The formula for calculating the variable cost of a product is as follows:
Variable cost = Total cost – Fixed Cost
Variable cost = Sales – Contribution
Fixed Cost
Fixed cost is that cost which does not change with the change in volume and remains same. For
example; if the company produces 1000 units of product X the fixed cost of the company is 20.
And the company produces 1200 units the fixed cost also remains same i.e 20. The fixed cost
changes when there is a change in the capacity.
A fixed cost is associate expense or value that doesn't amendment with a rise or decrease within
the variety of products or services made or oversubscribed. Fixed cost is expenses that ought to
be paid by an organization, freelance of any endeavor (Wu, et. al., 2016). It’s one in every of the
2 elements of the whole cost of running a business, the opposite being variable cost.
3
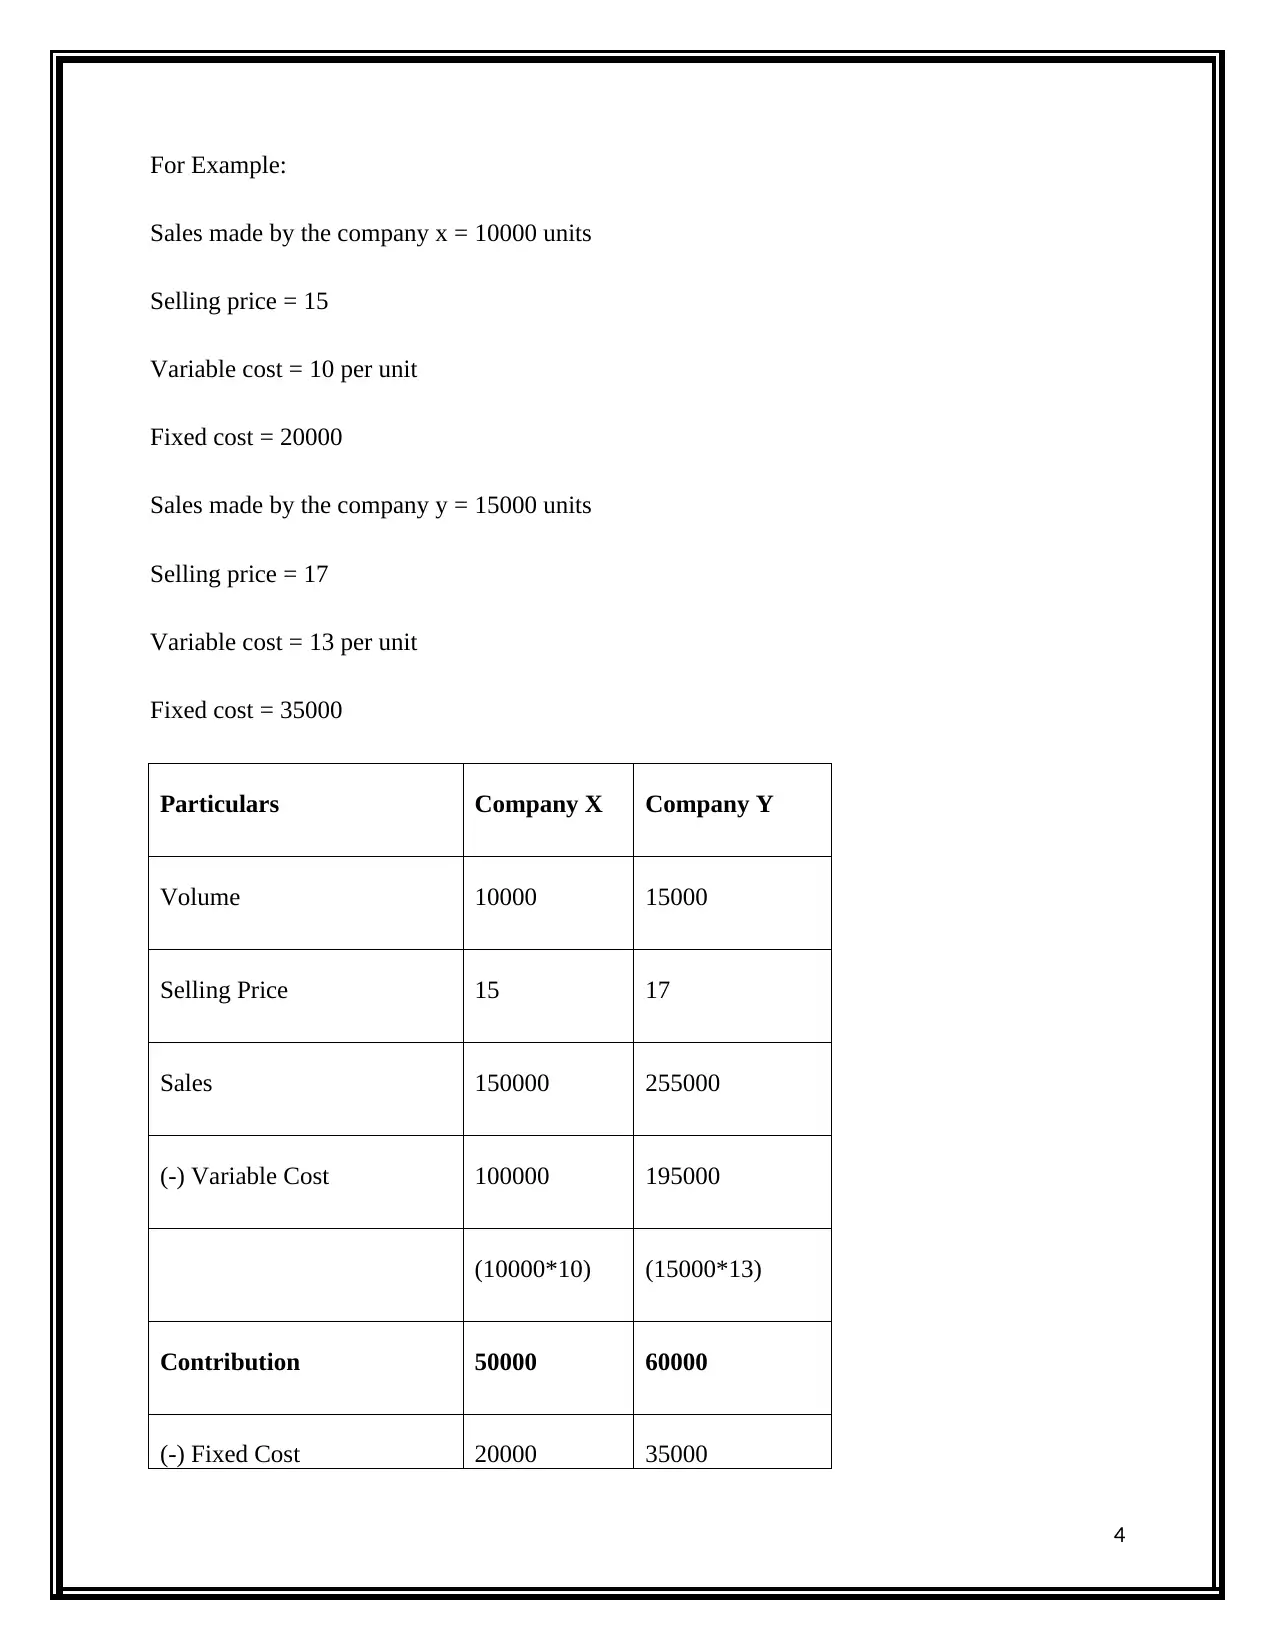
For Example:
Sales made by the company x = 10000 units
Selling price = 15
Variable cost = 10 per unit
Fixed cost = 20000
Sales made by the company y = 15000 units
Selling price = 17
Variable cost = 13 per unit
Fixed cost = 35000
Particulars Company X Company Y
Volume 10000 15000
Selling Price 15 17
Sales 150000 255000
(-) Variable Cost 100000 195000
(10000*10) (15000*13)
Contribution 50000 60000
(-) Fixed Cost 20000 35000
4
Paraphrase This Document
Need a fresh take? Get an instant paraphrase of this document with our AI Paraphraser
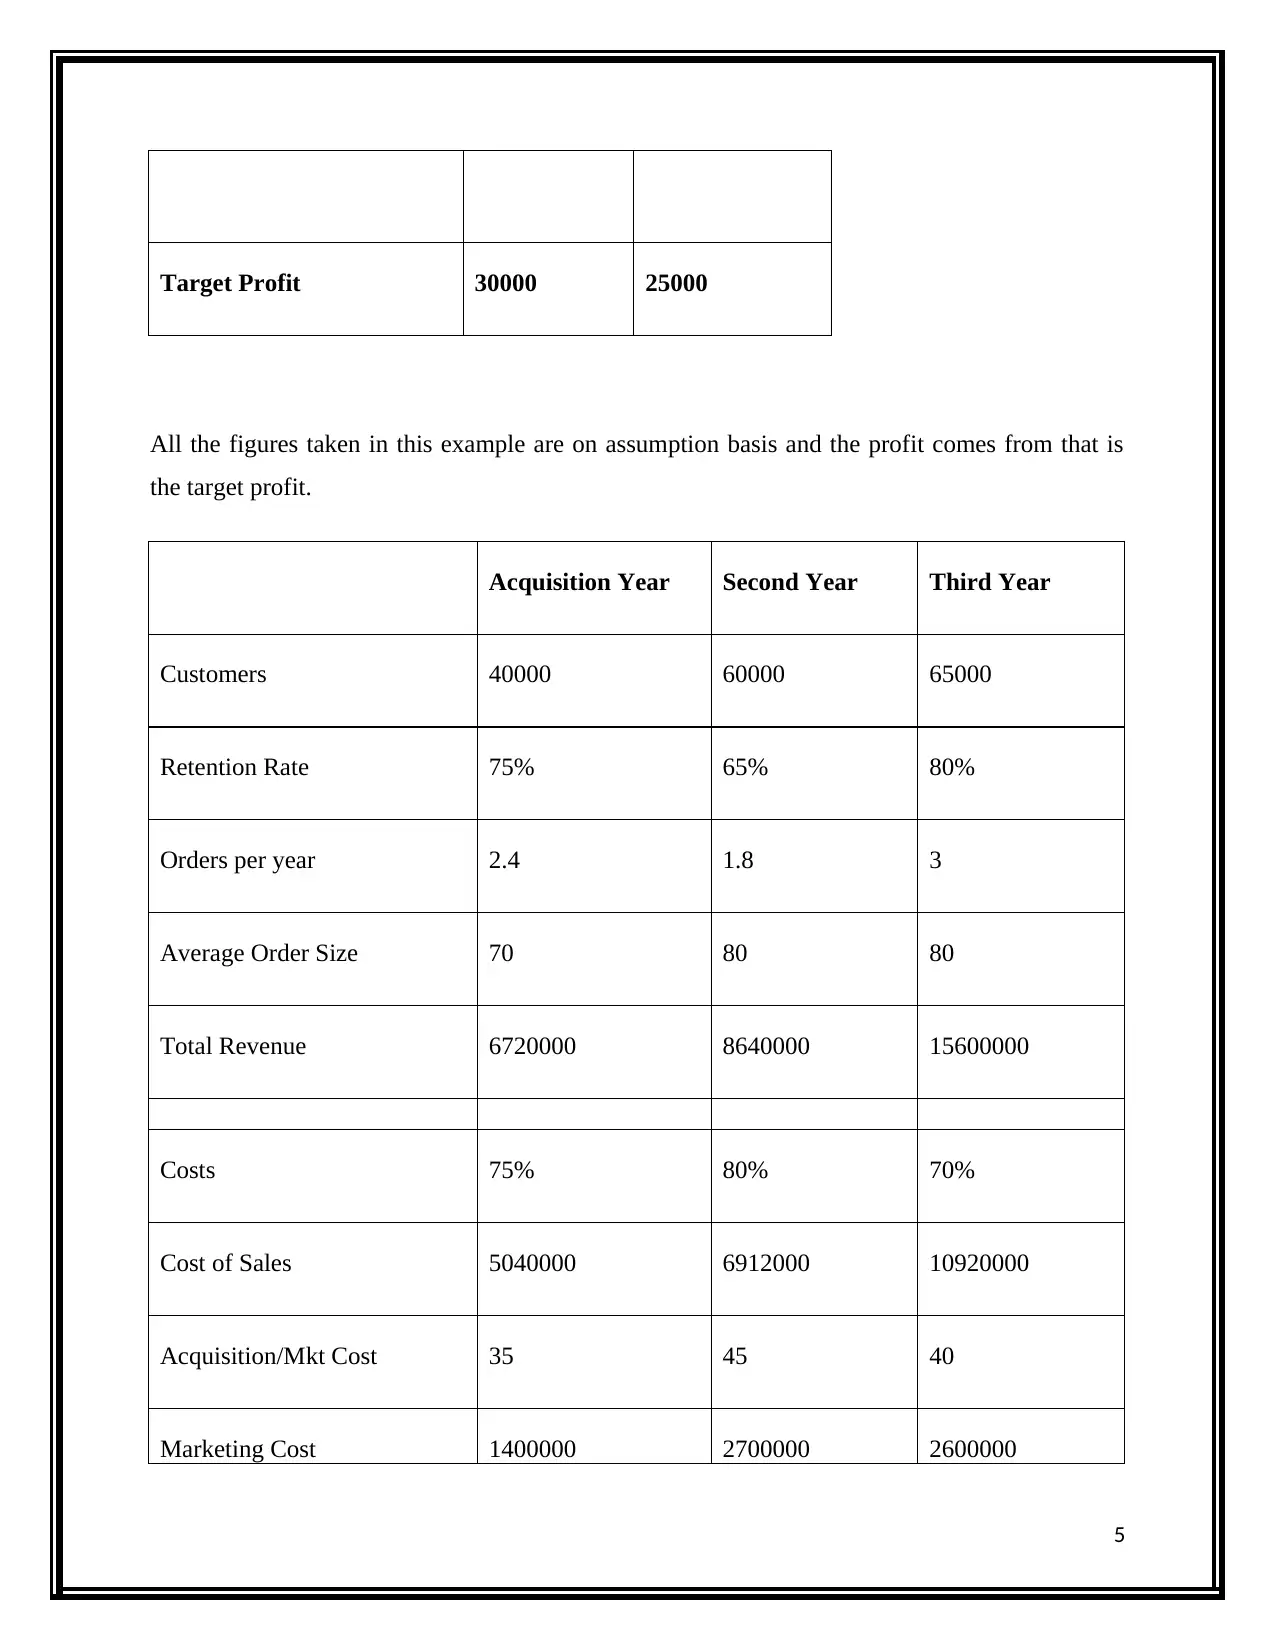
Target Profit 30000 25000
All the figures taken in this example are on assumption basis and the profit comes from that is
the target profit.
Acquisition Year Second Year Third Year
Customers 40000 60000 65000
Retention Rate 75% 65% 80%
Orders per year 2.4 1.8 3
Average Order Size 70 80 80
Total Revenue 6720000 8640000 15600000
Costs 75% 80% 70%
Cost of Sales 5040000 6912000 10920000
Acquisition/Mkt Cost 35 45 40
Marketing Cost 1400000 2700000 2600000
5
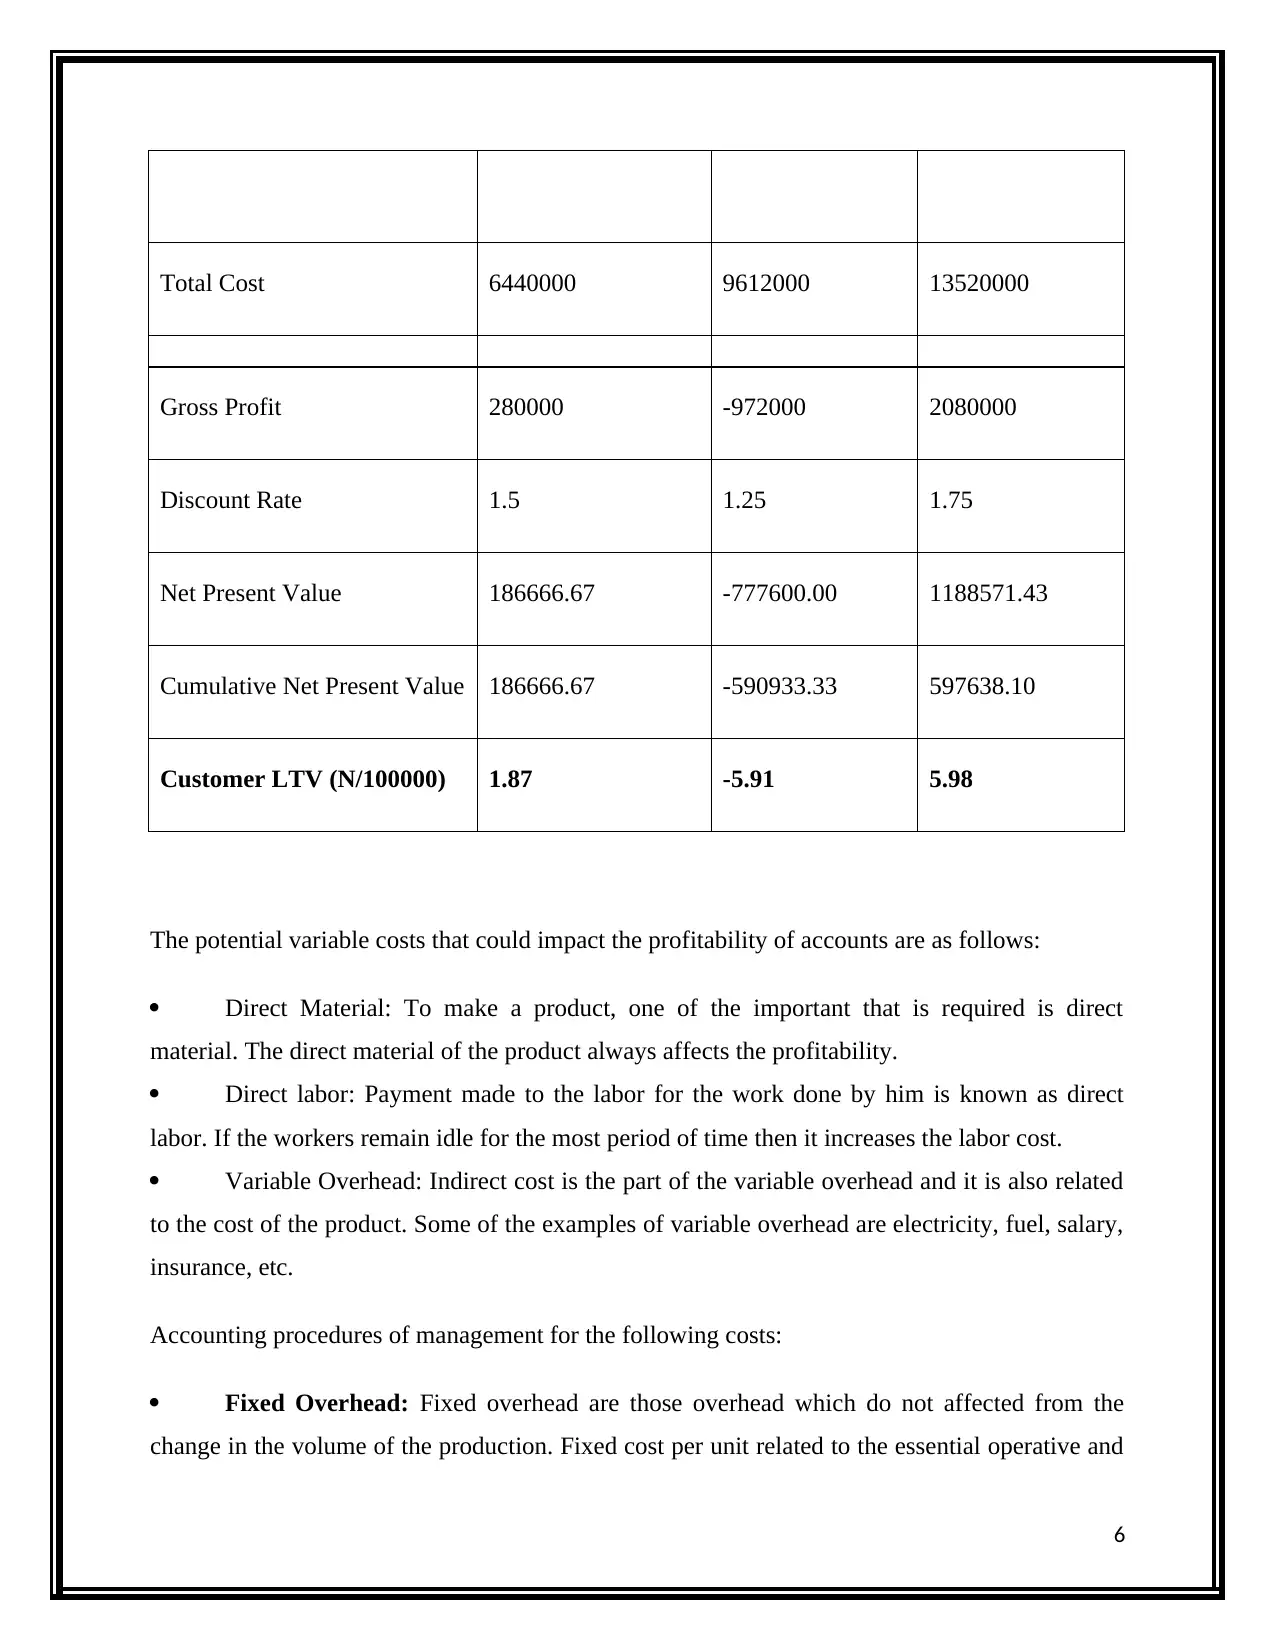
Total Cost 6440000 9612000 13520000
Gross Profit 280000 -972000 2080000
Discount Rate 1.5 1.25 1.75
Net Present Value 186666.67 -777600.00 1188571.43
Cumulative Net Present Value 186666.67 -590933.33 597638.10
Customer LTV (N/100000) 1.87 -5.91 5.98
The potential variable costs that could impact the profitability of accounts are as follows:
Direct Material: To make a product, one of the important that is required is direct
material. The direct material of the product always affects the profitability.
Direct labor: Payment made to the labor for the work done by him is known as direct
labor. If the workers remain idle for the most period of time then it increases the labor cost.
Variable Overhead: Indirect cost is the part of the variable overhead and it is also related
to the cost of the product. Some of the examples of variable overhead are electricity, fuel, salary,
insurance, etc.
Accounting procedures of management for the following costs:
Fixed Overhead: Fixed overhead are those overhead which do not affected from the
change in the volume of the production. Fixed cost per unit related to the essential operative and
6
overhead prices of a business (Tarasi, et. al., 2013). They embody things cherish building rent,
utilities, wages and insurance. Most kinds of depreciation and tangible assets qualify as fastened
prices moreover.
Fixed costs per unit thought of indirect cost of production. they're not prices incurred directly by
the assembly method, cherish elements required for assembly, however they still issue into total
production costs; for there to be production, the business has got to be functioning and
operational, and stuck costs represent those necessary operative costs.
"Fixed" during this context doesn't mean utterly unchangeable, solely that the cost don't typically
amendment supported production levels or revenue (Saeidi, et. al., 2015). However, increasing
prices amendment somewhat over time as a corporation makes changes or expands and
consequently hires extra personnel or acquires new facilities.
Administrative Support: Administrative workers are worked at official levels and
support the company. It includes the management, answering phones, speaking with clients. The
management of the company held liable for all the works done by them. They are responsible to
manage the administrative work of the company and achieve the objectives set by them.
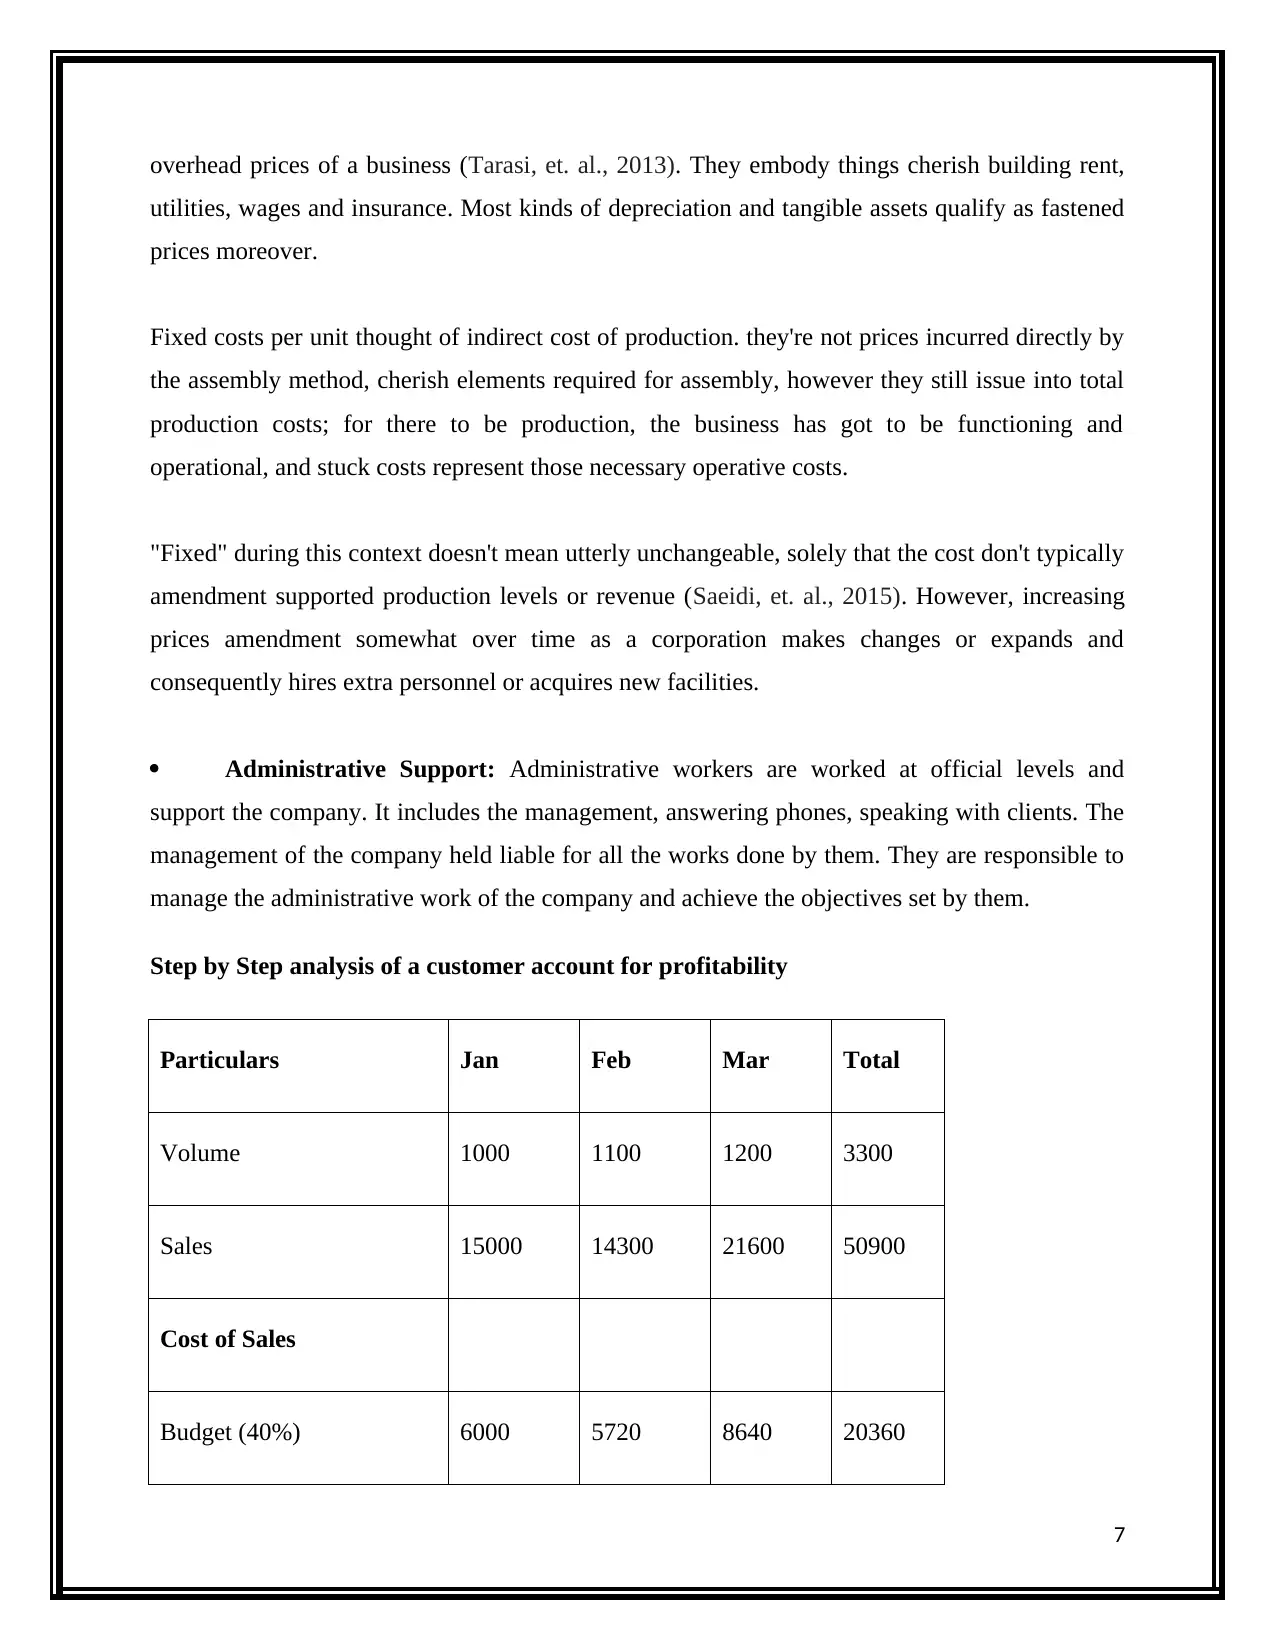
Step by Step analysis of a customer account for profitability
Particulars Jan Feb Mar Total
Volume 1000 1100 1200 3300
Sales 15000 14300 21600 50900
Cost of Sales
Budget (40%) 6000 5720 8640 20360
7
utilities, wages and insurance. Most kinds of depreciation and tangible assets qualify as fastened
prices moreover.
Fixed costs per unit thought of indirect cost of production. they're not prices incurred directly by
the assembly method, cherish elements required for assembly, however they still issue into total
production costs; for there to be production, the business has got to be functioning and
operational, and stuck costs represent those necessary operative costs.
"Fixed" during this context doesn't mean utterly unchangeable, solely that the cost don't typically
amendment supported production levels or revenue (Saeidi, et. al., 2015). However, increasing
prices amendment somewhat over time as a corporation makes changes or expands and
consequently hires extra personnel or acquires new facilities.
Administrative Support: Administrative workers are worked at official levels and
support the company. It includes the management, answering phones, speaking with clients. The
management of the company held liable for all the works done by them. They are responsible to
manage the administrative work of the company and achieve the objectives set by them.
Step by Step analysis of a customer account for profitability
Particulars Jan Feb Mar Total
Volume 1000 1100 1200 3300
Sales 15000 14300 21600 50900
Cost of Sales
Budget (40%) 6000 5720 8640 20360
7
Secure Best Marks with AI Grader
Need help grading? Try our AI Grader for instant feedback on your assignments.
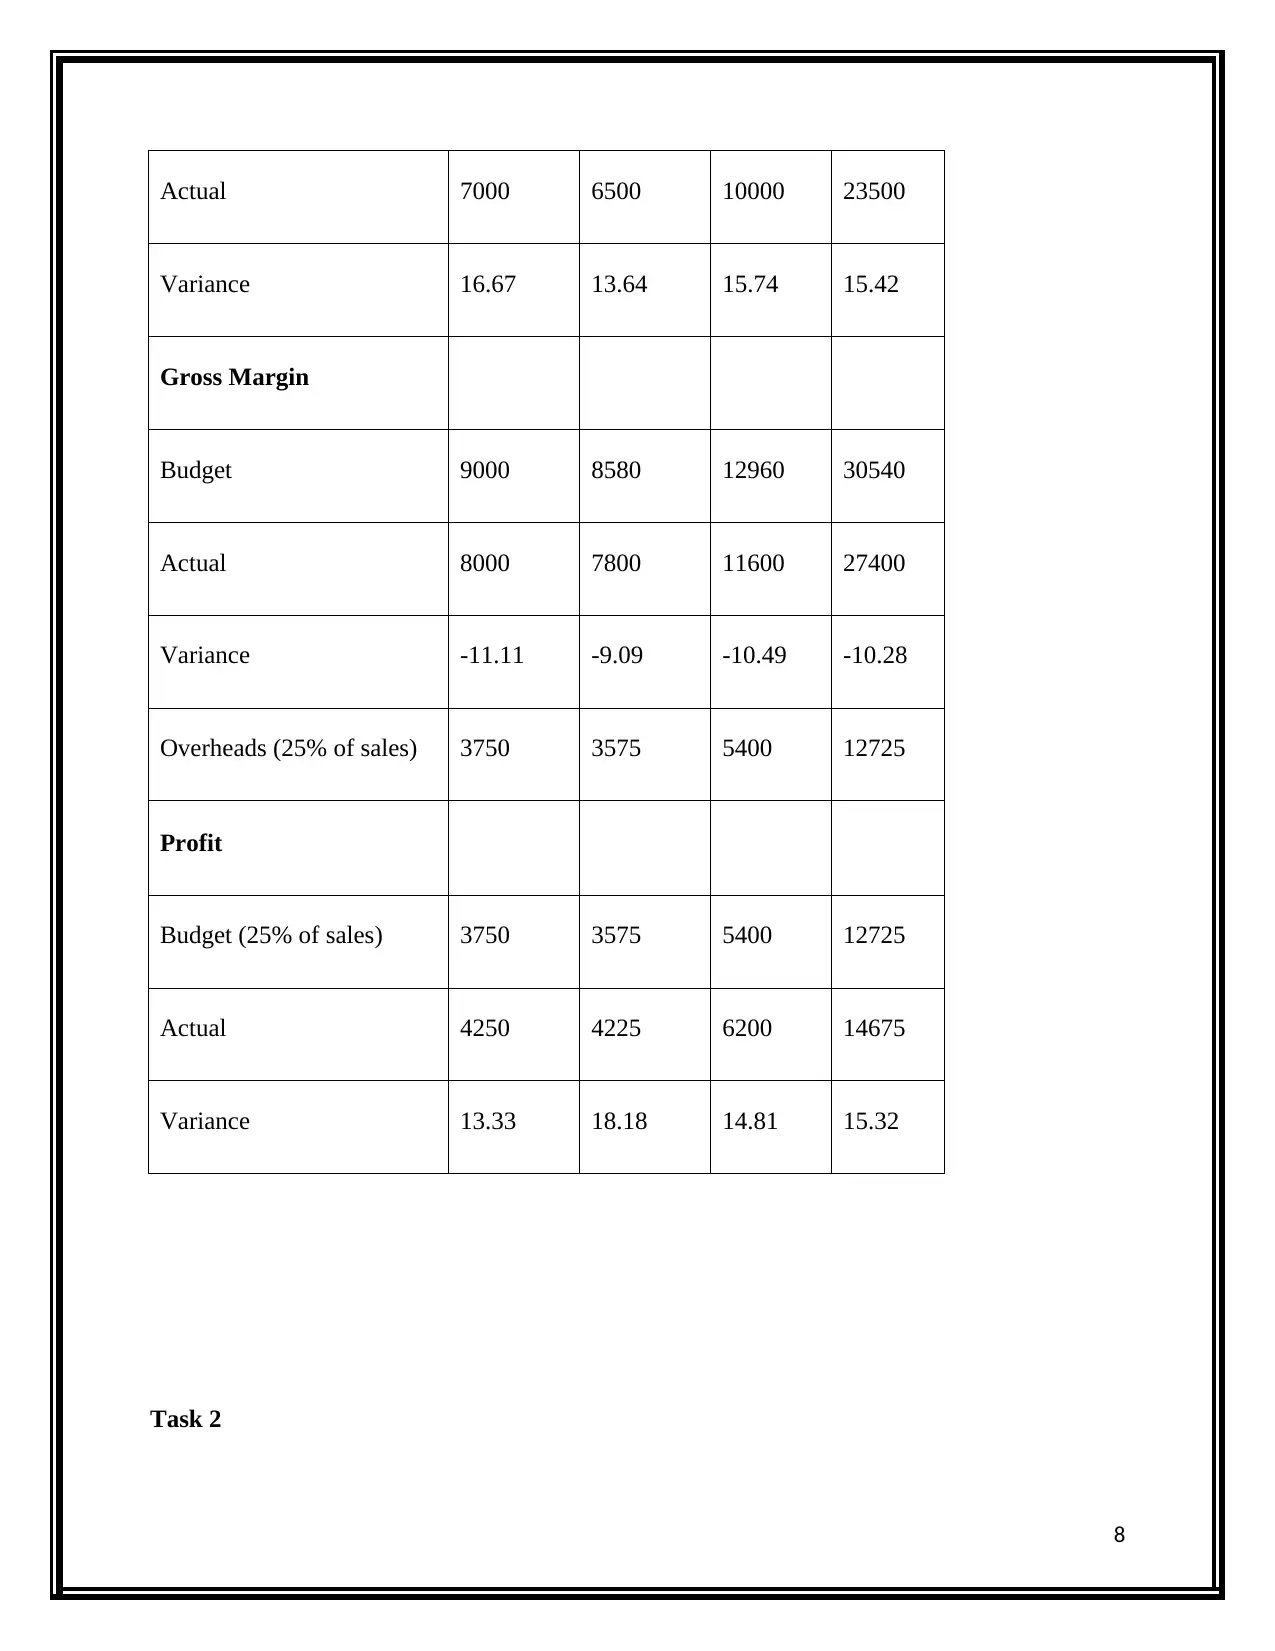
Actual 7000 6500 10000 23500
Variance 16.67 13.64 15.74 15.42
Gross Margin
Budget 9000 8580 12960 30540
Actual 8000 7800 11600 27400
Variance -11.11 -9.09 -10.49 -10.28
Overheads (25% of sales) 3750 3575 5400 12725
Profit
Budget (25% of sales) 3750 3575 5400 12725
Actual 4250 4225 6200 14675
Variance 13.33 18.18 14.81 15.32
Task 2
8
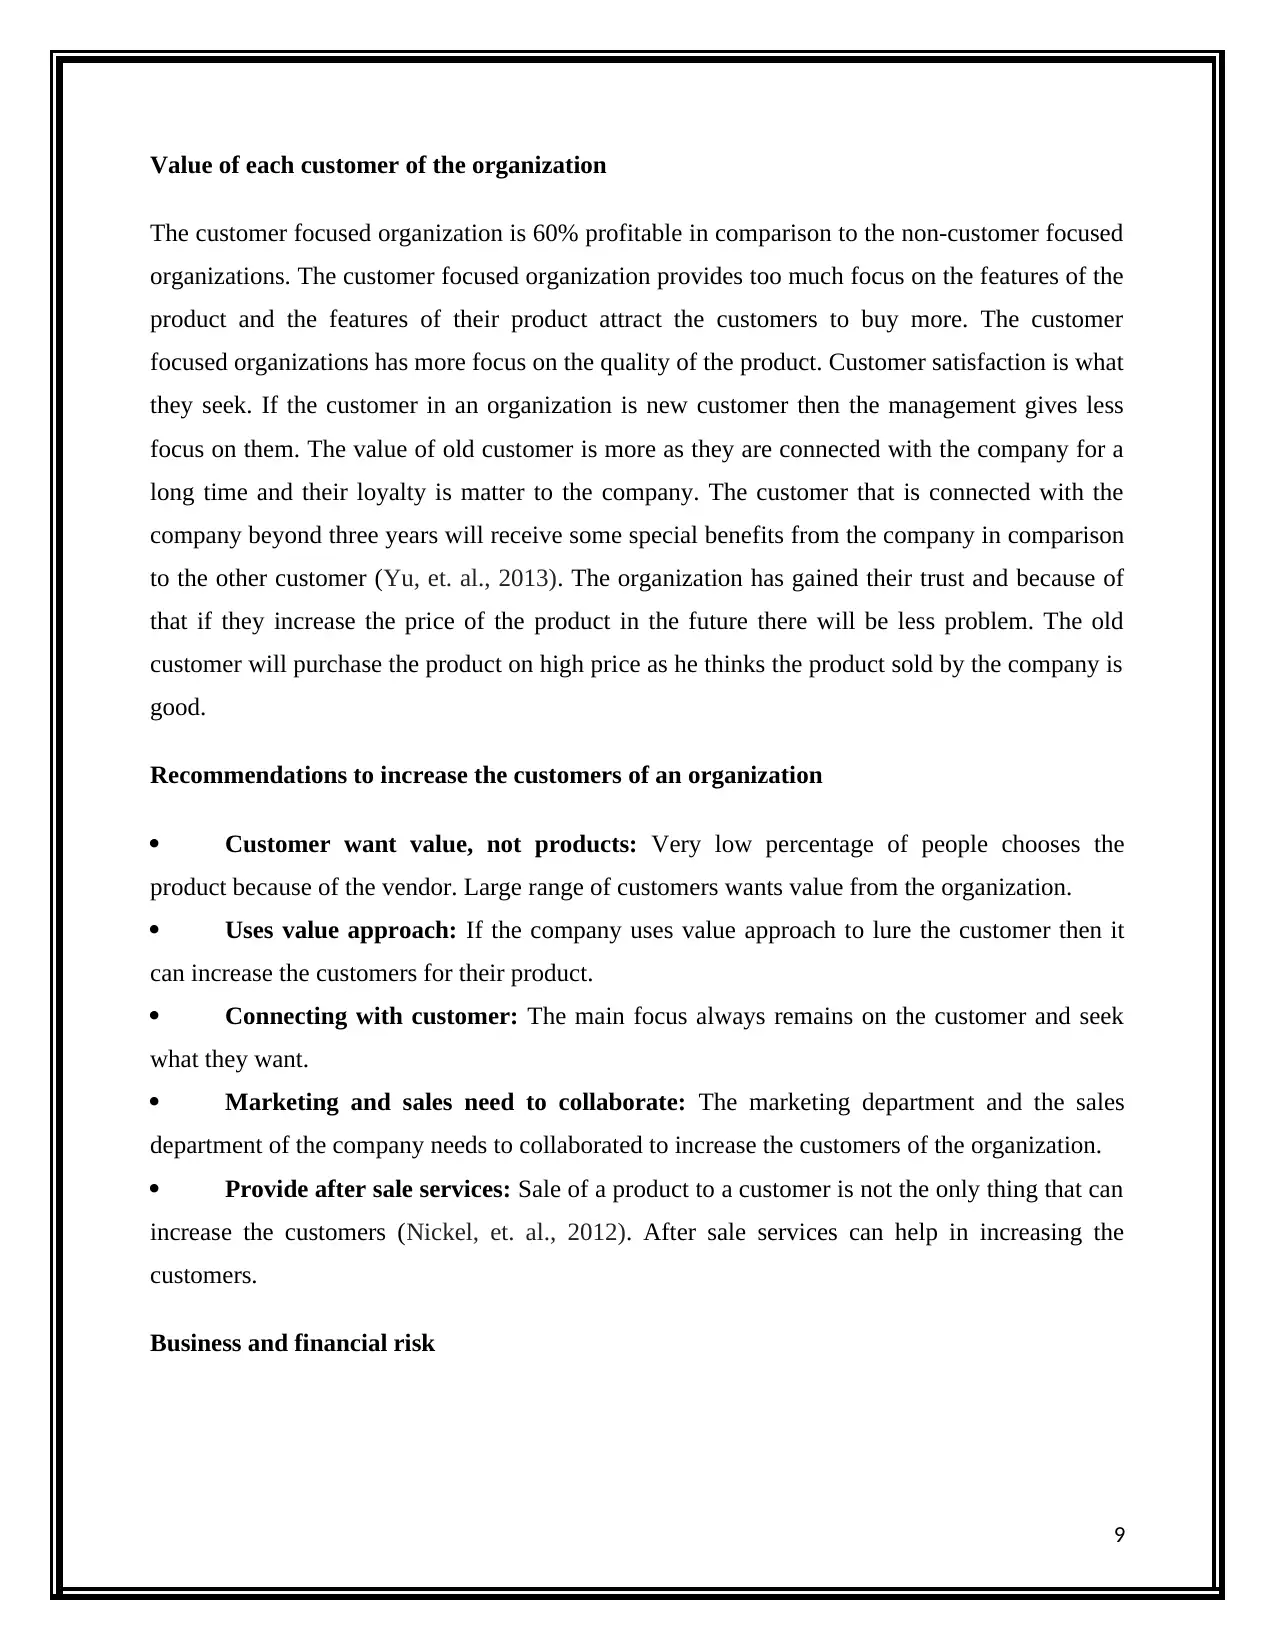
Value of each customer of the organization
The customer focused organization is 60% profitable in comparison to the non-customer focused
organizations. The customer focused organization provides too much focus on the features of the
product and the features of their product attract the customers to buy more. The customer
focused organizations has more focus on the quality of the product. Customer satisfaction is what
they seek. If the customer in an organization is new customer then the management gives less
focus on them. The value of old customer is more as they are connected with the company for a
long time and their loyalty is matter to the company. The customer that is connected with the
company beyond three years will receive some special benefits from the company in comparison
to the other customer (Yu, et. al., 2013). The organization has gained their trust and because of
that if they increase the price of the product in the future there will be less problem. The old
customer will purchase the product on high price as he thinks the product sold by the company is
good.
Recommendations to increase the customers of an organization
Customer want value, not products: Very low percentage of people chooses the
product because of the vendor. Large range of customers wants value from the organization.
Uses value approach: If the company uses value approach to lure the customer then it
can increase the customers for their product.
Connecting with customer: The main focus always remains on the customer and seek
what they want.
Marketing and sales need to collaborate: The marketing department and the sales
department of the company needs to collaborated to increase the customers of the organization.
Provide after sale services: Sale of a product to a customer is not the only thing that can
increase the customers (Nickel, et. al., 2012). After sale services can help in increasing the
customers.
Business and financial risk
9
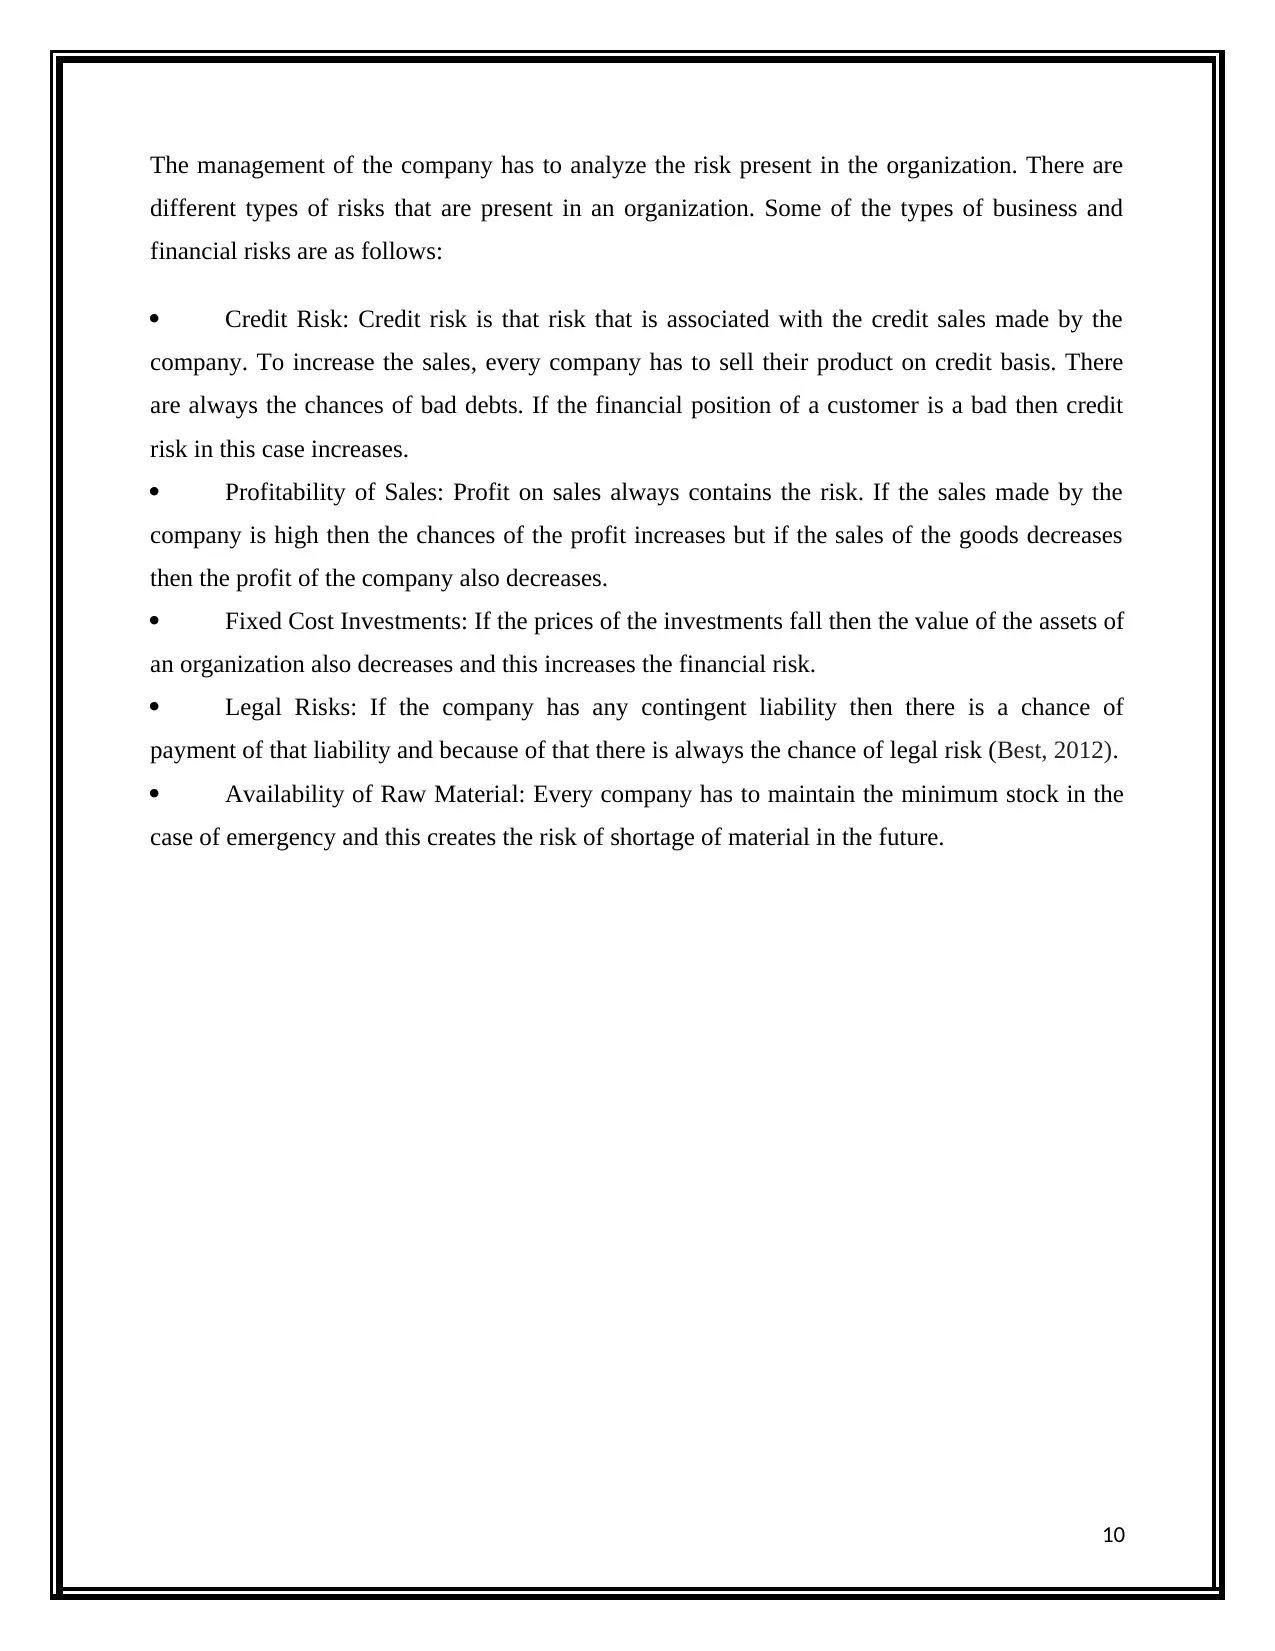
The management of the company has to analyze the risk present in the organization. There are
different types of risks that are present in an organization. Some of the types of business and
financial risks are as follows:
Credit Risk: Credit risk is that risk that is associated with the credit sales made by the
company. To increase the sales, every company has to sell their product on credit basis. There
are always the chances of bad debts. If the financial position of a customer is a bad then credit
risk in this case increases.
Profitability of Sales: Profit on sales always contains the risk. If the sales made by the
company is high then the chances of the profit increases but if the sales of the goods decreases
then the profit of the company also decreases.
Fixed Cost Investments: If the prices of the investments fall then the value of the assets of
an organization also decreases and this increases the financial risk.
Legal Risks: If the company has any contingent liability then there is a chance of
payment of that liability and because of that there is always the chance of legal risk (Best, 2012).
Availability of Raw Material: Every company has to maintain the minimum stock in the
case of emergency and this creates the risk of shortage of material in the future.
10
Paraphrase This Document
Need a fresh take? Get an instant paraphrase of this document with our AI Paraphraser
References
Best, R. (2012). Market-based management. Pearson Higher Ed.
Bol, J. C., & Lill, J. B. (2015). Performance target revisions in incentive contracts: Do
information and trust reduce ratcheting and the ratchet effect?. The Accounting Review, 90(5),
1755-1778.
Chang, W., Chang, C., & Li, Q. (2012). Customer lifetime value: A review. Social Behavior and
Personality: an international journal, 40(7), 1057-1064.
Gleason, C. A., Bruce Johnson, W., & Li, H. (2013). Valuation model use and the price target
performance of sell‐side equity analysts. Contemporary Accounting Research, 30(1), 80-115.
Graetz, G., & Franks, D. M. (2016). Conceptualising social risk and business risk associated with
private sector development projects. Journal of Risk Research, 19(5), 581-601.
Nickel, S., Saldanha-da-Gama, F., & Ziegler, H. P. (2012). A multi-stage stochastic supply
network design problem with financial decisions and risk management. Omega, 40(5), 511-524.
Sadgrove, K. (2016). The complete guide to business risk management. Routledge.
Saeidi, S. P., Sofian, S., Saeidi, P., Saeidi, S. P., & Saaeidi, S. A. (2015). How does corporate
social responsibility contribute to firm financial performance? The mediating role of competitive
advantage, reputation, and customer satisfaction. Journal of business research, 68(2), 341-350.
Tarasi, C. O., Bolton, R. N., Gustafsson, A., & Walker, B. A. (2013). Relationship characteristics
and cash flow variability: implications for satisfaction, loyalty, and customer portfolio
management. Journal of Service Research, 16(2), 121-137.
Wu, J., Al-Khateeb, F. B., Teng, J. T., & Cárdenas-Barrón, L. E. (2016). Inventory models for
deteriorating items with maximum lifetime under downstream partial trade credits to credit-risk
customers by discounted cash-flow analysis. International Journal of Production
Economics, 171, 105-115.
11
Yu, W., Jacobs, M. A., Salisbury, W. D., & Enns, H. (2013). The effects of supply chain
integration on customer satisfaction and financial performance: An organizational learning
perspective. International Journal of Production Economics, 146(1), 346-358.
12
integration on customer satisfaction and financial performance: An organizational learning
perspective. International Journal of Production Economics, 146(1), 346-358.
12

13
1 out of 13
Related Documents


Your All-in-One AI-Powered Toolkit for Academic Success.
+13062052269
info@desklib.com
Available 24*7 on WhatsApp / Email
![[object Object]](/_next/static/media/star-bottom.7253800d.svg)
Unlock your academic potential
© 2024 | Zucol Services PVT LTD | All rights reserved.