Linear Regression Analysis of Sales and Consumption Survey Data
VerifiedAdded on 2023/06/03
|5
|1019
|116
Homework Assignment
AI Summary
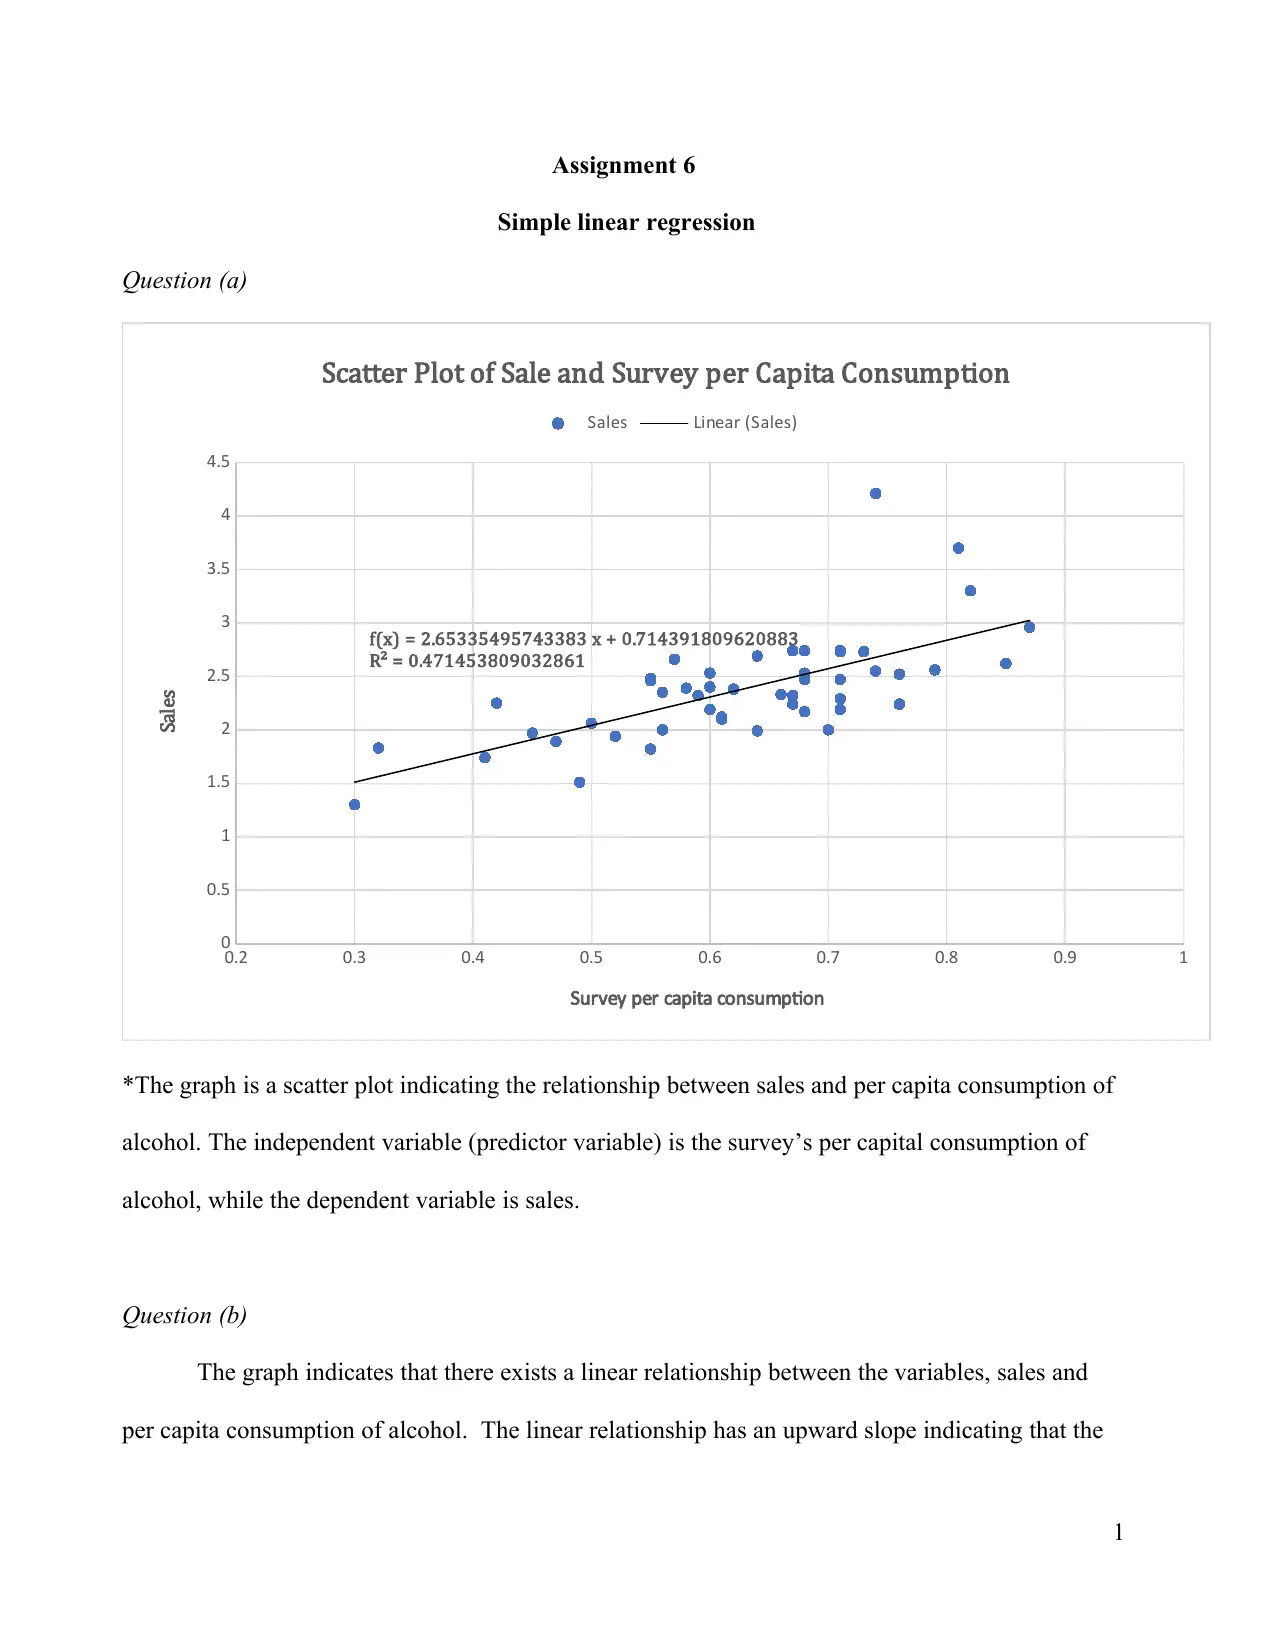
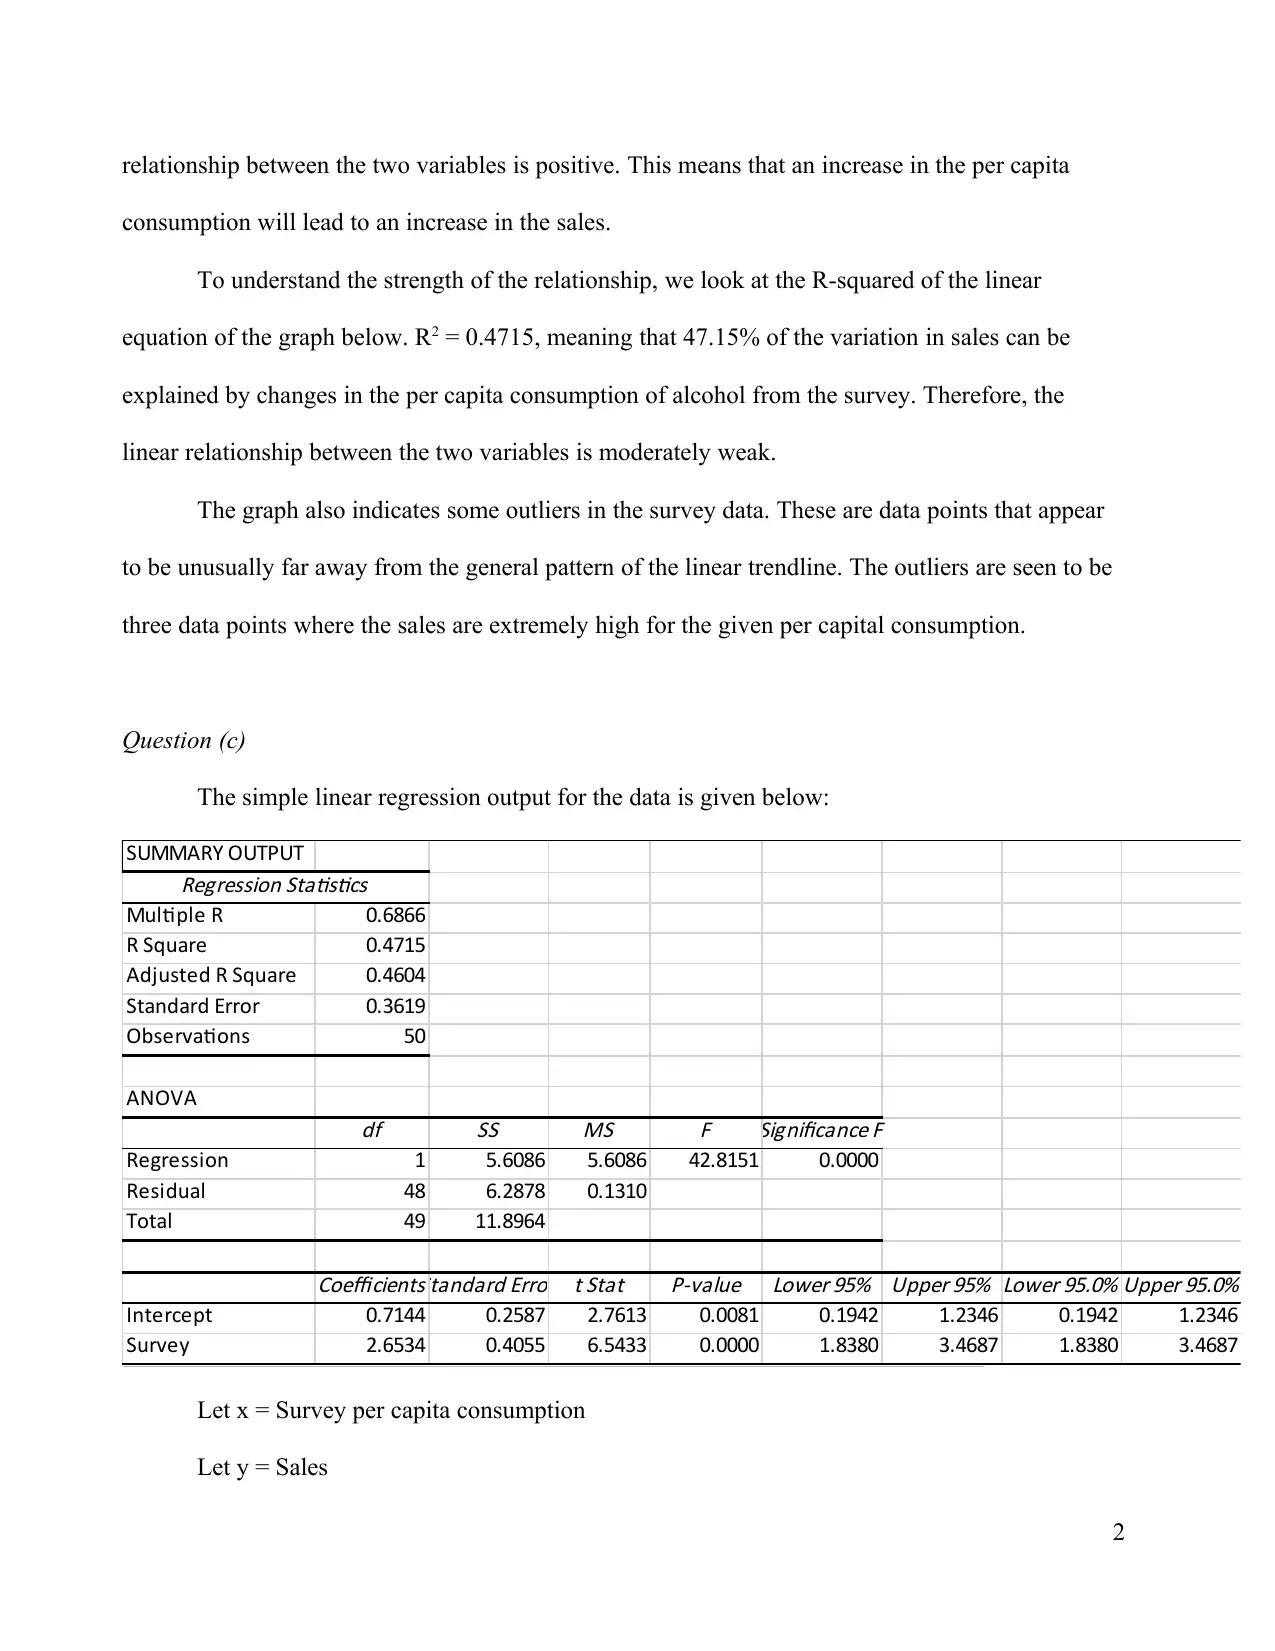
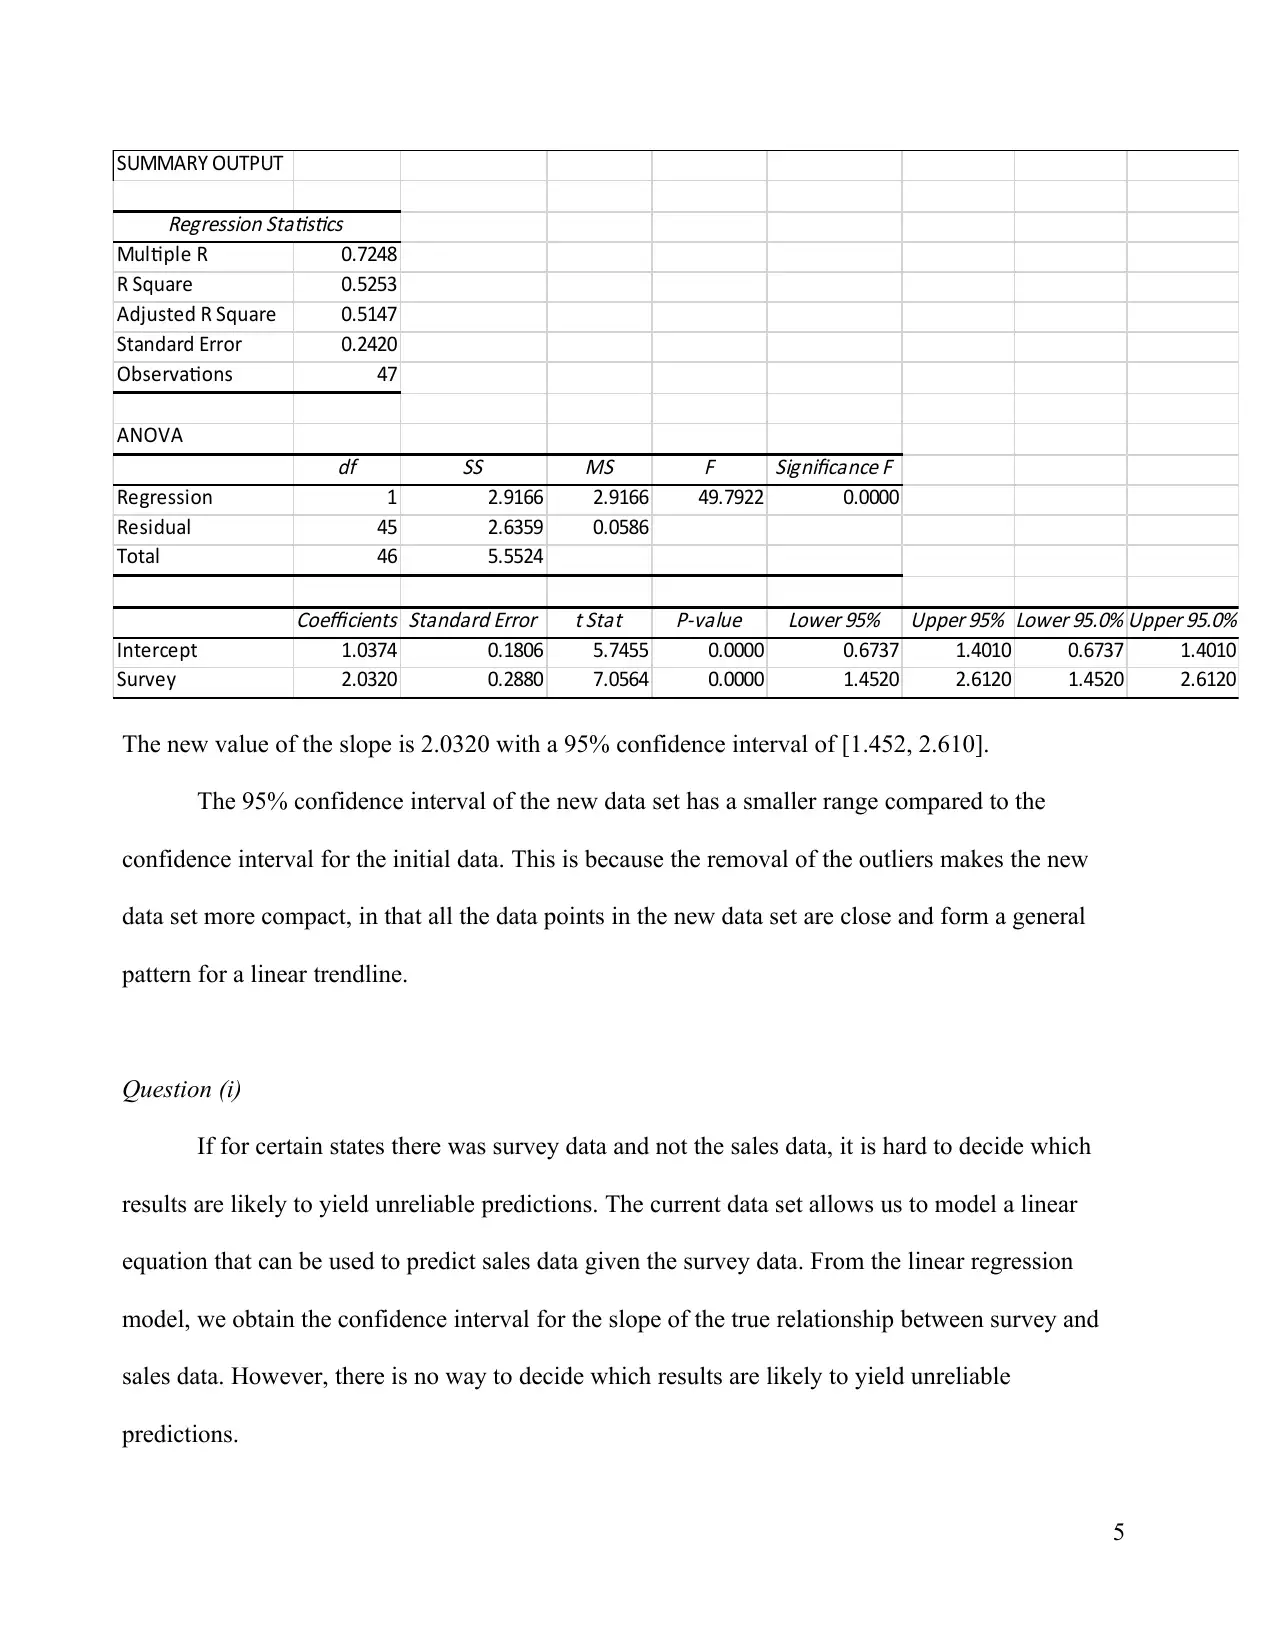
This assignment solution presents a detailed analysis of sales data using simple linear regression. It begins with a scatter plot illustrating the relationship between sales and per capita consumption of alcohol, identifying the independent and dependent variables. The solution then discusses the linear relationship, R-squared value, and the presence of outliers. It includes the simple linear regression output, the line of best fit, and interpretations of the slope and intercept. The analysis covers the coefficient of determination, hypothesis testing to determine the significance of the linear relationship, and the calculation of a 95% confidence interval for the slope. Finally, the assignment addresses the impact of removing outliers on the regression results and the reliability of predictions when sales data is missing, providing a comprehensive statistical analysis of the provided data.
1 out of 5
Related Documents


Your All-in-One AI-Powered Toolkit for Academic Success.
+13062052269
info@desklib.com
Available 24*7 on WhatsApp / Email
![[object Object]](/_next/static/media/star-bottom.7253800d.svg)
Copyright © 2020–2026 A2Z Services. All Rights Reserved. Developed and managed by ZUCOL.