Regression Model for Samsung Stock Price: A Statistical Analysis
VerifiedAdded on 2023/06/10
|10
|1241
|364
Report
AI Summary
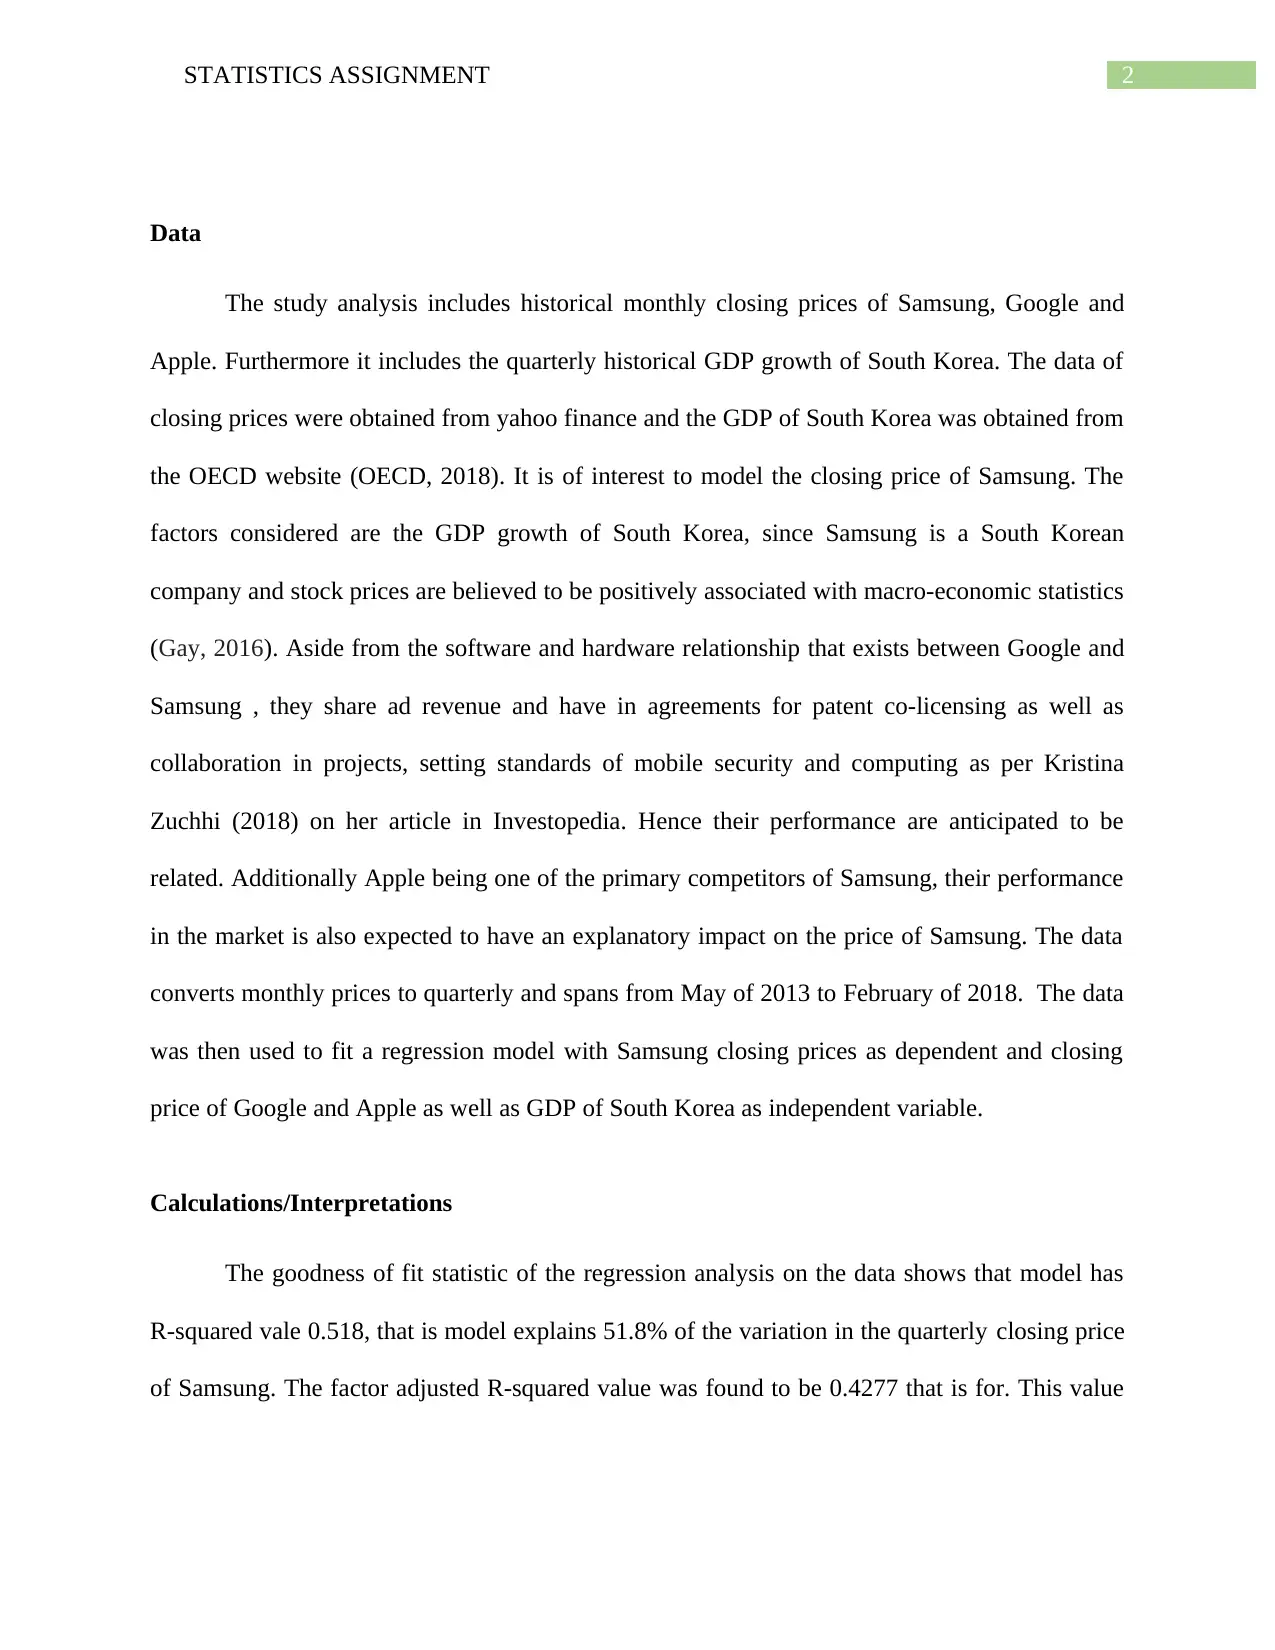
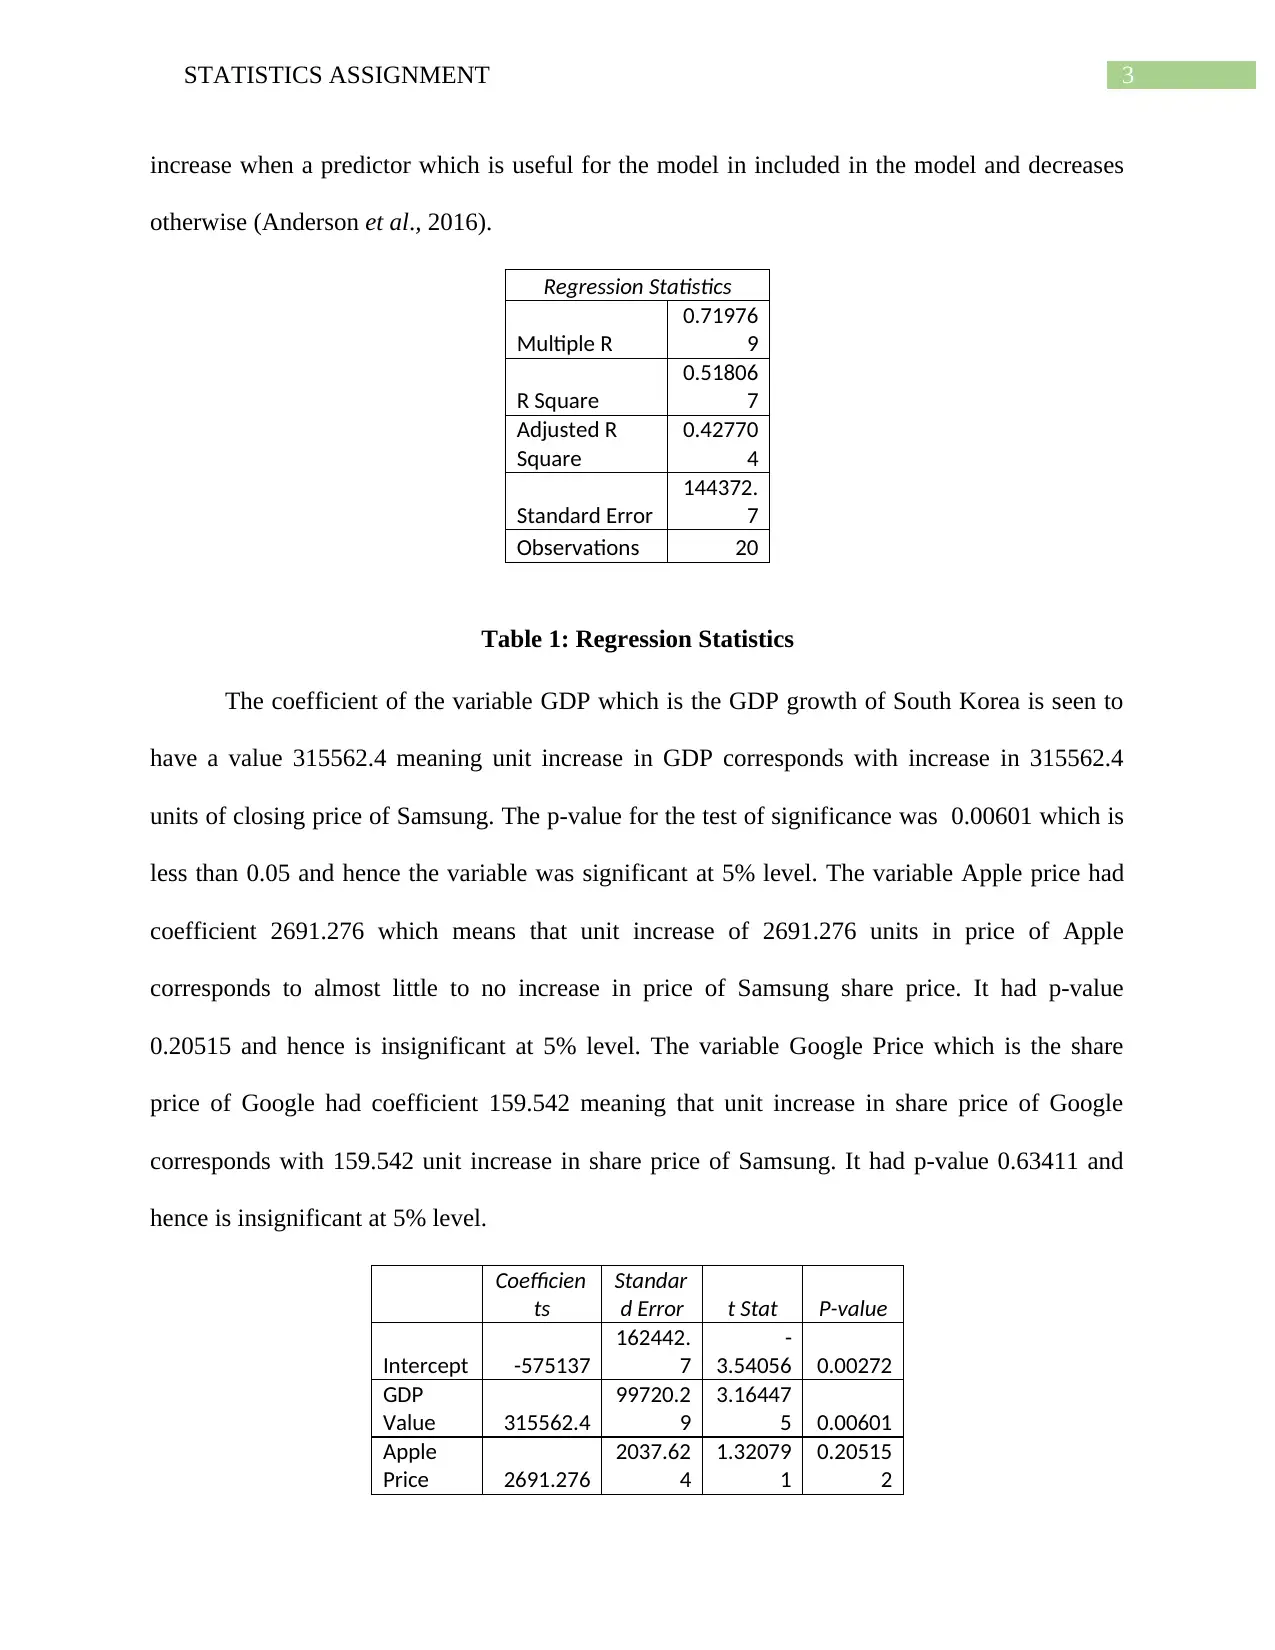
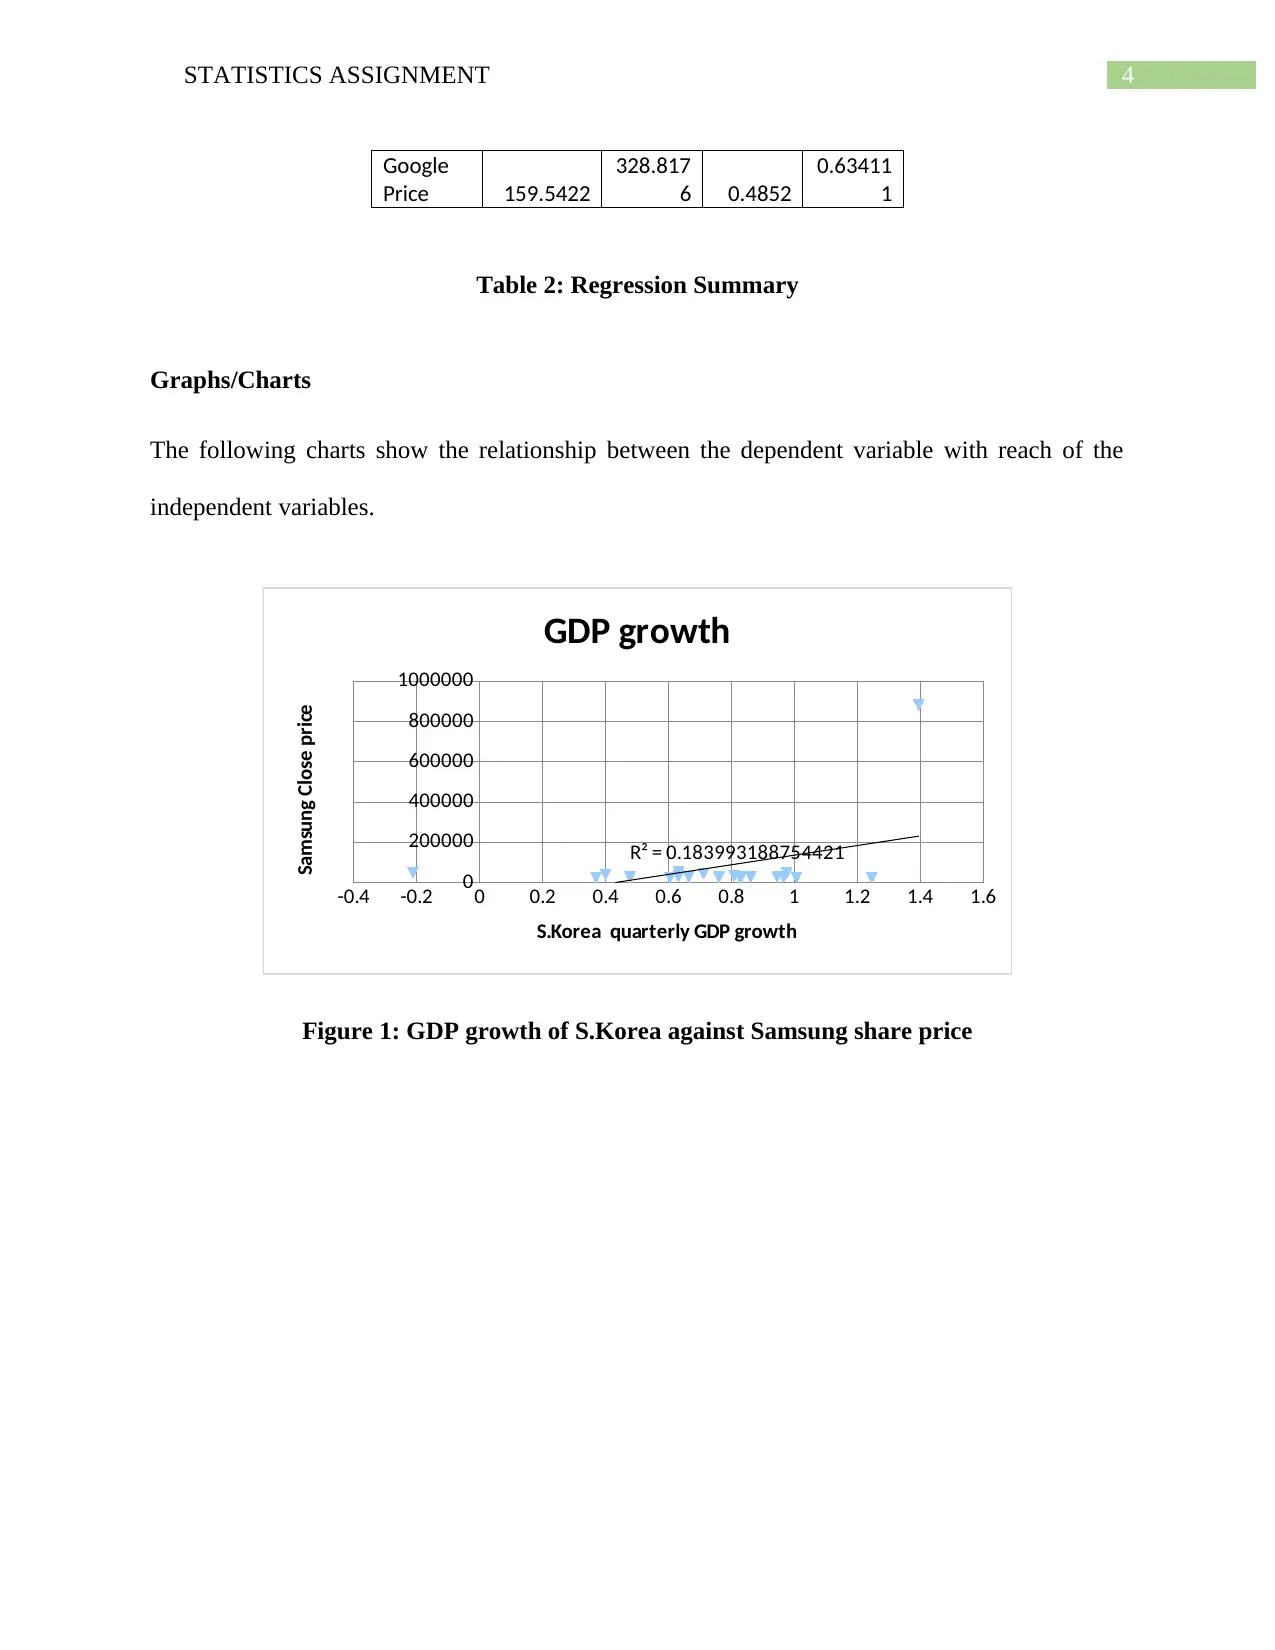
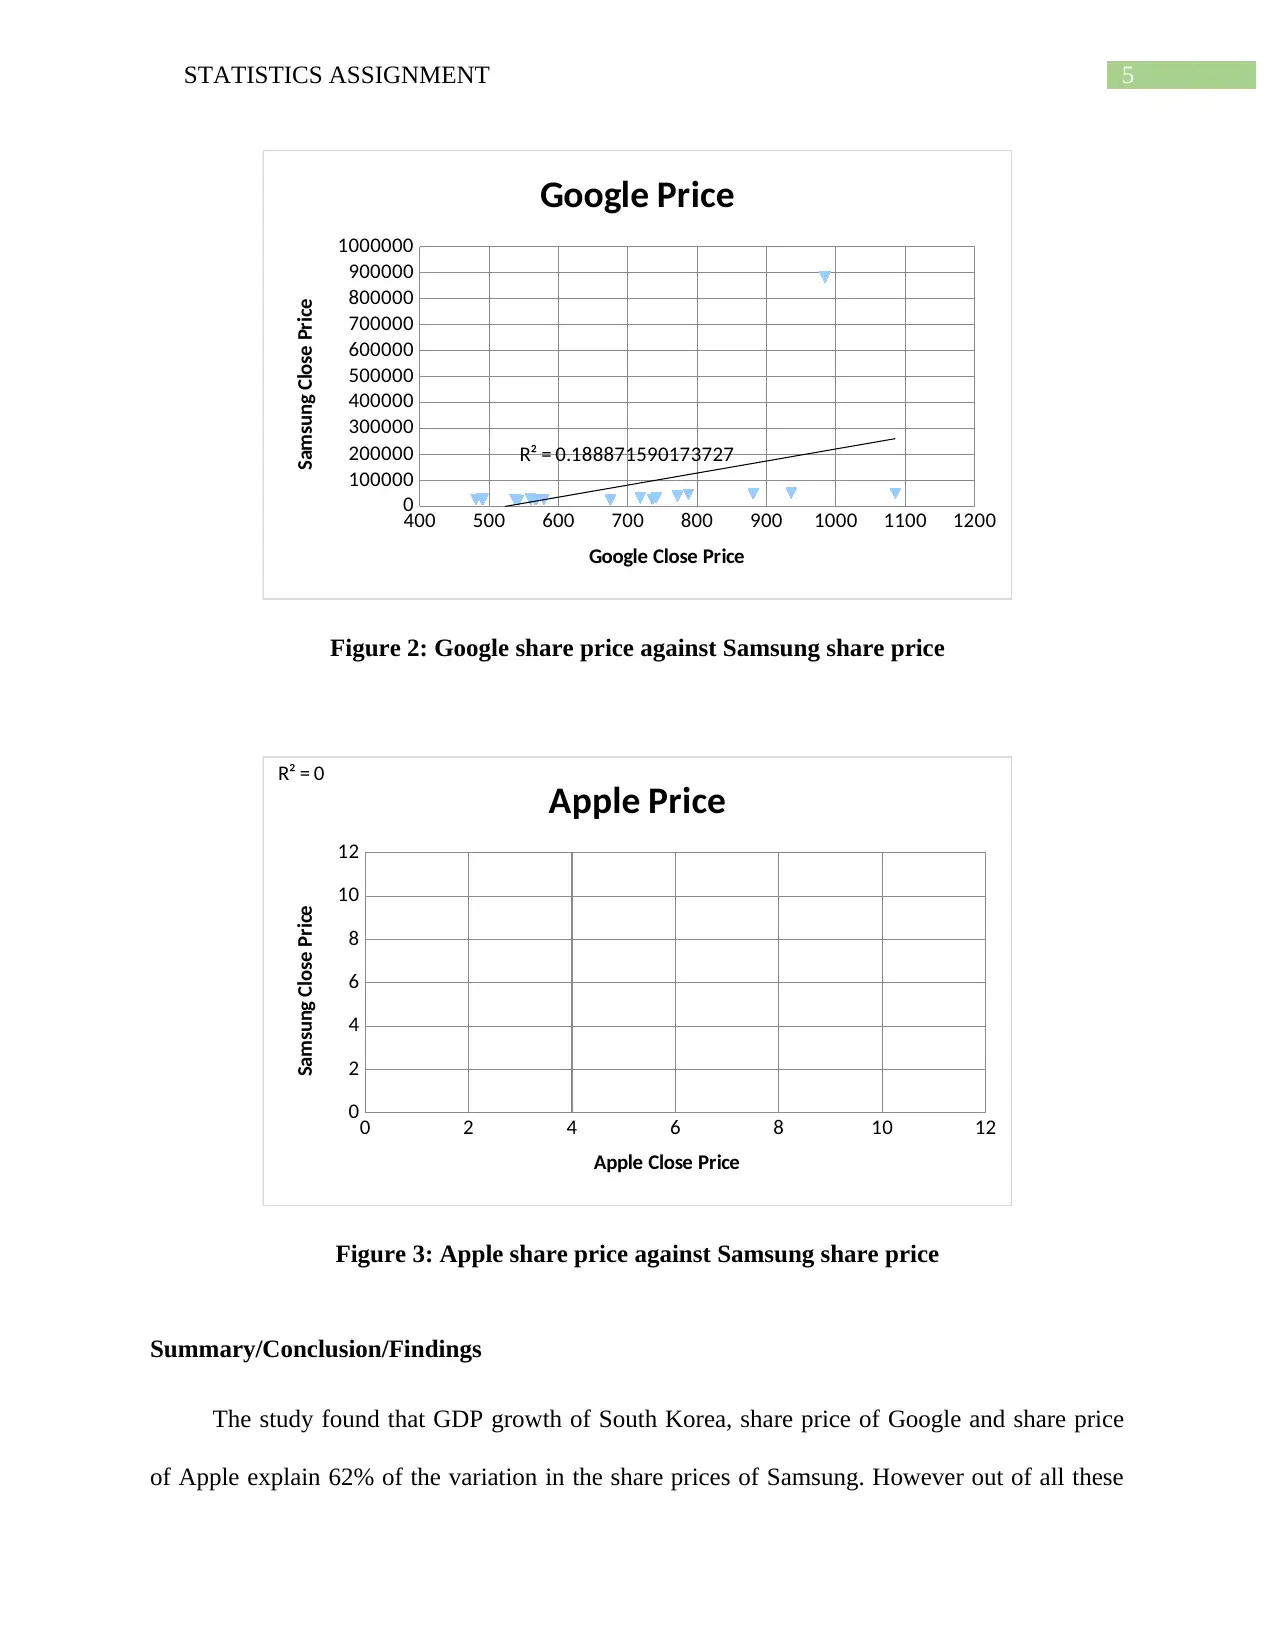
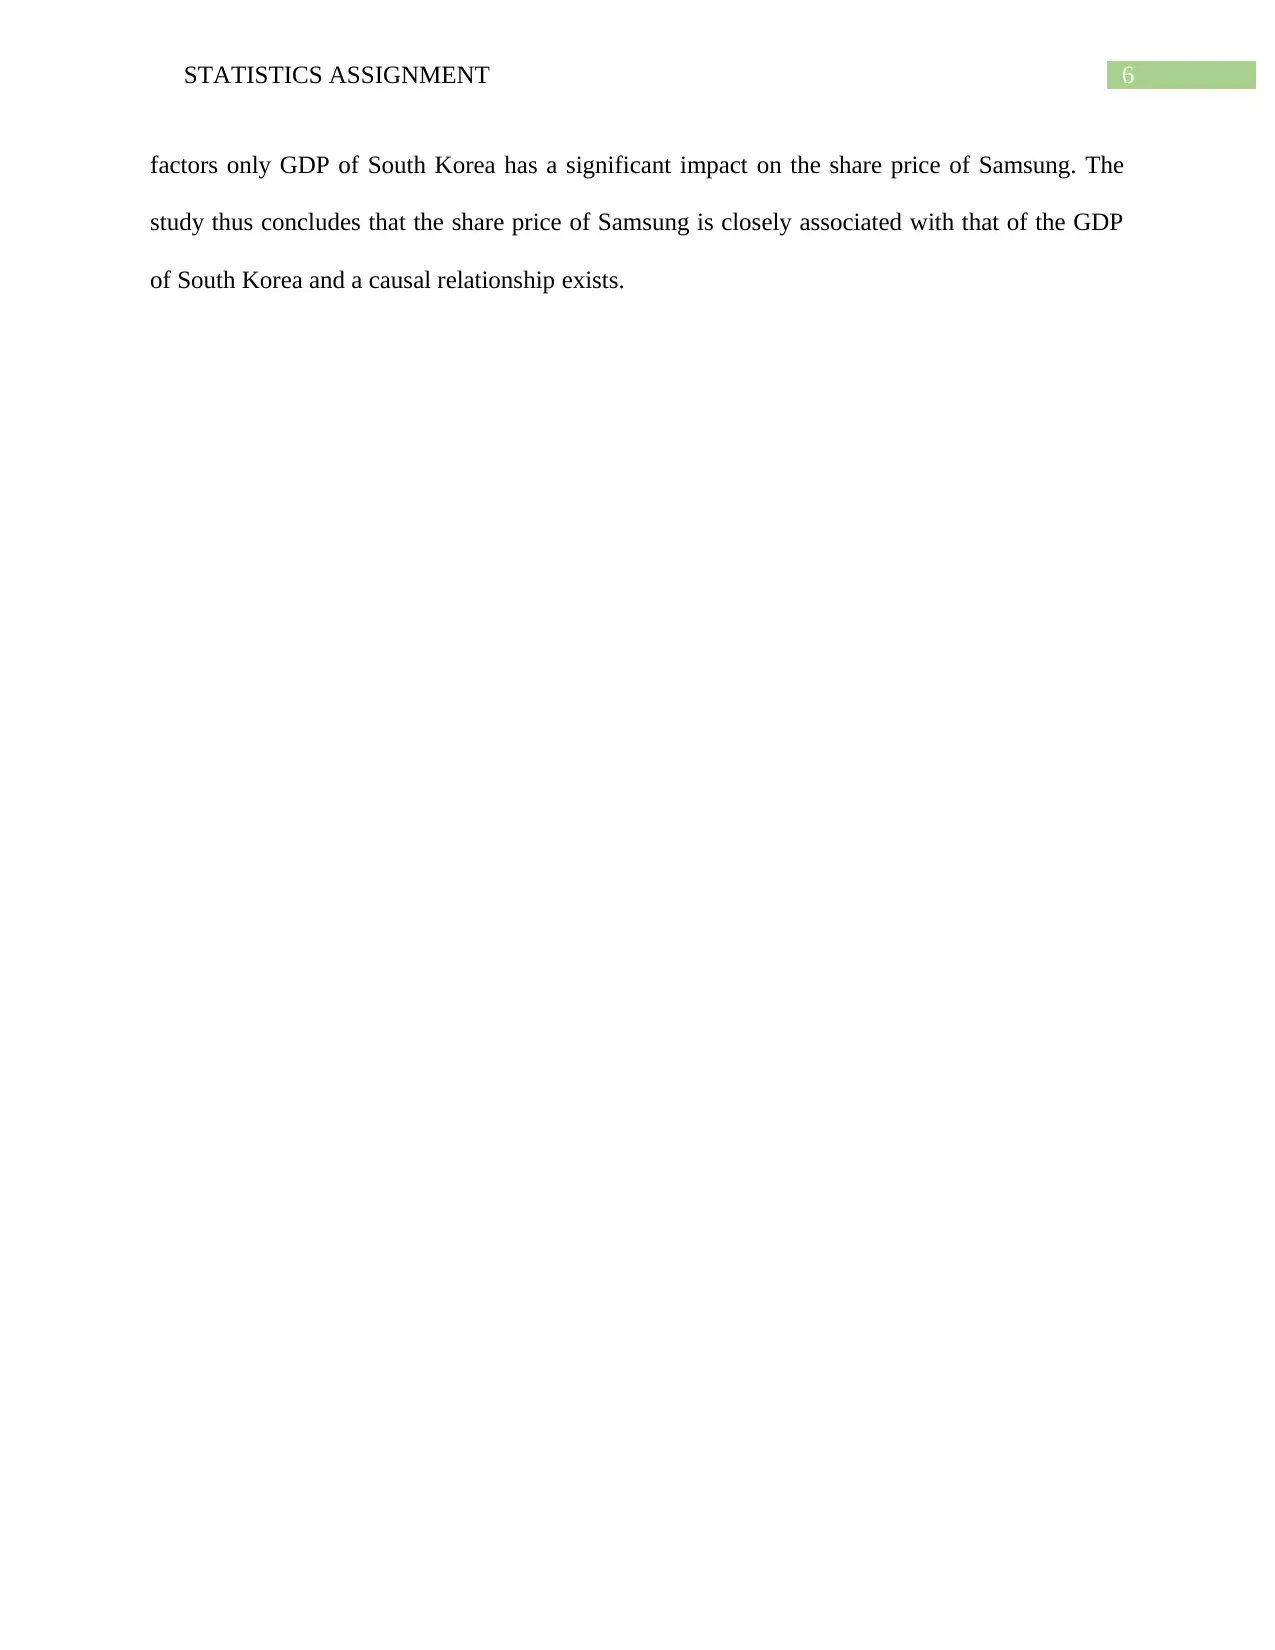
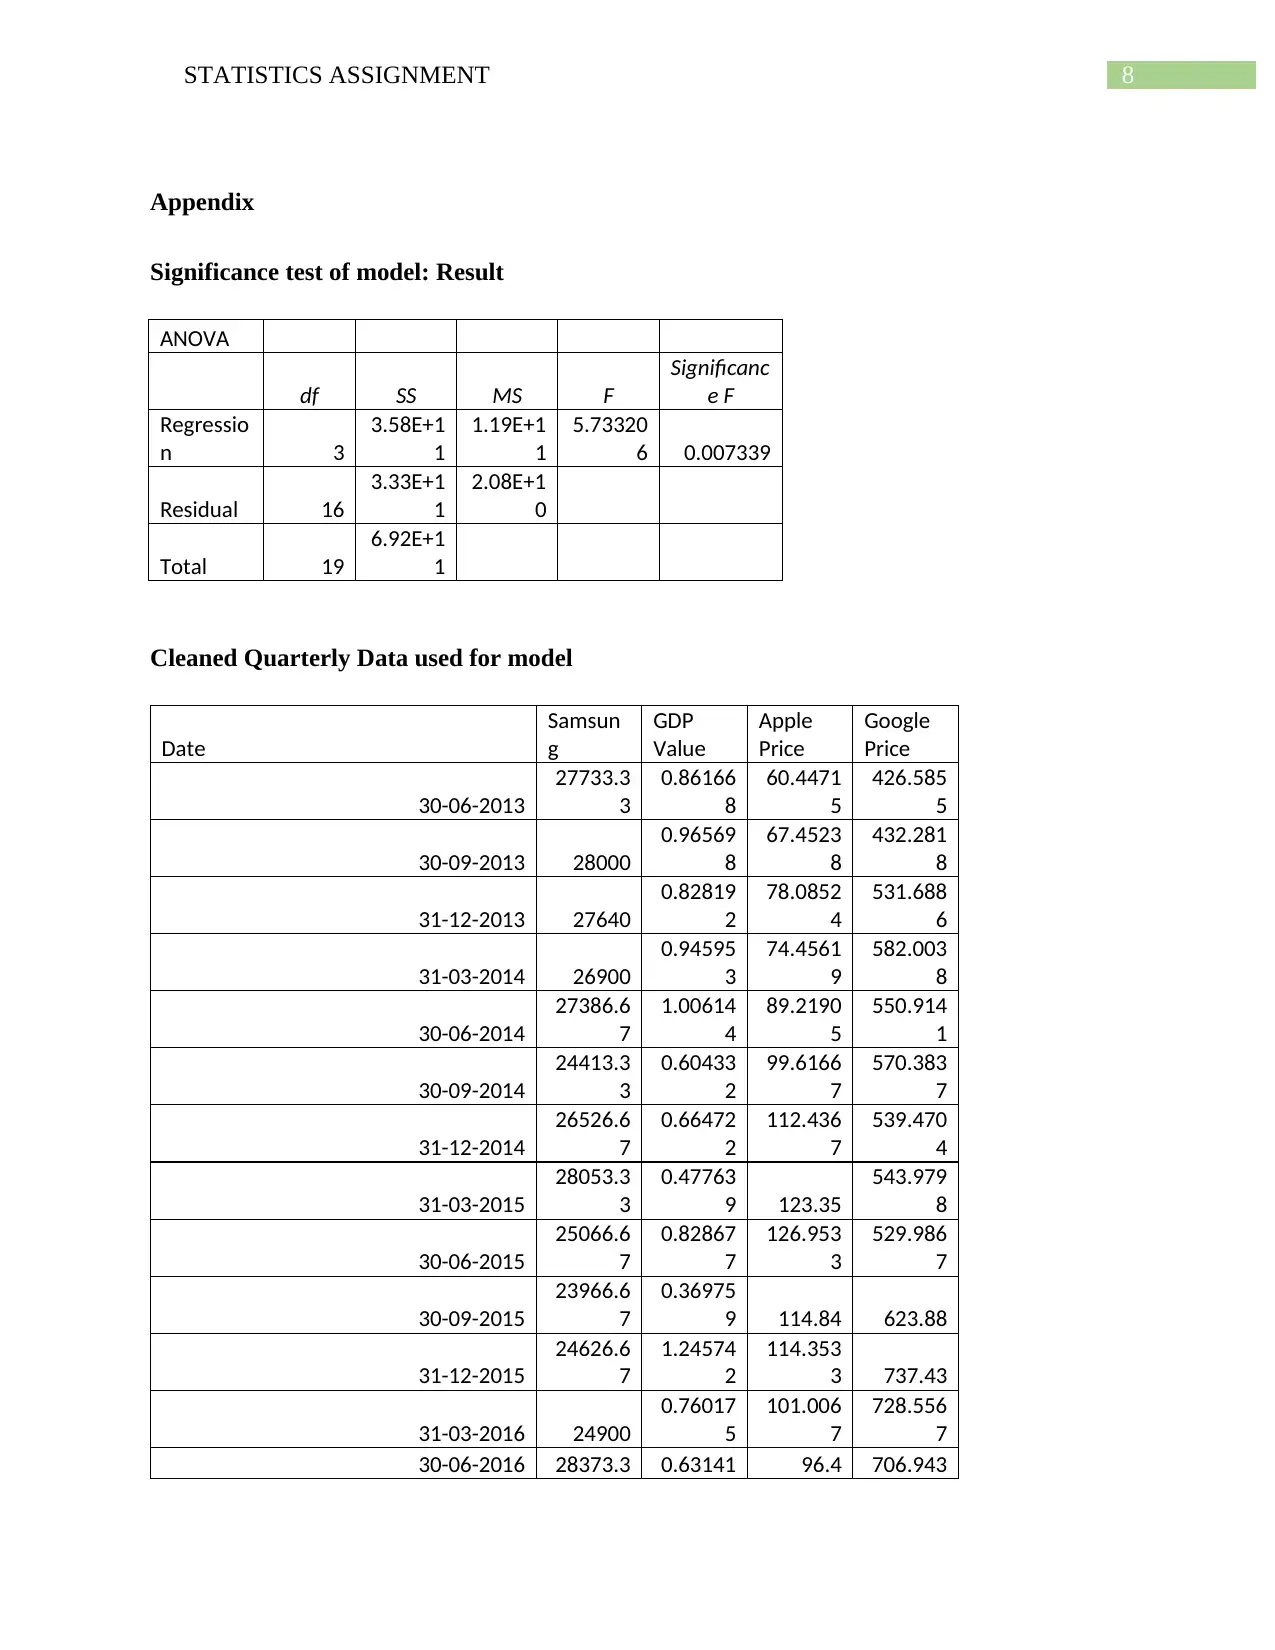
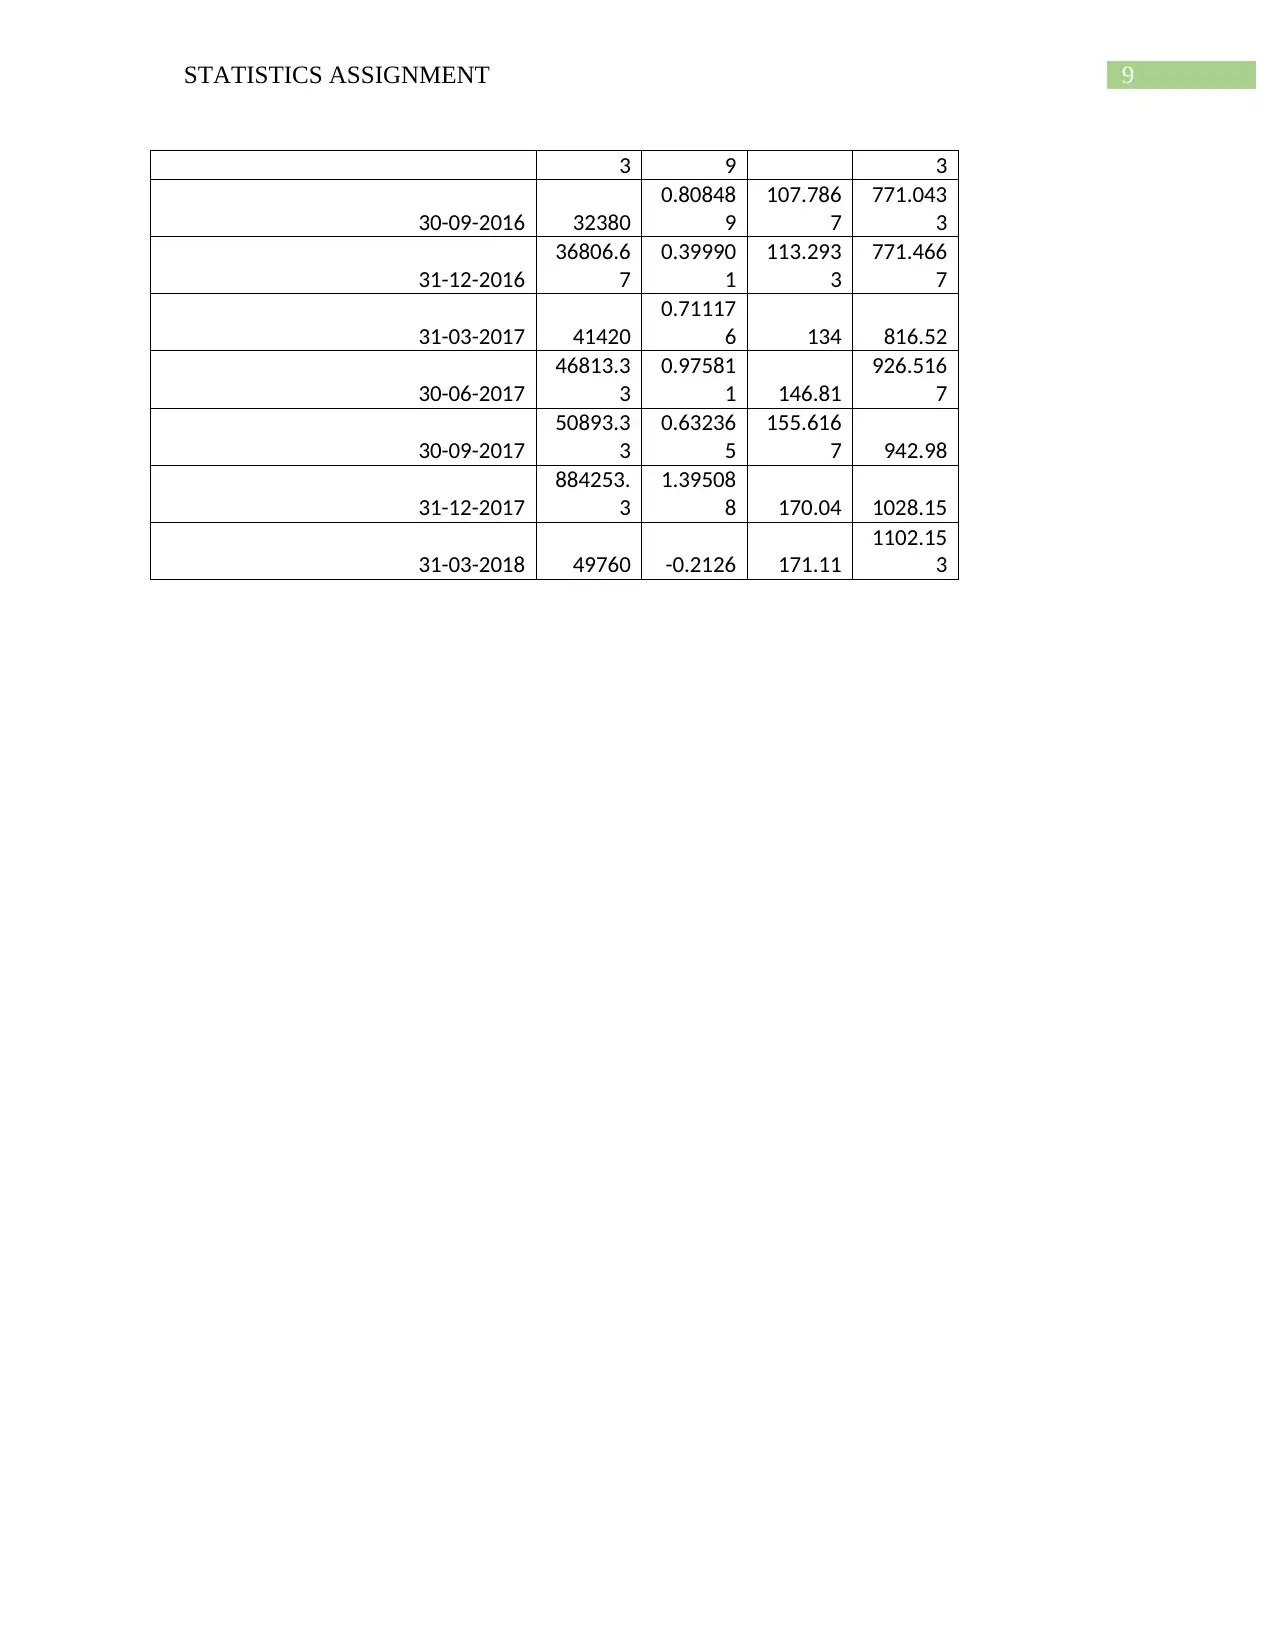
This report presents a statistical analysis of the historical quarterly closing prices of Samsung, using regression analysis to model its stock price. The analysis considers the GDP growth of South Korea, along with the stock prices of Google and Apple, as independent variables. The regression model explains 51.8% of the variation in Samsung's stock price, with the GDP of South Korea showing a statistically significant impact. While Google and Apple's stock prices do not show significant individual impacts, the model as a whole provides insights into the factors influencing Samsung's stock performance. The report includes regression statistics, charts illustrating the relationships between variables, and a conclusion highlighting the key findings regarding the association between Samsung's stock price and the GDP of South Korea. The data used spans from May 2013 to February 2018, and the analysis indicates a causal relationship between South Korea's GDP and Samsung's stock value.
1 out of 10
Related Documents


Your All-in-One AI-Powered Toolkit for Academic Success.
+13062052269
info@desklib.com
Available 24*7 on WhatsApp / Email
![[object Object]](/_next/static/media/star-bottom.7253800d.svg)
Copyright © 2020–2026 A2Z Services. All Rights Reserved. Developed and managed by ZUCOL.