SIT718: Real World Analytics - Forest Fire Data Analysis and Modeling
VerifiedAdded on 2023/04/23
|7
|2070
|115
Practical Assignment
AI Summary
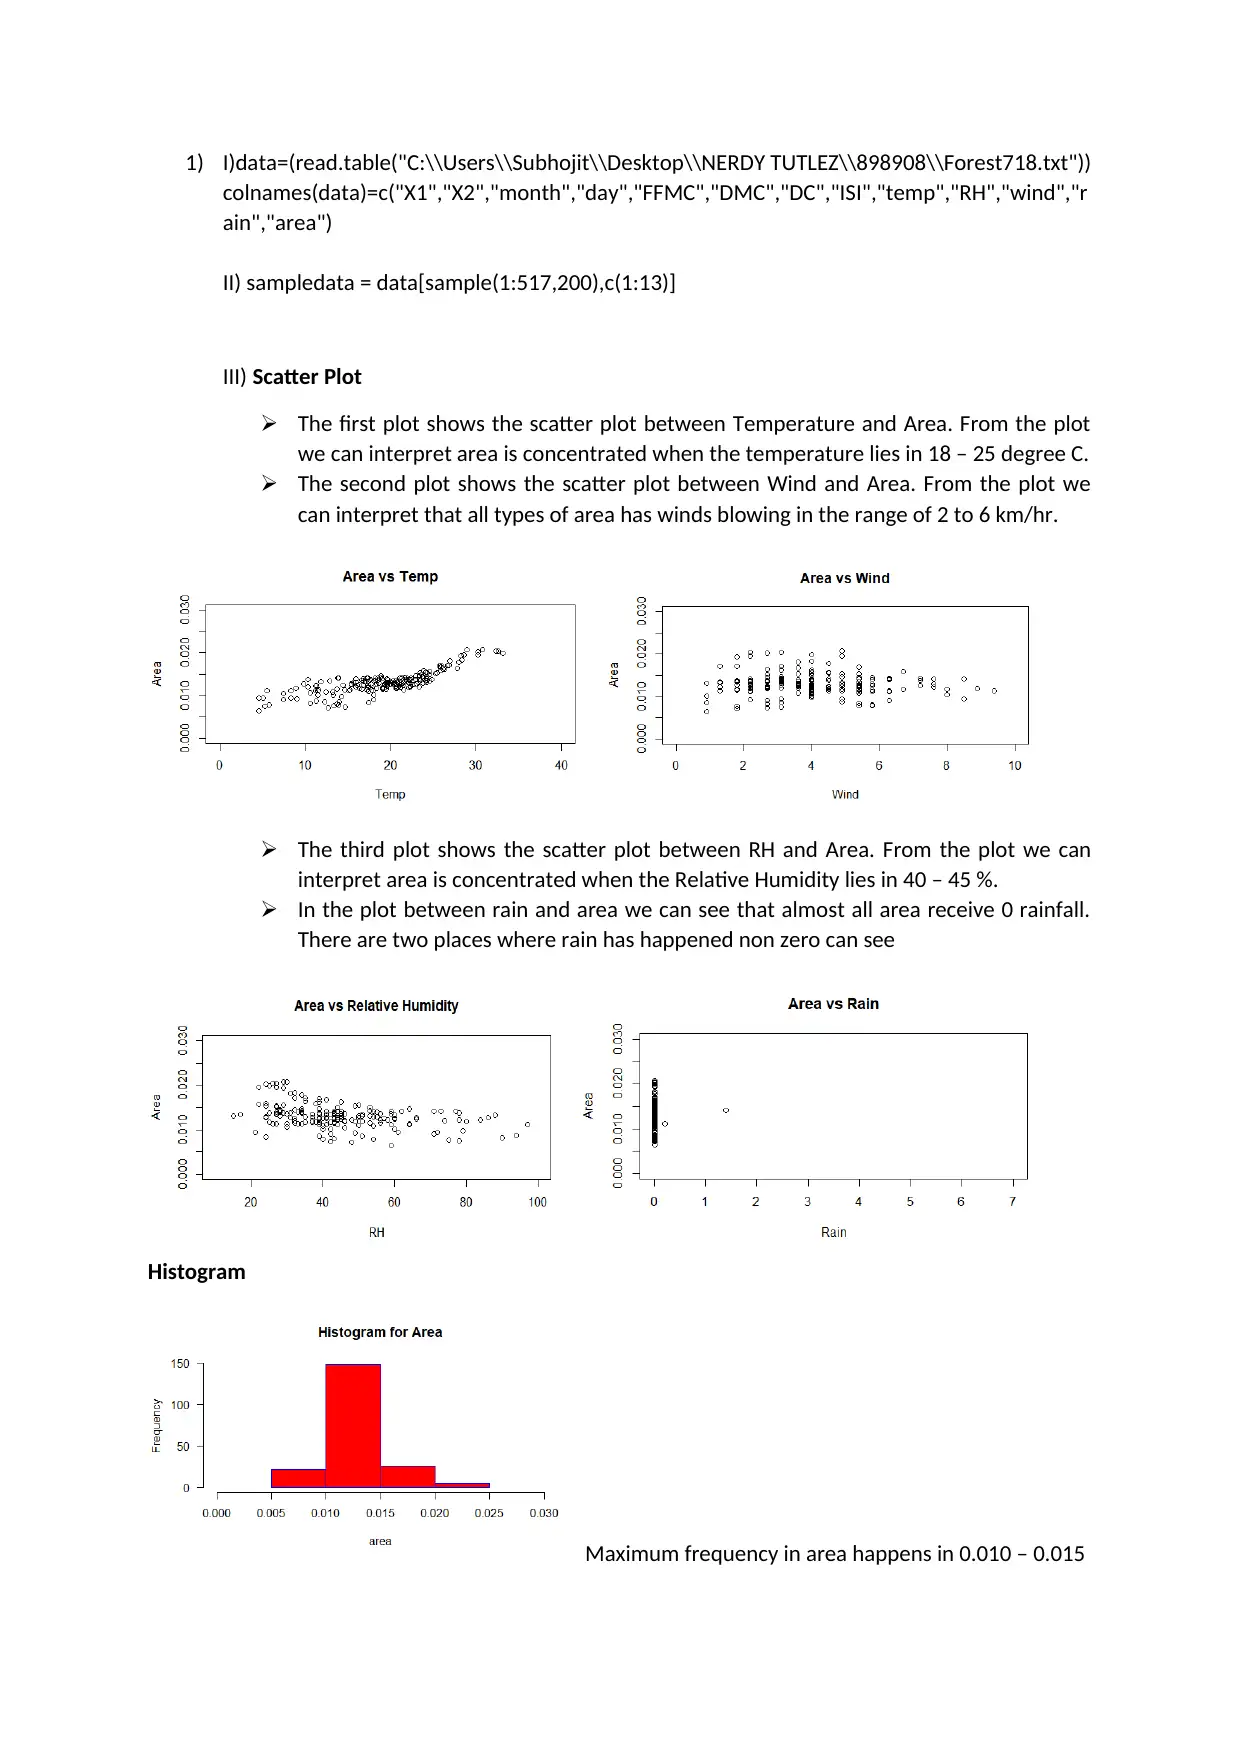
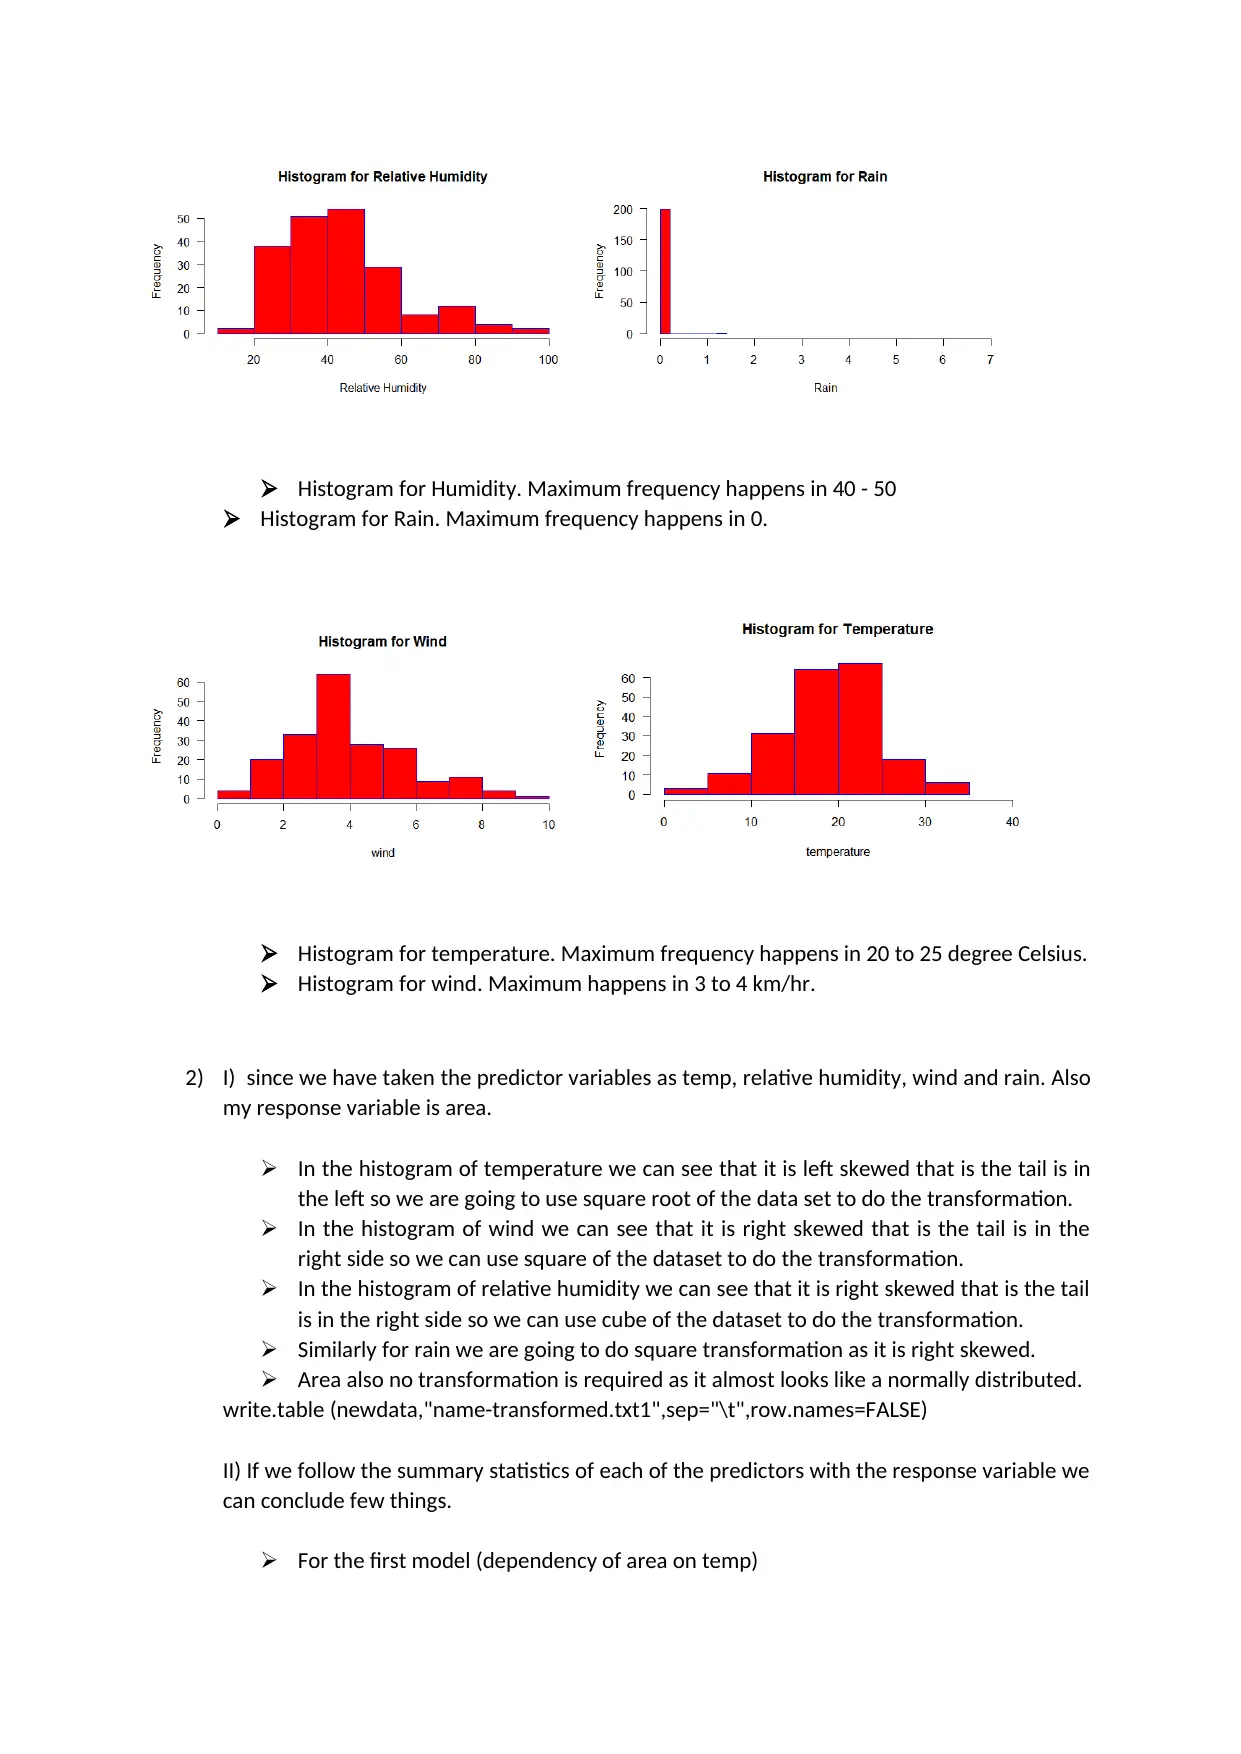
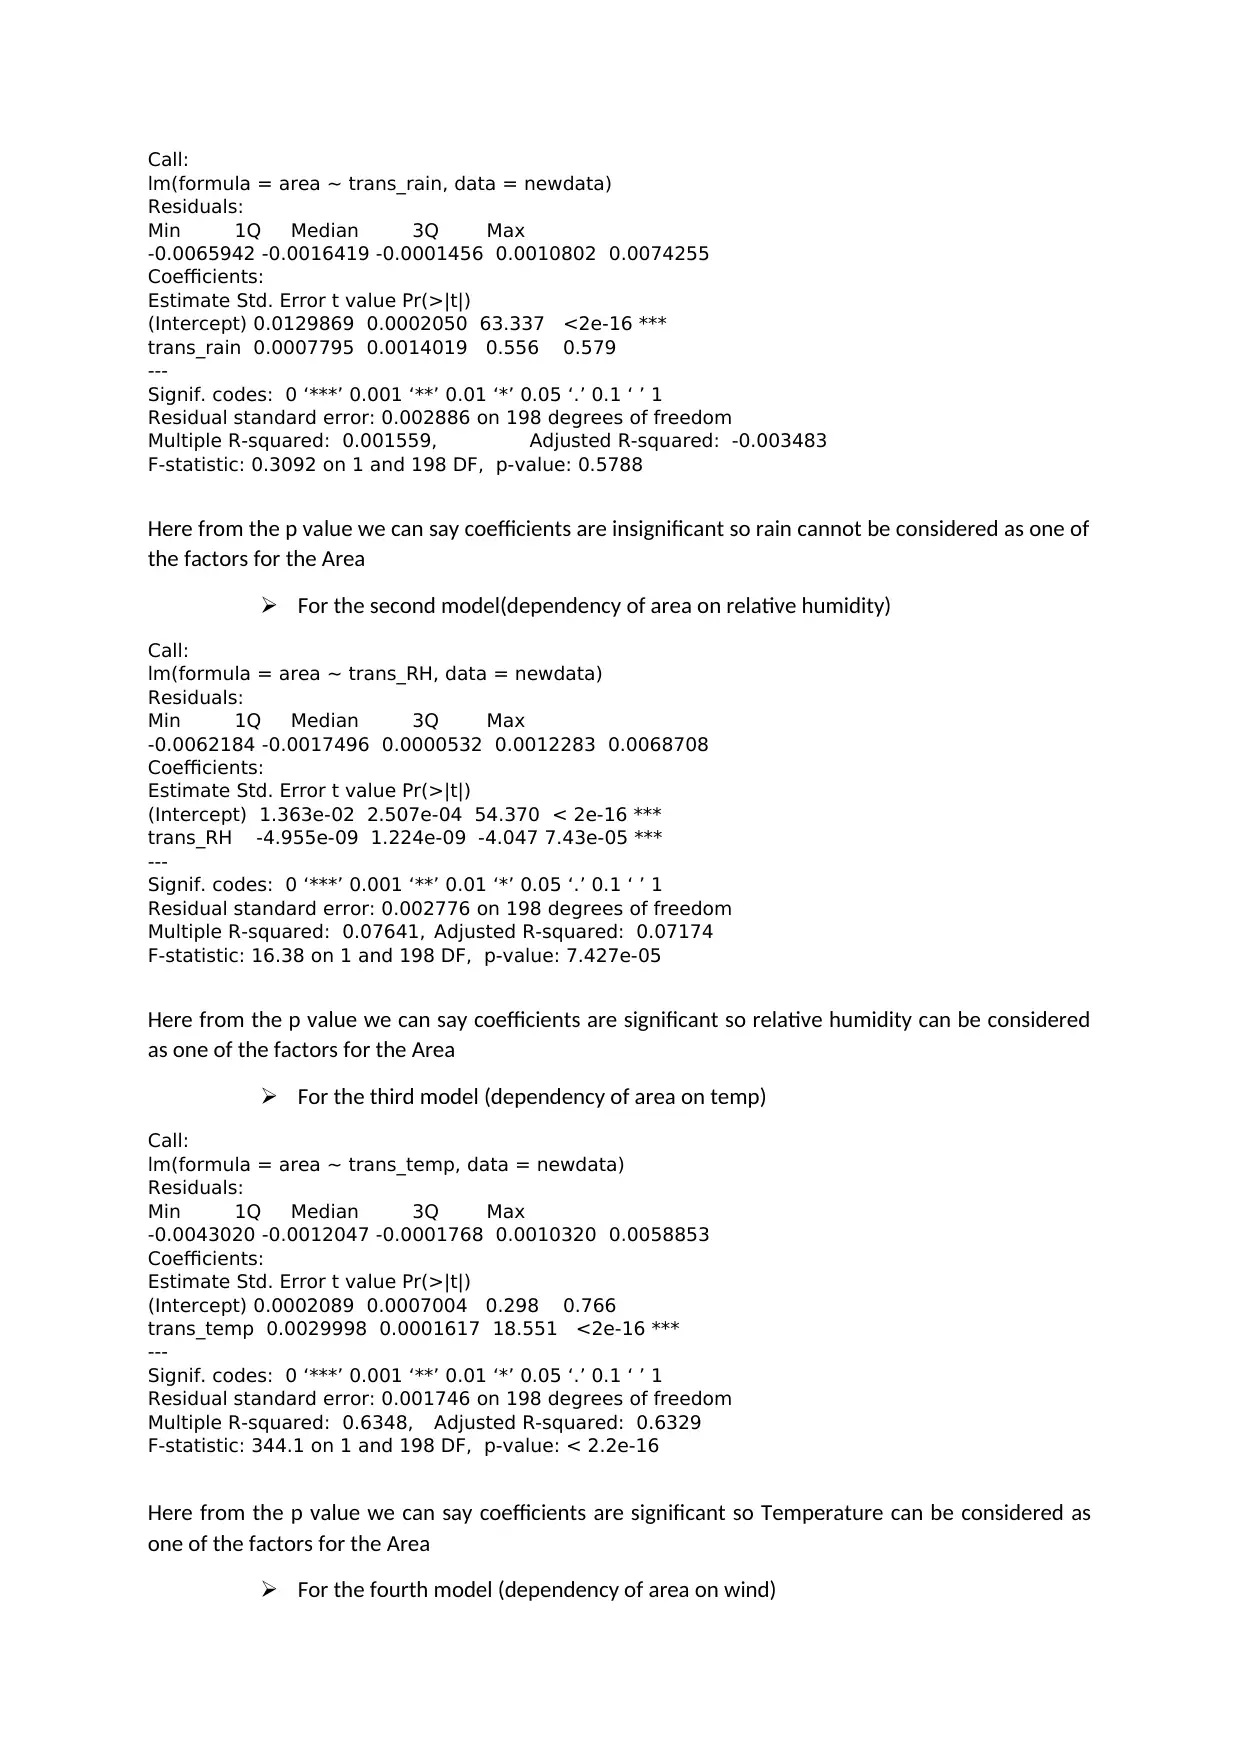
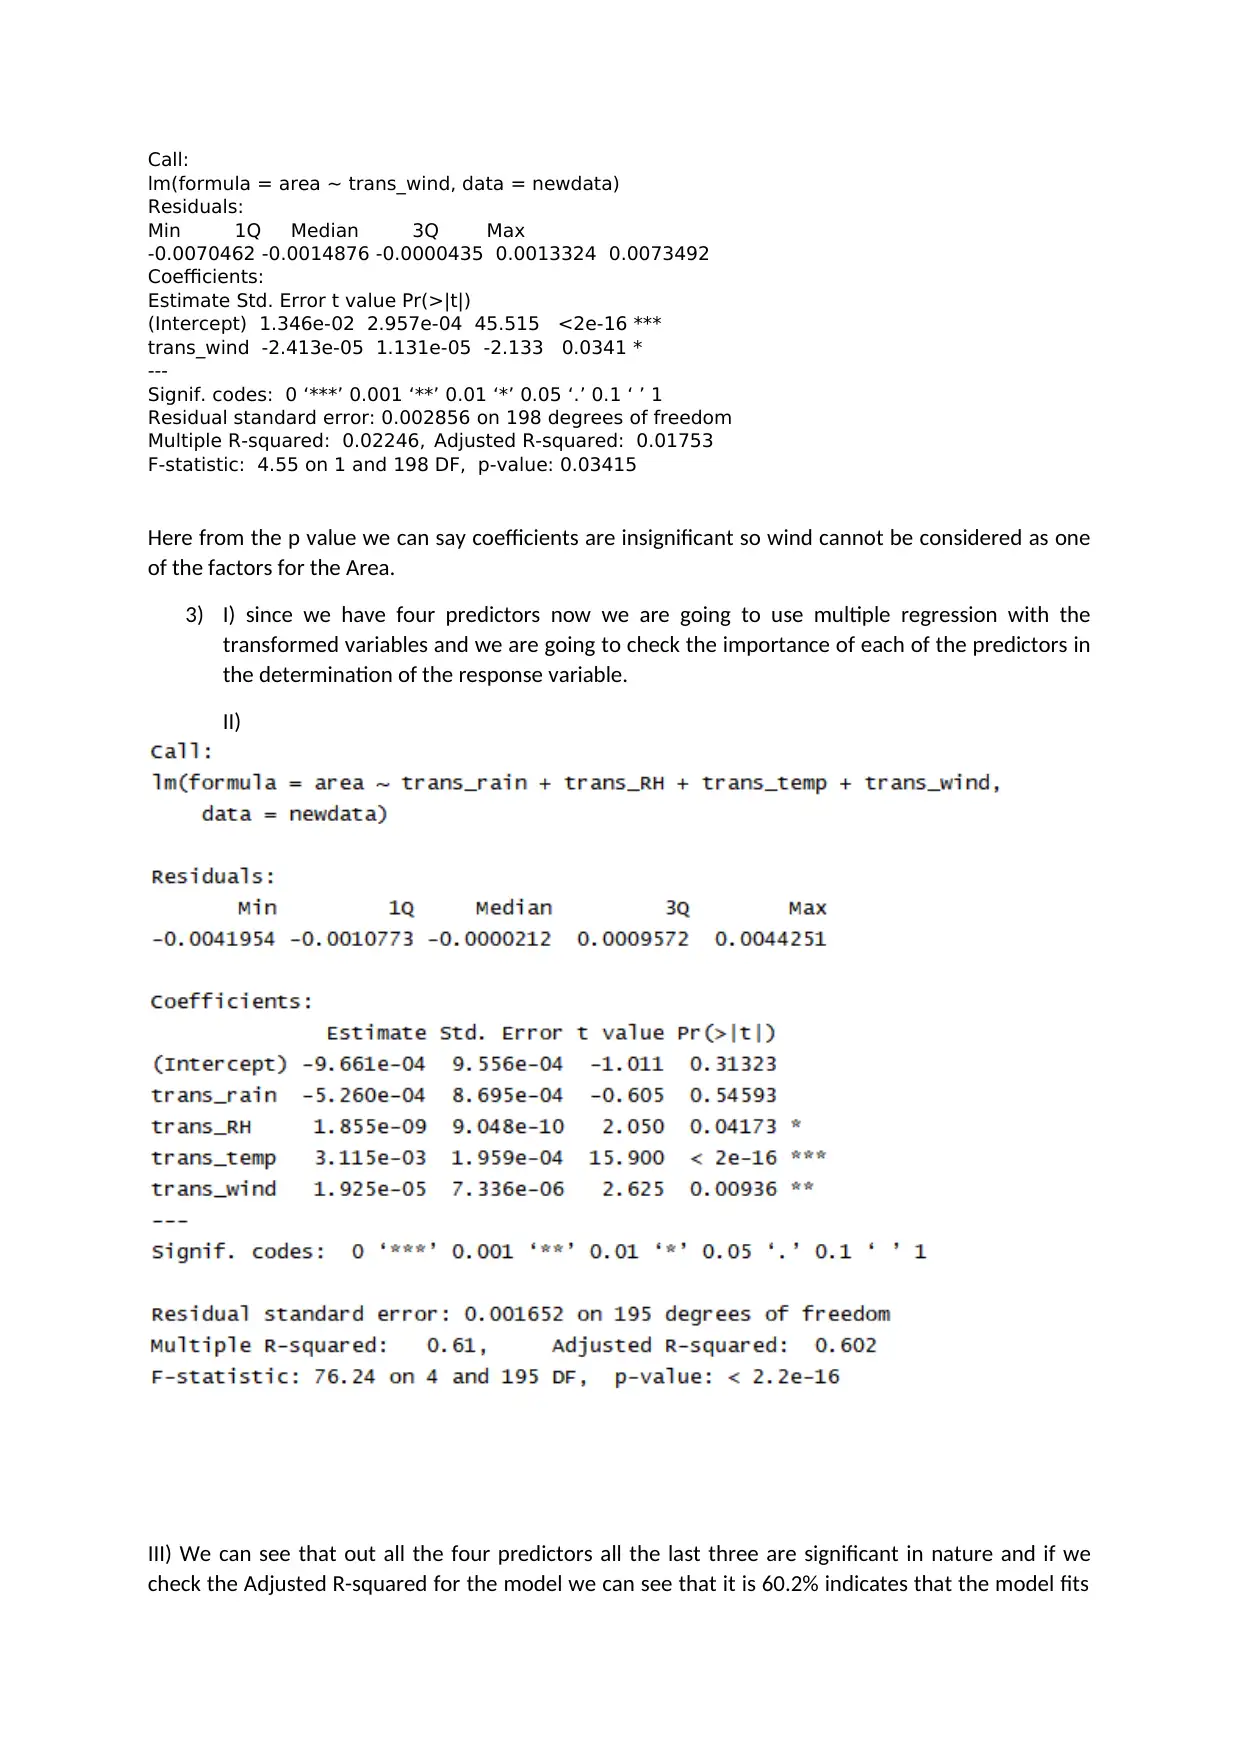
This assignment focuses on analyzing a forest fire dataset using R programming. The solution begins with data loading, cleaning, and exploratory data analysis, including scatter plots and histograms to visualize relationships between variables like temperature, wind, relative humidity, rain, and area burned. The analysis then proceeds to data transformation to address skewness in the data. Multiple linear regression models are developed to predict the area affected by the fire, considering transformed variables. The solution includes model evaluation, interpretation of coefficients, and assessment of model fit using metrics like R-squared and residual analysis. It explores the significance of different predictors (temperature, relative humidity, wind, and rain) on the area affected by the fire. Finally, it discusses the influence of individual data points, the trade-off between bias and variance in model fitting, and prediction of the area burned based on given input values.
1 out of 7


Your All-in-One AI-Powered Toolkit for Academic Success.
+13062052269
info@desklib.com
Available 24*7 on WhatsApp / Email
![[object Object]](/_next/static/media/star-bottom.7253800d.svg)
Copyright © 2020–2025 A2Z Services. All Rights Reserved. Developed and managed by ZUCOL.