Ask a question from expert
Securities Valuation and Equity Trading PDF
46 Pages11484 Words279 Views
Added on 2020-12-09
Securities Valuation and Equity Trading PDF
Added on 2020-12-09
BookmarkShareRelated Documents
VALUATION OFSECURITIES AND EQUITYTRADING
TABLE OF CONTENTSINTRODUCTION...........................................................................................................................1PART A...........................................................................................................................................11. Computing average monthly returns..................................................................................12. Measuring average monthly return and risk.......................................................................23. Determining annualised returns and risks..........................................................................54. Analysing the Beta of each shares....................................................................................105. Preparing graphical presentation of risk and return.........................................................116. Creating proportion, risk and return of minimum variance portfolio...............................137. Risk aversion coefficient and preparing charts................................................................148. Measuring combination of shares in portfolios................................................................16PART B..........................................................................................................................................16Critically analysing portfolio diversification and protecting the investors from unpredictabilityof capital market...................................................................................................................16CONCLUSION..............................................................................................................................17REFERENCES..............................................................................................................................18APPENDIX....................................................................................................................................19
INTRODUCTIONSecurity valuation depends on the performance of organisation in the market whichenables managerial professionals to retain fruitful gains for the period. Ascertaining the ups anddowns in value of share prices will have impacts over valuation of firm. In the present report,there will be analysis based on investigating market value of 5 shares such as Tesco, Barclays,BP, Marks and Spencer and Burberry. These shares will be analysed as per their rate of return aswell as compatibility through portfolio analysis. Moreover, report will have discussion based onimpacts of keeping a portfolio in the organisation. Therefore, there will be various advantagesand disadvantages analysed and discussed as per having suitable determination of all facts.PART A1. Computing average monthly returnsFor assessing monthly returns current monthly share price has been evaluated in against tothe previous figures. Moreover, in consideration with analysing the average monthly returns datapertaining to the companies such as Tesco, Barclays, BP, Marks and Spencer and Burberry hasbeen analysed for the period of 1st January 2011 to 20th June 2018. In addition, referring to thebelow listed appendix there has been analysis of all the share and marketable securities of theseorganisations. Summing up the rate of return payable by these organisations can be seen as:Rate of returnTesco-24.82%Barclays19.46%BP55.48%Marks and Spencer33.74%Burberry112.05%FTSE35.76%Interpretation: On the basis of above mentioned summarized information regarding rateof return payable by these organisations and the capital market, it can be said that Burberry hasthe most favourable outcomes. Along with this, Tesco has comparatively poor performancewhich reflects in the negative outcomes. Therefore, several times negative outcomes have beengenerated which in turn places negative impact on profit margin. Thus, there is need to have1
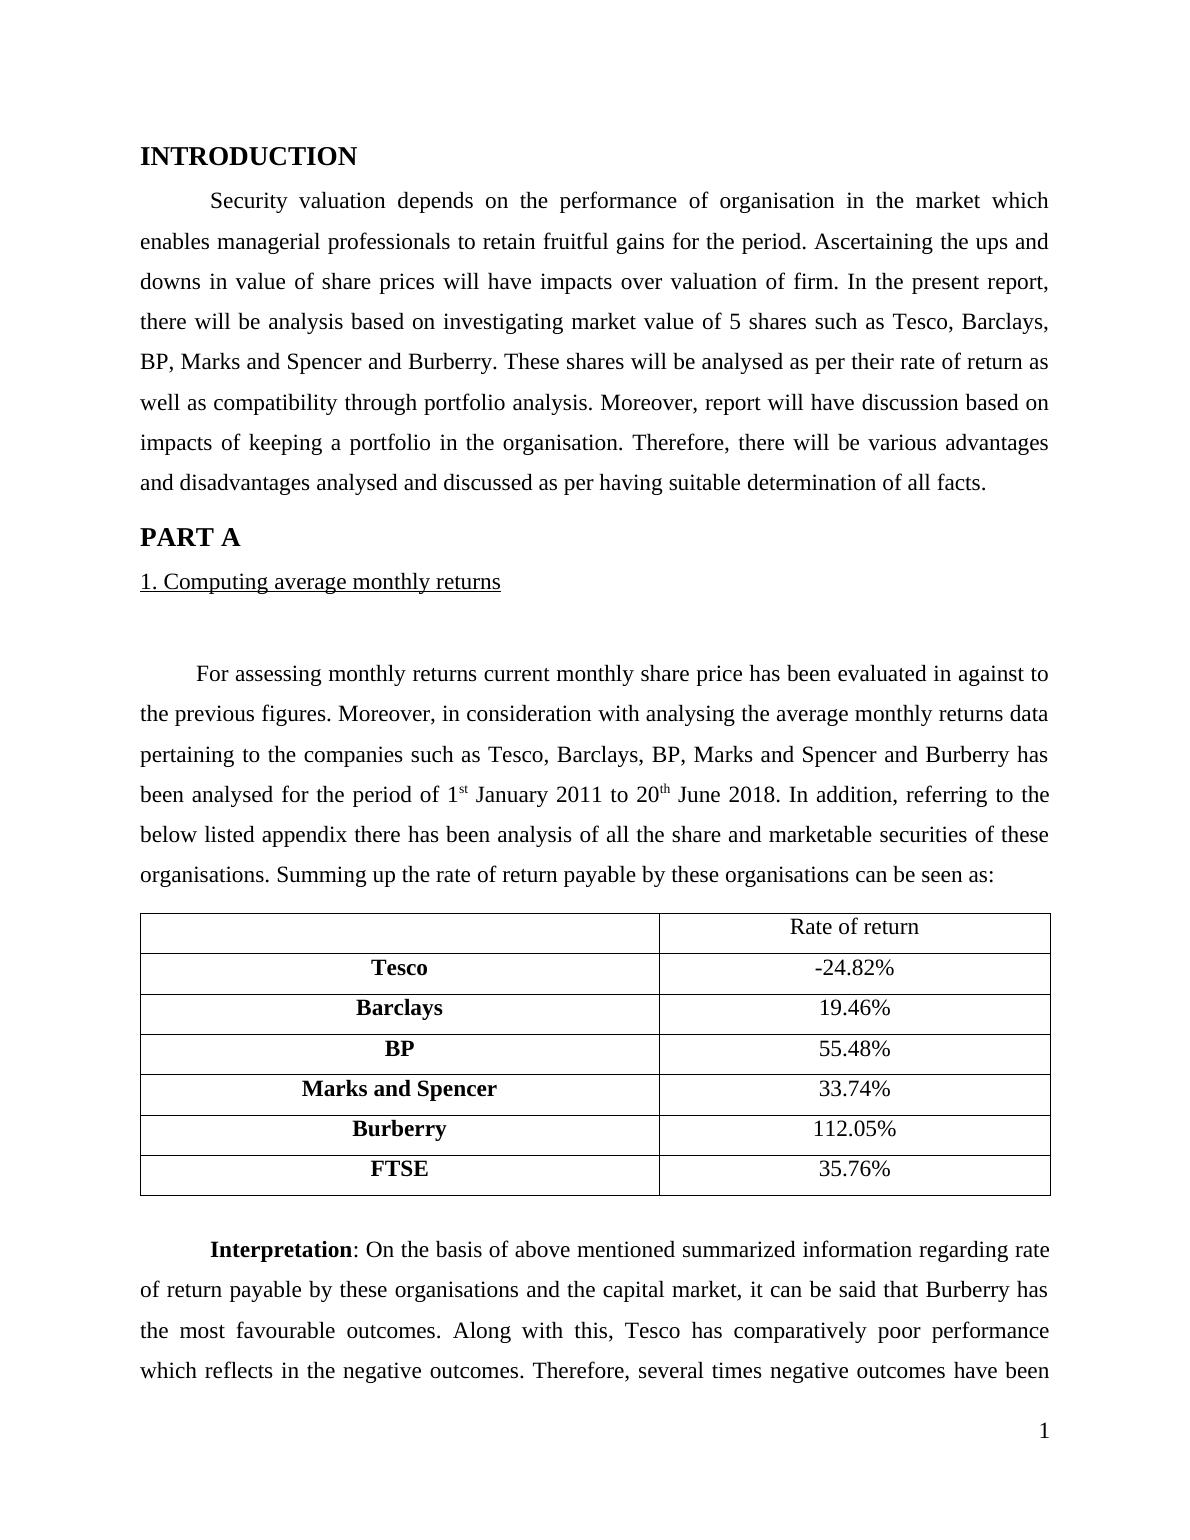
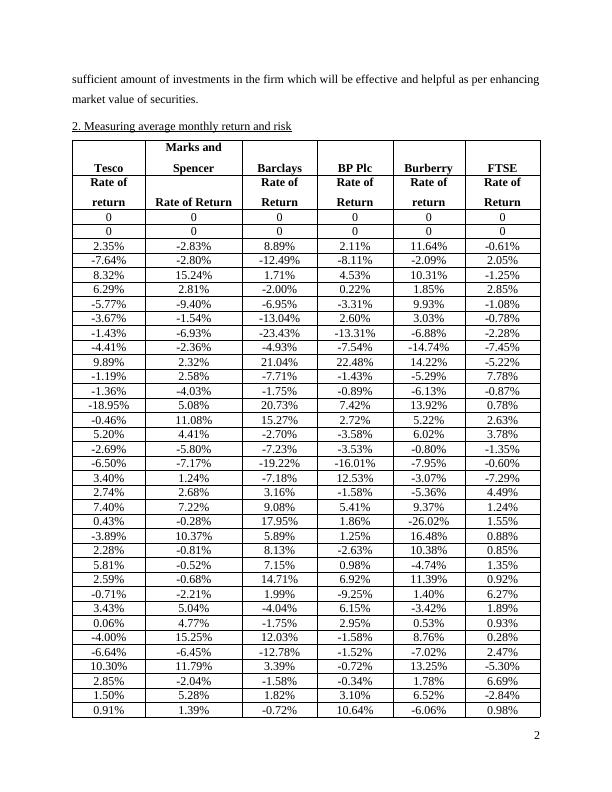
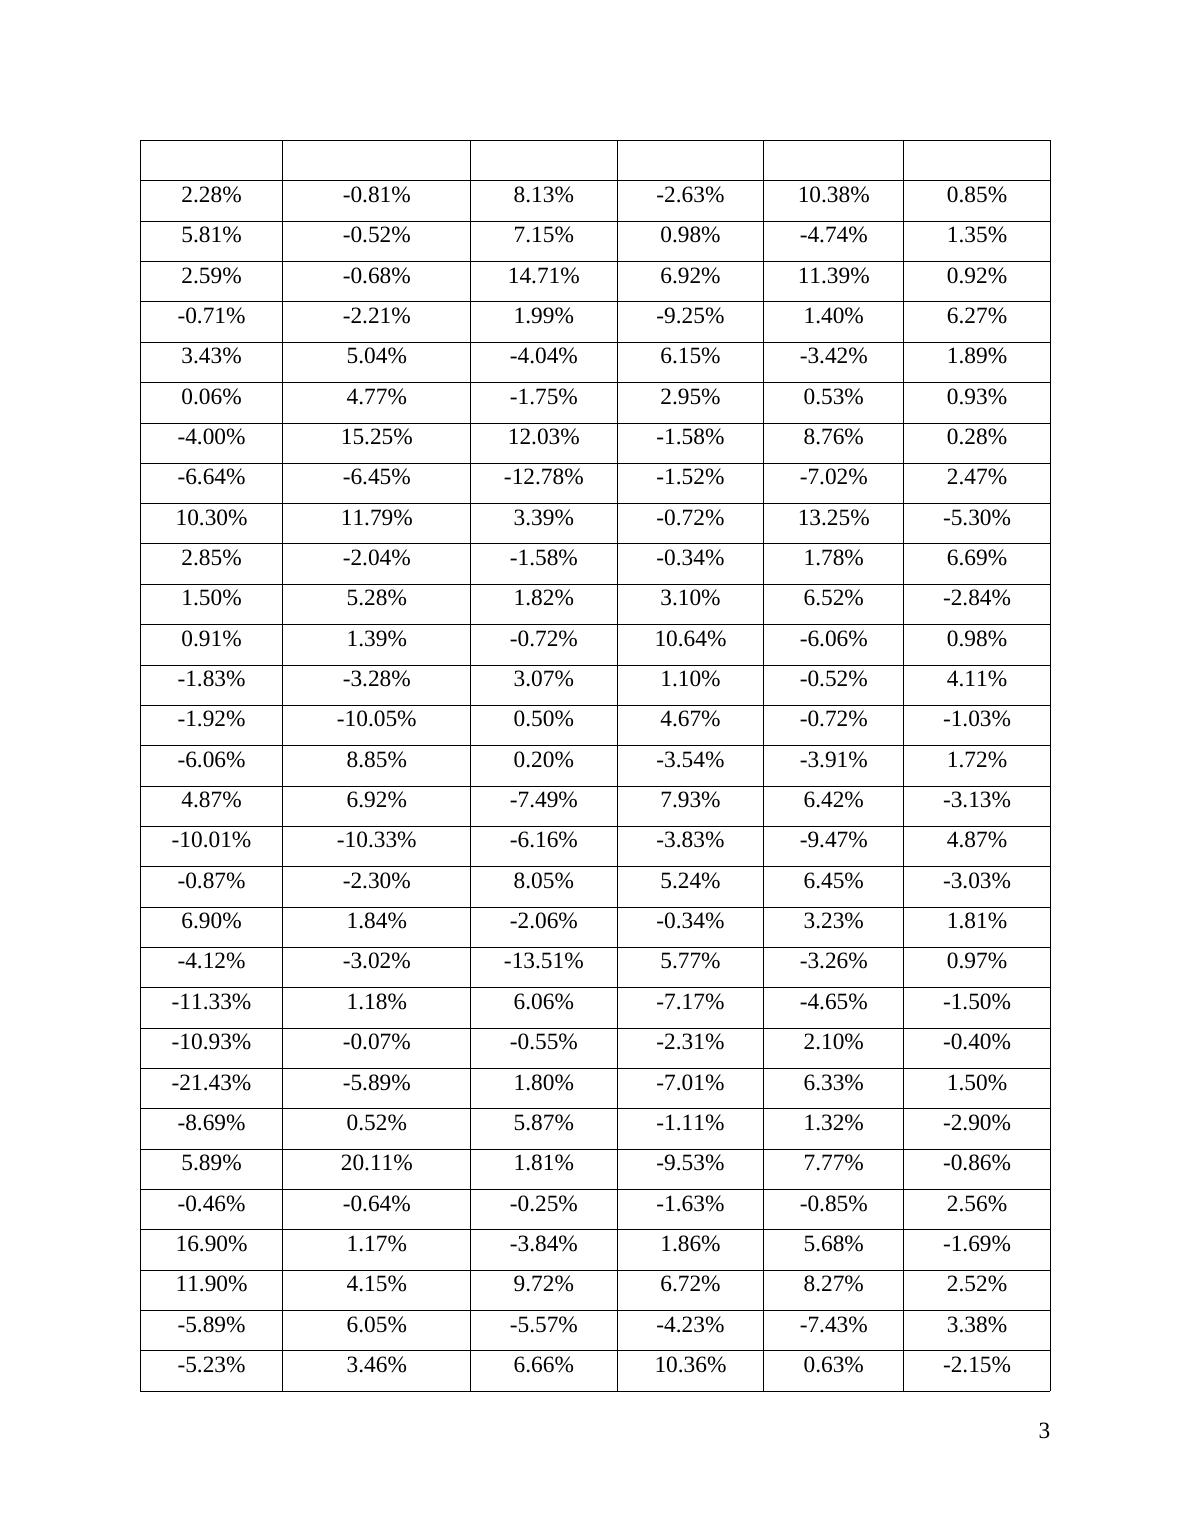
sufficient amount of investments in the firm which will be effective and helpful as per enhancingmarket value of securities.2. Measuring average monthly return and riskTescoMarks andSpencerBarclaysBP PlcBurberryFTSERate ofreturnRate of ReturnRate ofReturnRate ofReturnRate ofreturnRate ofReturn0000000000002.35%-2.83%8.89%2.11%11.64%-0.61%-7.64%-2.80%-12.49%-8.11%-2.09%2.05%8.32%15.24%1.71%4.53%10.31%-1.25%6.29%2.81%-2.00%0.22%1.85%2.85%-5.77%-9.40%-6.95%-3.31%9.93%-1.08%-3.67%-1.54%-13.04%2.60%3.03%-0.78%-1.43%-6.93%-23.43%-13.31%-6.88%-2.28%-4.41%-2.36%-4.93%-7.54%-14.74%-7.45%9.89%2.32%21.04%22.48%14.22%-5.22%-1.19%2.58%-7.71%-1.43%-5.29%7.78%-1.36%-4.03%-1.75%-0.89%-6.13%-0.87%-18.95%5.08%20.73%7.42%13.92%0.78%-0.46%11.08%15.27%2.72%5.22%2.63%5.20%4.41%-2.70%-3.58%6.02%3.78%-2.69%-5.80%-7.23%-3.53%-0.80%-1.35%-6.50%-7.17%-19.22%-16.01%-7.95%-0.60%3.40%1.24%-7.18%12.53%-3.07%-7.29%2.74%2.68%3.16%-1.58%-5.36%4.49%7.40%7.22%9.08%5.41%9.37%1.24%0.43%-0.28%17.95%1.86%-26.02%1.55%-3.89%10.37%5.89%1.25%16.48%0.88%2.28%-0.81%8.13%-2.63%10.38%0.85%5.81%-0.52%7.15%0.98%-4.74%1.35%2.59%-0.68%14.71%6.92%11.39%0.92%-0.71%-2.21%1.99%-9.25%1.40%6.27%3.43%5.04%-4.04%6.15%-3.42%1.89%0.06%4.77%-1.75%2.95%0.53%0.93%-4.00%15.25%12.03%-1.58%8.76%0.28%-6.64%-6.45%-12.78%-1.52%-7.02%2.47%10.30%11.79%3.39%-0.72%13.25%-5.30%2.85%-2.04%-1.58%-0.34%1.78%6.69%1.50%5.28%1.82%3.10%6.52%-2.84%0.91%1.39%-0.72%10.64%-6.06%0.98%2
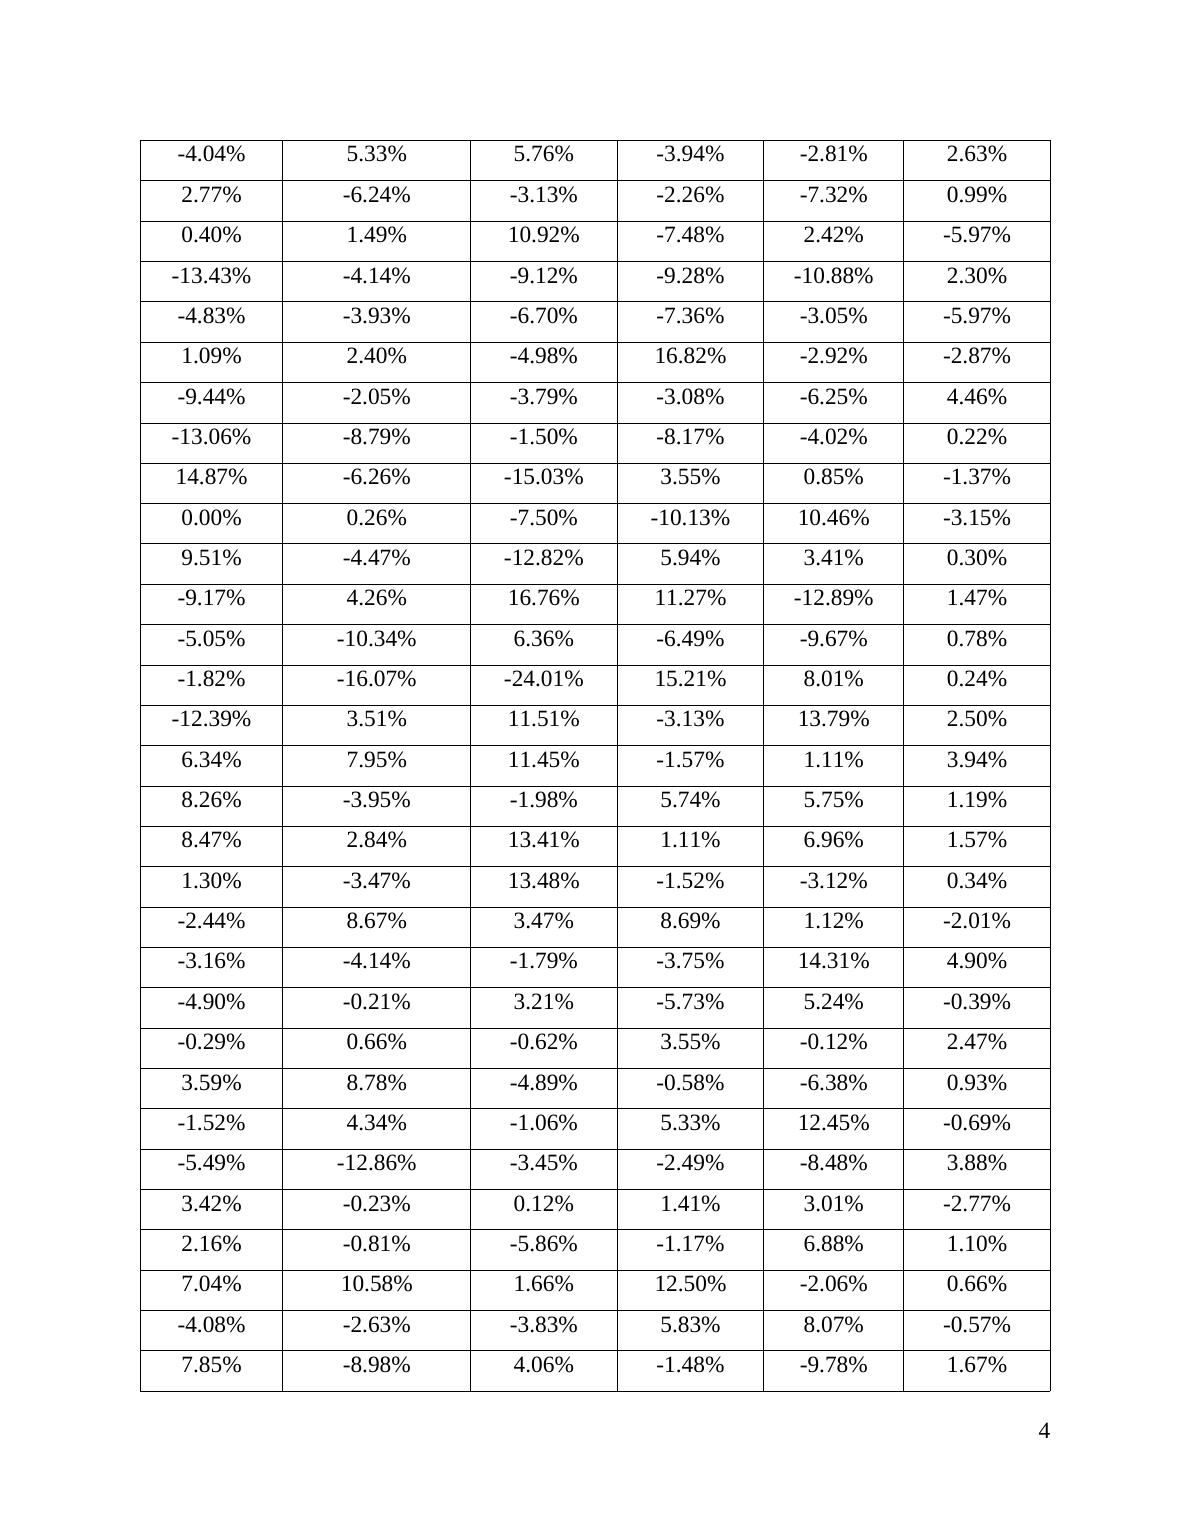
-1.83%-3.28%3.07%1.10%-0.52%4.11%-1.92%-10.05%0.50%4.67%-0.72%-1.03%-6.06%8.85%0.20%-3.54%-3.91%1.72%4.87%6.92%-7.49%7.93%6.42%-3.13%-10.01%-10.33%-6.16%-3.83%-9.47%4.87%-0.87%-2.30%8.05%5.24%6.45%-3.03%6.90%1.84%-2.06%-0.34%3.23%1.81%-4.12%-3.02%-13.51%5.77%-3.26%0.97%-11.33%1.18%6.06%-7.17%-4.65%-1.50%-10.93%-0.07%-0.55%-2.31%2.10%-0.40%-21.43%-5.89%1.80%-7.01%6.33%1.50%-8.69%0.52%5.87%-1.11%1.32%-2.90%5.89%20.11%1.81%-9.53%7.77%-0.86%-0.46%-0.64%-0.25%-1.63%-0.85%2.56%16.90%1.17%-3.84%1.86%5.68%-1.69%11.90%4.15%9.72%6.72%8.27%2.52%-5.89%6.05%-5.57%-4.23%-7.43%3.38%-5.23%3.46%6.66%10.36%0.63%-2.15%-4.04%5.33%5.76%-3.94%-2.81%2.63%2.77%-6.24%-3.13%-2.26%-7.32%0.99%0.40%1.49%10.92%-7.48%2.42%-5.97%-13.43%-4.14%-9.12%-9.28%-10.88%2.30%-4.83%-3.93%-6.70%-7.36%-3.05%-5.97%1.09%2.40%-4.98%16.82%-2.92%-2.87%-9.44%-2.05%-3.79%-3.08%-6.25%4.46%-13.06%-8.79%-1.50%-8.17%-4.02%0.22%14.87%-6.26%-15.03%3.55%0.85%-1.37%0.00%0.26%-7.50%-10.13%10.46%-3.15%9.51%-4.47%-12.82%5.94%3.41%0.30%-9.17%4.26%16.76%11.27%-12.89%1.47%-5.05%-10.34%6.36%-6.49%-9.67%0.78%-1.82%-16.07%-24.01%15.21%8.01%0.24%-12.39%3.51%11.51%-3.13%13.79%2.50%6.34%7.95%11.45%-1.57%1.11%3.94%8.26%-3.95%-1.98%5.74%5.75%1.19%8.47%2.84%13.41%1.11%6.96%1.57%1.30%-3.47%13.48%-1.52%-3.12%0.34%-2.44%8.67%3.47%8.69%1.12%-2.01%-3.16%-4.14%-1.79%-3.75%14.31%4.90%-4.90%-0.21%3.21%-5.73%5.24%-0.39%-0.29%0.66%-0.62%3.55%-0.12%2.47%3.59%8.78%-4.89%-0.58%-6.38%0.93%-1.52%4.34%-1.06%5.33%12.45%-0.69%-5.49%-12.86%-3.45%-2.49%-8.48%3.88%3
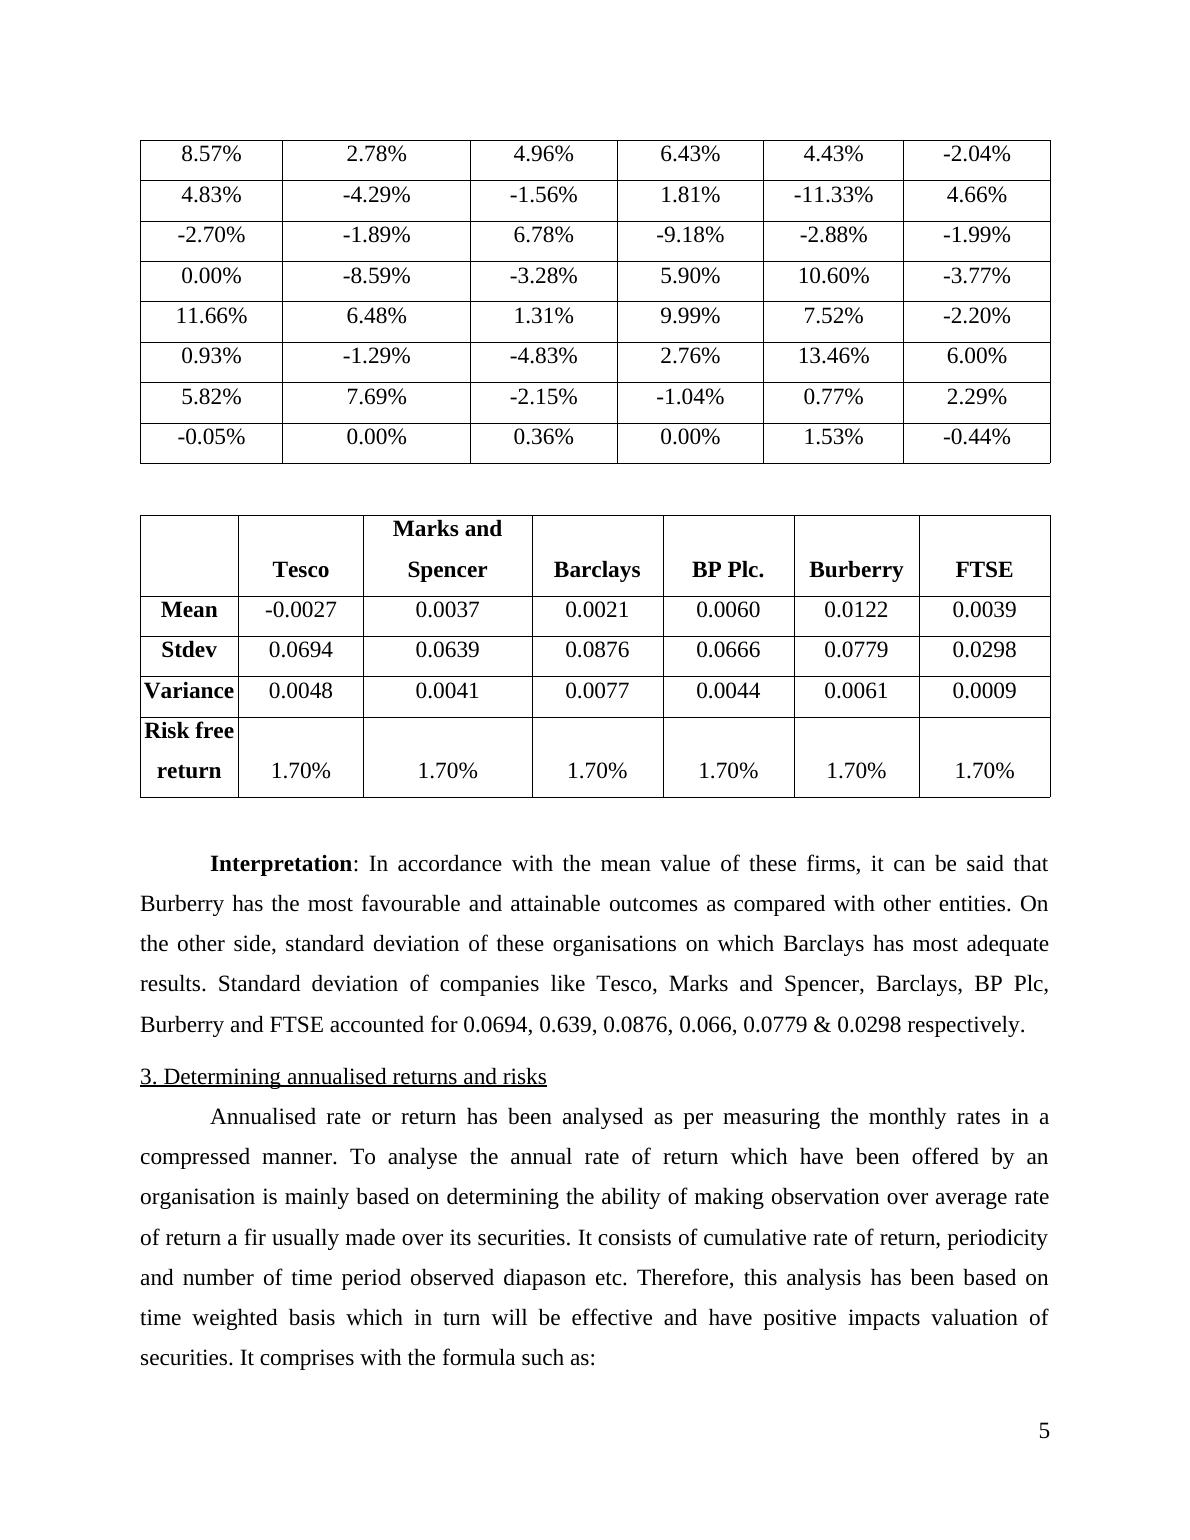
3.42%-0.23%0.12%1.41%3.01%-2.77%2.16%-0.81%-5.86%-1.17%6.88%1.10%7.04%10.58%1.66%12.50%-2.06%0.66%-4.08%-2.63%-3.83%5.83%8.07%-0.57%7.85%-8.98%4.06%-1.48%-9.78%1.67%8.57%2.78%4.96%6.43%4.43%-2.04%4.83%-4.29%-1.56%1.81%-11.33%4.66%-2.70%-1.89%6.78%-9.18%-2.88%-1.99%0.00%-8.59%-3.28%5.90%10.60%-3.77%11.66%6.48%1.31%9.99%7.52%-2.20%0.93%-1.29%-4.83%2.76%13.46%6.00%5.82%7.69%-2.15%-1.04%0.77%2.29%-0.05%0.00%0.36%0.00%1.53%-0.44%TescoMarks andSpencerBarclaysBP Plc.BurberryFTSEMean-0.00270.00370.00210.00600.01220.0039Stdev0.06940.06390.08760.06660.07790.0298Variance0.00480.00410.00770.00440.00610.0009Risk freereturn 1.70%1.70%1.70%1.70%1.70%1.70%Interpretation: In accordance with the mean value of these firms, it can be said thatBurberry has the most favourable and attainable outcomes as compared with other entities. Onthe other side, standard deviation of these organisations on which Barclays has most adequateresults. Standard deviation of companies like Tesco, Marks and Spencer, Barclays, BP Plc,Burberry and FTSE accounted for 0.0694, 0.639, 0.0876, 0.066, 0.0779 & 0.0298 respectively.3. Determining annualised returns and risksAnnualised rate or return has been analysed as per measuring the monthly rates in acompressed manner. To analyse the annual rate of return which have been offered by anorganisation is mainly based on determining the ability of making observation over average rateof return a fir usually made over its securities. It consists of cumulative rate of return, periodicityand number of time period observed diapason etc. Therefore, this analysis has been based ontime weighted basis which in turn will be effective and have positive impacts valuation ofsecurities. It comprises with the formula such as:4
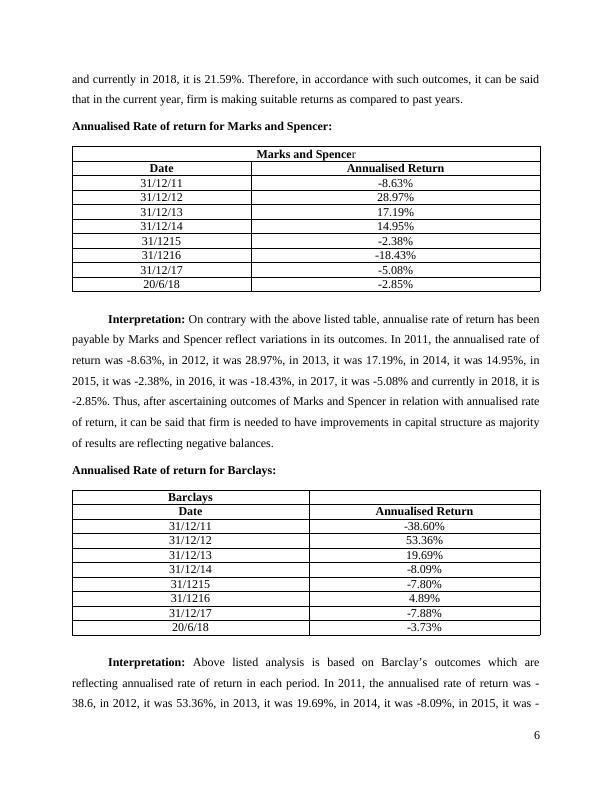
However, for analysing annualised rate of return for all the concerned five securities andFTSE evaluation has been done and mentioned in Appendix 2.Annualised Rate of return for Tesco:TESCO PLCDateAnnualised Return31/12/11-0.29%31/12/12-7.97%31/12/135.71%31/12/14-46.21%31/1215-24.25%31/121615.17%31/12/1712.46%20/6/1821.59%Interpretation: By considering the operational activities of firm it can be presented thatin 2011, the annualised rate of return was -0.29, in 2012, it was -7.97%, in 2013, it was 5.71%, in2014, it was -46.21%, in 2015, it was -24.25%, in 2016, it was 15.17%, in 2017, it was 12.46%5
and currently in 2018, it is 21.59%. Therefore, in accordance with such outcomes, it can be saidthat in the current year, firm is making suitable returns as compared to past years.Annualised Rate of return for Marks and Spencer:Marks and SpencerDateAnnualised Return31/12/11-8.63%31/12/1228.97%31/12/1317.19%31/12/1414.95%31/1215-2.38%31/1216-18.43%31/12/17-5.08%20/6/18-2.85%Interpretation: On contrary with the above listed table, annualise rate of return has beenpayable by Marks and Spencer reflect variations in its outcomes. In 2011, the annualised rate ofreturn was -8.63%, in 2012, it was 28.97%, in 2013, it was 17.19%, in 2014, it was 14.95%, in2015, it was -2.38%, in 2016, it was -18.43%, in 2017, it was -5.08% and currently in 2018, it is-2.85%. Thus, after ascertaining outcomes of Marks and Spencer in relation with annualised rateof return, it can be said that firm is needed to have improvements in capital structure as majorityof results are reflecting negative balances.Annualised Rate of return for Barclays:BarclaysDateAnnualised Return31/12/11-38.60%31/12/1253.36%31/12/1319.69%31/12/14-8.09%31/1215-7.80%31/12164.89%31/12/17-7.88%20/6/18-3.73%Interpretation: Above listed analysis is based on Barclay’s outcomes which arereflecting annualised rate of return in each period. In 2011, the annualised rate of return was -38.6, in 2012, it was 53.36%, in 2013, it was 19.69%, in 2014, it was -8.09%, in 2015, it was -6
End of preview
Want to access all the pages? Upload your documents or become a member.
Related Documents
Portfolio Analysis Report for Deskliblg...
|16
|3626
|448
(Pdf) Finance Assessment Report: Australian Stock Exchange Limited / ASX Futures Exchange Limited 2022lg...
|19
|4604
|58
Hypothesis Testing and Essaylg...
|26
|9312
|28
Financial Markets and Portfolio Management AAF0406lg...
|9
|2908
|313