BIOL 1010 Biology Assignment (PDF)
Added on 2021-11-16
36 Pages17033 Words42 Views
See discussions, stats, and author profiles for this publication at: https://www.researchgate.net/publication/317313069
Biodiversity-Threats and Conservation
Chapter · March 2017
CITATIONS
0
READS
4,589
3 authors, including:
Some of the authors of this publication are also working on these related projects:
Post Harvest View project
Hybrid development View project
Shailesh Kumar Singh
Lovely Professional University
50 PUBLICATIONS 38 CITATIONS
SEE PROFILE
Madhu Sharma
Punjab Agricultural University
35 PUBLICATIONS 32 CITATIONS
SEE PROFILE
All content following this page was uploaded by Shailesh Kumar Singh on 02 June 2017.
The user has requested enhancement of the downloaded file.
282 Environ. Sci. & Engg. Vol. 2:Biodiversity and Conservation
1 Department of Horticulture, School of Agriculture, Lovely Professional University,
Jalandhar, Punjab, India.2 Department of Horticulture, School of Agriculture, Lovely Professional University,
Jalandhar, Punjab, India.3 Department of Biology, Happy Model School, Varanasi, UP, India.
*Corresponding author: E-mail: lpushailesh@gmail.com
14
Biodiversity-Threats and Conservation
SHAILESH KUMAR SINGH 1*, MADHU SHARMA 2 AND ANJANA PANDEY 3
ABSTRACT
The biodiversity, diversity in life forms, suffers greater threat from
degradation, habitat fragmentation; spreading of invasive species;
indiscriminate use of natural resources; climate change; pollution within
aquatic environment and water flows. Biological resources serve about 40
per cent of the world’s economy and nearly, 80 per cent of the needs of the
people. It provides greater opportunity in the field of medical, research,
education, and economic development. Declining biodiversity is, therefore,
a concern for countless reasons. Preserving species in their habitats is the
in-situ conservation and includes identification of biological hot spots to
protect them as Natural Park/sanctuary/biosphere reserve etc. The ex-situ
conservation includes developing gene banks, zoos and botanical garden,
cryopreservation, artificial propagation of plants, biotechnological approach
etc. Genetic manipulation of the endangered and threatened species can be
the effective tool for maintaining biodiversity.
Key words:Ecosystems, Rainforests, Coral reefs, Convention on Biological
Diversity (CBD), Endangered, Threatened
INTRODUCTION
Biological diversity of the variability in life-forms on the Planet (Earth) is
called as biodiversity. Biodiversity is the existence of various life forms
283Biodiversity-Threats and Conservation
including strength of species of plant, animal and microorganism; the
strength and variability of genes in these taxa is the diverse ecosystems on
the Earth. The Convention on Biodiversity at UN CED (the United Nation
Conference on the Environment and Development), ‘The Earth Summit’ in
1992 had expressed biological diversity as “the variety and variability among
living organisms from all sources and the ecological complexes in which
they occur; this includes diversity within species, between species and of
ecosystem”[1]. The term biodiversity is supposed to be coined by W.G. Rosen
in 1985[1]. The term biodiversity was applied by socio-biologist Edward
Wilson to describe diversity at all storeys of biological organisation ranging
from intracellular macromolecules to biomes[2]. Biodiversity is a Greek word
and consists of bios means life and diversity means forms.
BIODIVERSITY STATUS
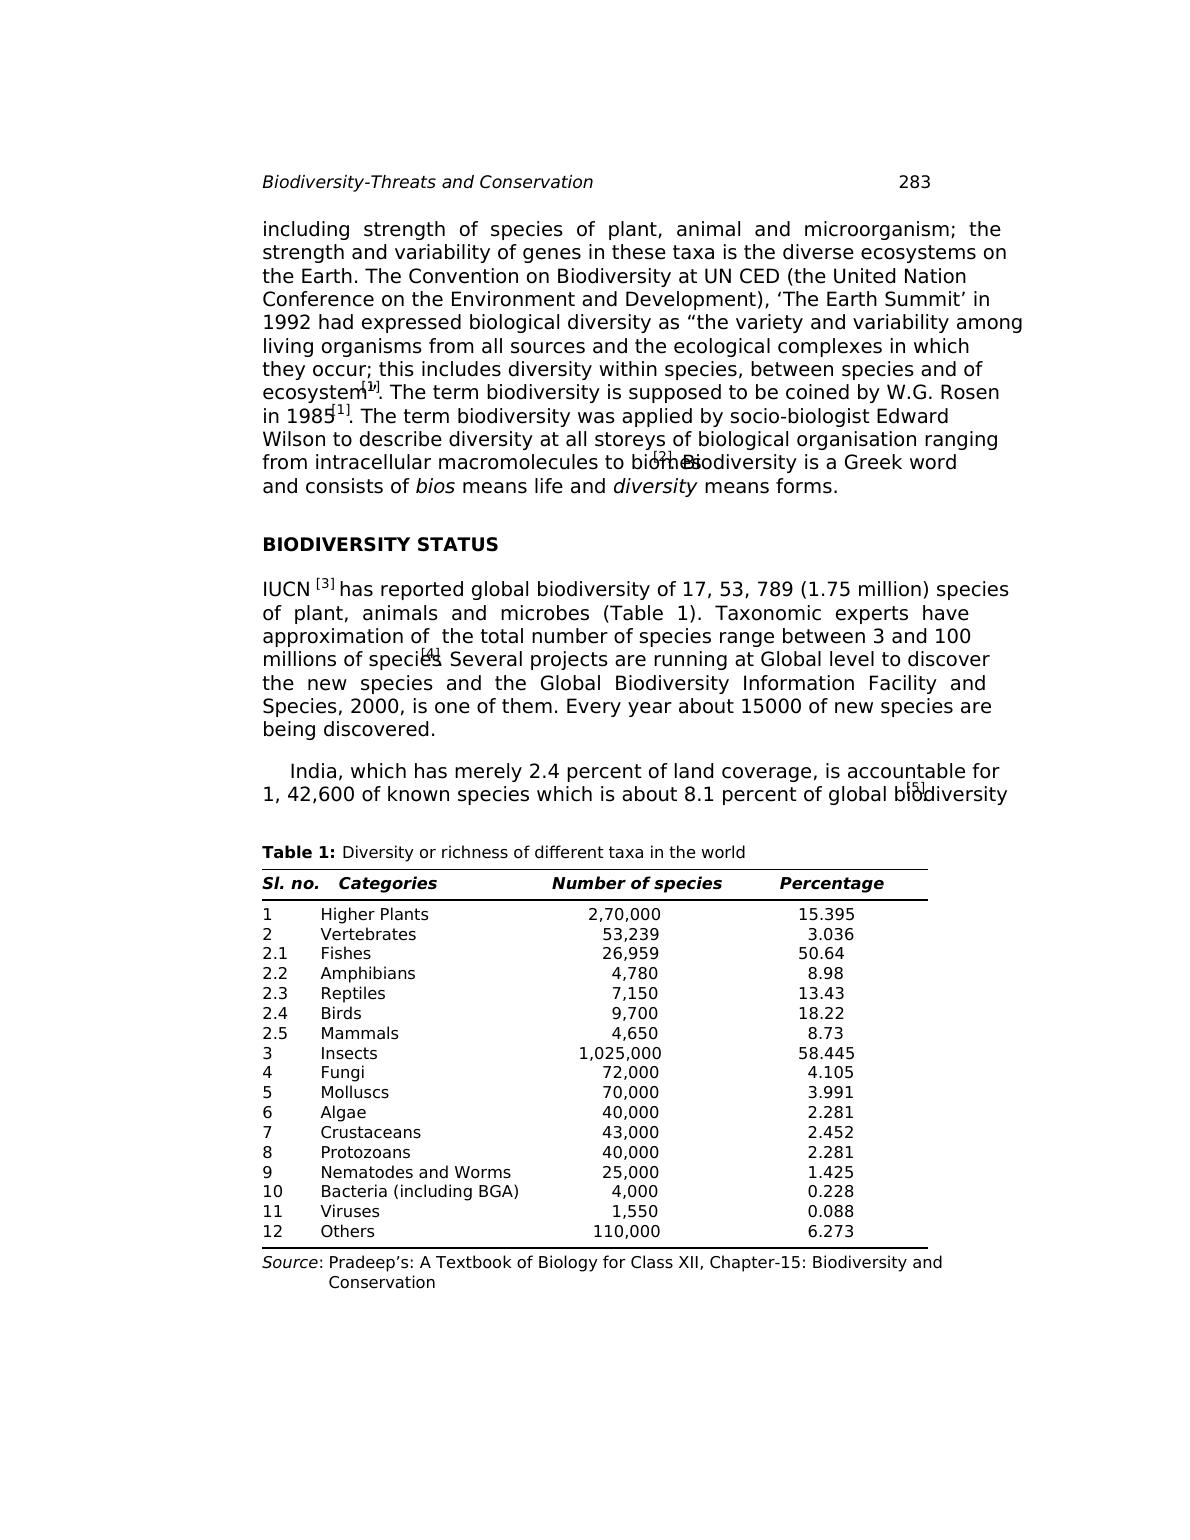
IUCN [3] has reported global biodiversity of 17, 53, 789 (1.75 million) species
of plant, animals and microbes (Table 1). Taxonomic experts have
approximation of the total number of species range between 3 and 100
millions of species[4]. Several projects are running at Global level to discover
the new species and the Global Biodiversity Information Facility and
Species, 2000, is one of them. Every year about 15000 of new species are
being discovered.
India, which has merely 2.4 percent of land coverage, is accountable for
1, 42,600 of known species which is about 8.1 percent of global biodiversity[5].
Table 1: Diversity or richness of different taxa in the world
Sl. no. Categories Number of species Percentage
1 Higher Plants 2,70,000 15.395
2 Vertebrates 53,239 3.036
2.1 Fishes 26,959 50.64
2.2 Amphibians 4,780 8.98
2.3 Reptiles 7,150 13.43
2.4 Birds 9,700 18.22
2.5 Mammals 4,650 8.73
3 Insects 1,025,000 58.445
4 Fungi 72,000 4.105
5 Molluscs 70,000 3.991
6 Algae 40,000 2.281
7 Crustaceans 43,000 2.452
8 Protozoans 40,000 2.281
9 Nematodes and Worms 25,000 1.425
10 Bacteria (including BGA) 4,000 0.228
11 Viruses 1,550 0.088
12 Others 110,000 6.273
Source: Pradeep’s: A Textbook of Biology for Class XII, Chapter-15: Biodiversity and
Conservation
including strength of species of plant, animal and microorganism; the
strength and variability of genes in these taxa is the diverse ecosystems on
the Earth. The Convention on Biodiversity at UN CED (the United Nation
Conference on the Environment and Development), ‘The Earth Summit’ in
1992 had expressed biological diversity as “the variety and variability among
living organisms from all sources and the ecological complexes in which
they occur; this includes diversity within species, between species and of
ecosystem”[1]. The term biodiversity is supposed to be coined by W.G. Rosen
in 1985[1]. The term biodiversity was applied by socio-biologist Edward
Wilson to describe diversity at all storeys of biological organisation ranging
from intracellular macromolecules to biomes[2]. Biodiversity is a Greek word
and consists of bios means life and diversity means forms.
BIODIVERSITY STATUS
IUCN [3] has reported global biodiversity of 17, 53, 789 (1.75 million) species
of plant, animals and microbes (Table 1). Taxonomic experts have
approximation of the total number of species range between 3 and 100
millions of species[4]. Several projects are running at Global level to discover
the new species and the Global Biodiversity Information Facility and
Species, 2000, is one of them. Every year about 15000 of new species are
being discovered.
India, which has merely 2.4 percent of land coverage, is accountable for
1, 42,600 of known species which is about 8.1 percent of global biodiversity[5].
Table 1: Diversity or richness of different taxa in the world
Sl. no. Categories Number of species Percentage
1 Higher Plants 2,70,000 15.395
2 Vertebrates 53,239 3.036
2.1 Fishes 26,959 50.64
2.2 Amphibians 4,780 8.98
2.3 Reptiles 7,150 13.43
2.4 Birds 9,700 18.22
2.5 Mammals 4,650 8.73
3 Insects 1,025,000 58.445
4 Fungi 72,000 4.105
5 Molluscs 70,000 3.991
6 Algae 40,000 2.281
7 Crustaceans 43,000 2.452
8 Protozoans 40,000 2.281
9 Nematodes and Worms 25,000 1.425
10 Bacteria (including BGA) 4,000 0.228
11 Viruses 1,550 0.088
12 Others 110,000 6.273
Source: Pradeep’s: A Textbook of Biology for Class XII, Chapter-15: Biodiversity and
Conservation
284 Environ. Sci. & Engg. Vol. 2:Biodiversity and Conservation
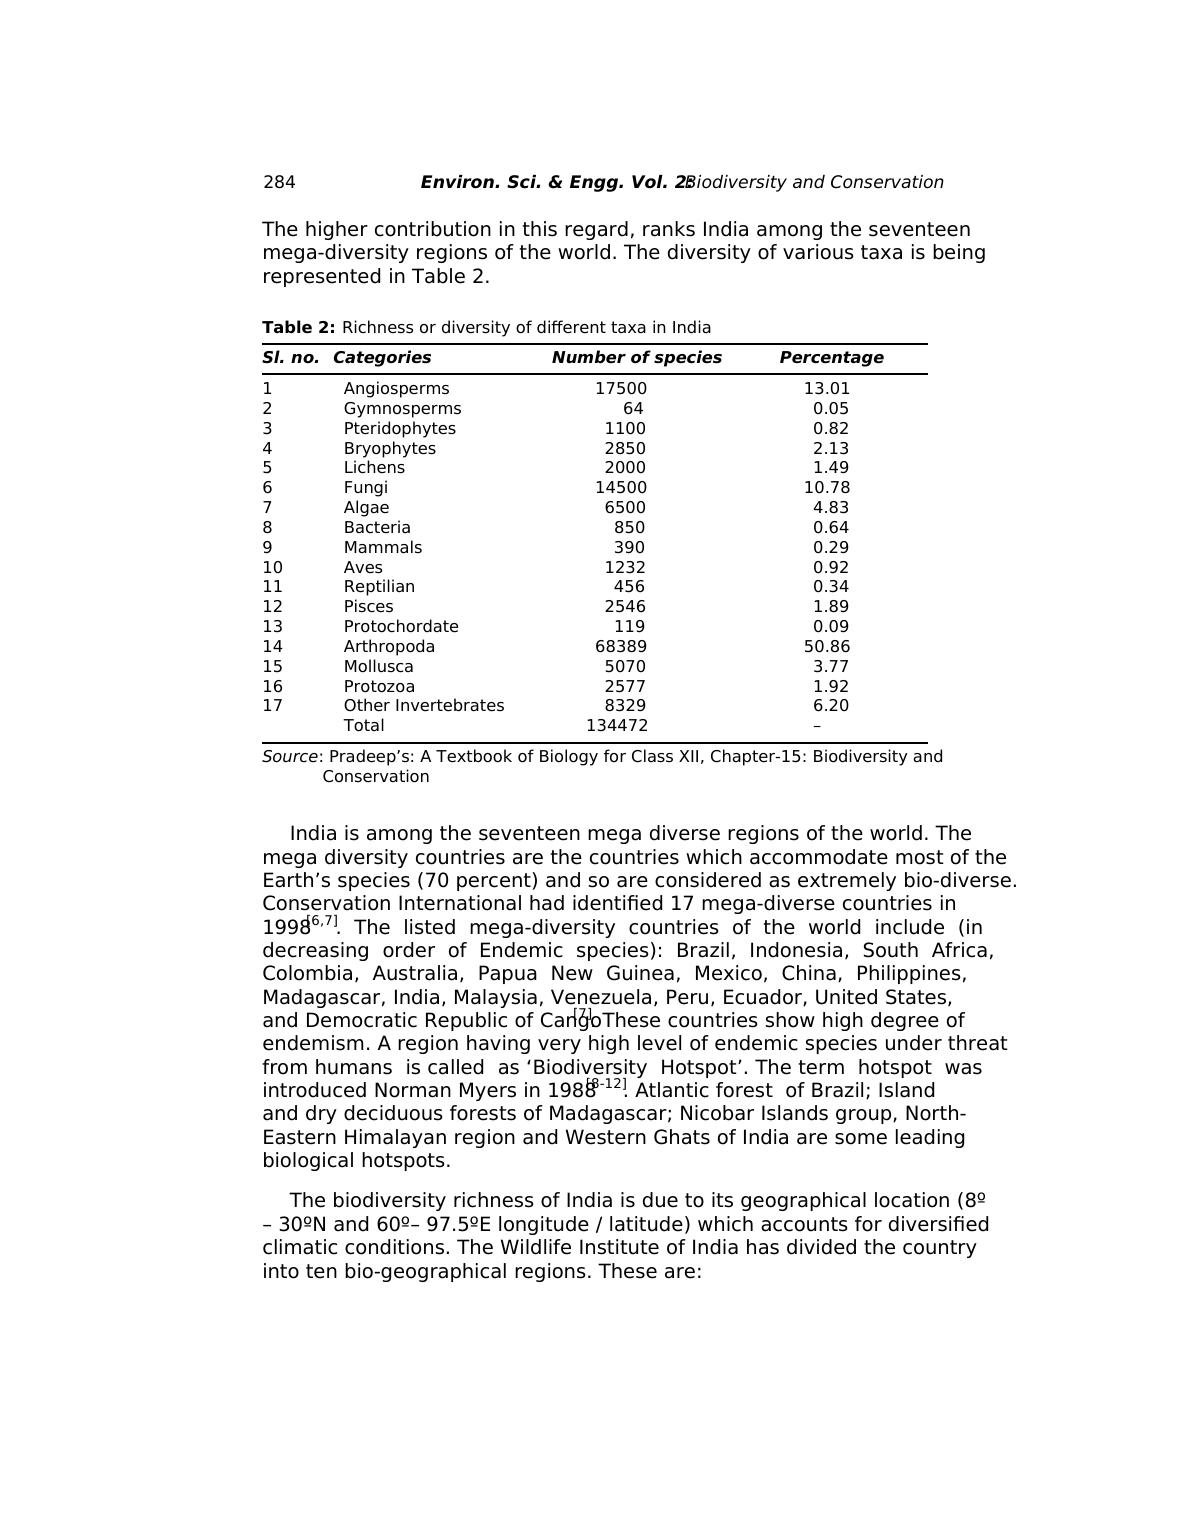
The higher contribution in this regard, ranks India among the seventeen
mega-diversity regions of the world. The diversity of various taxa is being
represented in Table 2.
Table 2: Richness or diversity of different taxa in India
Sl. no. Categories Number of species Percentage
1 Angiosperms 17500 13.01
2 Gymnosperms 64 0.05
3 Pteridophytes 1100 0.82
4 Bryophytes 2850 2.13
5 Lichens 2000 1.49
6 Fungi 14500 10.78
7 Algae 6500 4.83
8 Bacteria 850 0.64
9 Mammals 390 0.29
10 Aves 1232 0.92
11 Reptilian 456 0.34
12 Pisces 2546 1.89
13 Protochordate 119 0.09
14 Arthropoda 68389 50.86
15 Mollusca 5070 3.77
16 Protozoa 2577 1.92
17 Other Invertebrates 8329 6.20
Total 134472 –
Source: Pradeep’s: A Textbook of Biology for Class XII, Chapter-15: Biodiversity and
Conservation
India is among the seventeen mega diverse regions of the world. The
mega diversity countries are the countries which accommodate most of the
Earth’s species (70 percent) and so are considered as extremely bio-diverse.
Conservation International had identified 17 mega-diverse countries in
1998[6,7]. The listed mega-diversity countries of the world include (in
decreasing order of Endemic species): Brazil, Indonesia, South Africa,
Colombia, Australia, Papua New Guinea, Mexico, China, Philippines,
Madagascar, India, Malaysia, Venezuela, Peru, Ecuador, United States,
and Democratic Republic of Cango[7]. These countries show high degree of
endemism. A region having very high level of endemic species under threat
from humans is called as ‘Biodiversity Hotspot’. The term hotspot was
introduced Norman Myers in 1988[8-12]. Atlantic forest of Brazil; Island
and dry deciduous forests of Madagascar; Nicobar Islands group, North-
Eastern Himalayan region and Western Ghats of India are some leading
biological hotspots.
The biodiversity richness of India is due to its geographical location (8º
– 30ºN and 60º– 97.5ºE longitude / latitude) which accounts for diversified
climatic conditions. The Wildlife Institute of India has divided the country
into ten bio-geographical regions. These are:
285Biodiversity-Threats and Conservation
1. Trans-Himalayas (coldest desert)
2. Himalayas
3. Desert
4. Semiarid
5. Western Ghats (covers 4 percent of areas and is most biodiversity
rich region)
6. Deccan Peninsula (covers 42 percent of areas)
7. Gangetic Plain
8. North Eastern region (covers 5.2 percent of areas)
9. Coasts
10. Islands
MEASURMENT OF BIODIVERSITY
There are three inter-related hierarchies of biodiversity. These are:
1. Genetic diversity
2. Species diversity
3. Community or ecosystem diversity
Professor Anthony Campbell[13] added Molecular diversity as 4th level
in the hierarchy of Biodiversity. It is the diversity at the level of molecules
so cannot be isolated from genetic diversity but can be studied separately
to give specific significance.
Genetic Diversity
Genetic diversity denotes the diversity within the species. Living organisms
store a bulk of genetic information in form of nucleic acid (DNA and RNA).
The fragments of nucleic acids which code for a character is called as gene.
These genes are located on locus of chromosomes. The genetic makeup of
any two individuals is not identical so act as source of variation and bring
diversity within the species. The variation in the frequency and nature of
genes; their alleles; and the chromosomes present within the species is
called as genetic diversity.
The genetic differences among the individuals of same species is
accountable for differences in body designs which gives rise the various
intraspecific categories or polymorphs like sub-species, varieties, races,
strains, morphological types, ecological types, biotypes, etc. Some leading
examples of genetic diversity are:
1. India accommodates not less than 50,000 various strains of Oryza
sativa (Paddy) and 1000 varieties of Mangifera indica L. (mango).
286 Environ. Sci. & Engg. Vol. 2:Biodiversity and Conservation
2. There are several races of human like Mongoloid, Negrillo,
Protoaustraloid, etc.
3. Rauvolfia vomitoria (R. serpentina) has medicinal value due to
production of an active chemical called reserpine. The plants
growing in different Himalayan ranges show differences in
potency and concentration of reserpine which is result of genetic
diversity.
Genetic diversity is useful for survival of a species through adaptation
to changing environment. Environment plays a significant role in imparting
genetic diversity through mutations or alteration in the frequency of genes
which results in altered genotypes while through natural selection the most
suitable genotype is favoured to survive in the existing environment. This
accounts for formation of polymorphs in the sympatric populations, races
in allopatric populations and subspecies in the geographically isolated
populations. Thus, genetic diversity helps in speciation or evolution of new
species. Genetic diversity within a species depends on various factors like
number of genes, stability of genes against mutagens, environment and
isolation (geographical and reproductive).
Species Diversity
Species diversity is a degree of diversity that integrates both the number
of species in a group and extent of their relating abundance[14]. It is
measured at the level of species. The species of a genus show unique
biological status of reproductive isolation. The examples of diversity at
species level are:
1. Genus Panthera includes three species viz. P. tigris (tiger),
P. leo (lion) and P. uncia (snow leopard) which are different with
each other.
2. Genus Solanum includes many species including S. melongena
(Brinjal), S. tuberosum (Potato), S. lycopersicon (Tomato) and
S. nigrum (Makoe) which have characteristic differences at species
level.
Species diversity can be expressed as the function of species richness
and species evenness. Species richness can be defined as the number of
species per unit area[15-17], whereas, the number of individuals or relative
abundance of different species of a region represents species evenness or
species equitability[16,17]. Thus, variation in the number of species, types of
species and number of individuals per species of the given area leads to
greater species diversity. Odum et al.[18] suggested that species diversity
can be calculated as the number of species per thousand individuals while
Menhinick[19] expressed it as sum of species in relation to square root of
total number of individuals.
287Biodiversity-Threats and Conservation
Ecological diversity (Community and ecosystem diversity)
The ecosystem diversity refers to the variety of forms in the ecosystem due
to diversity of niches, trophic level and processes like nutrient recycling,
food webs, energy flow, role of dominant and key stone species and various
biotic interactions. Elton[20] reported that diversity helps in producing more
productive and stable ecosystems/communities which can tolerate various
stresses. Tilman[21,22] had confirmed the proposition of Elton by raising
plots with different diversity in minnesota grassland and subjecting them
to various stresses.
Whittaker [15,23,24] proposed three types of diversity to explain
community and ecosystem diversity, namely, alpha (), beta () and gamma
() diversity.
• Alpha diversity: (- index diversity) is the diversity within
community and refers to the species diversity in a given community
or habitat. Alpha diversity is represented by the two indices i.e.,
species richness and species evenness, in the combination.
• Beta diversity: (- index diversity) is the diversity between the
communities and appears in a range of communities due to
replacement of species along the complex-gradient of ecosystem or
habitats within a given geographical region. It is due to the presence
of different microhabitats, niches and differences in environmental
conditions. The - diversity is observed along altitude gradient,
moisture gradient or gradient of any other environmental factors.
Greater the heterogeneity in the habitats or between communities,
there will be greater -diversity.
• Gamma diversity: (- index diversity) refers to diversity present in
range of communities and is represented by diversity of habitats or
ecosystems over a total landscape or geographical area. Whittaker[23]
proposed that - diversity can be measured as the ratio between
regional diversity or -diversity and the average - diversity such
that = /±.
Reice[25] had reported that more perturbations and heterogeneity results
in more biodiversity which in turn make the ecosystem more stable and
sustainable. Tropical rain forest and coral reefs have fragile environment
and vulnerable habitats which accounts for the maximum biodiversity in
these regions even there is little seasonal changes of temperature and
moisture. In 1807, German naturalist and geographer Alexander von
Humboldt while exploring the South American forests reported that species
richness was increased within the region as area of exploration was
increased but only up to a certain extent[26]. A rectangular hyperbola is
obtained when the species richness of a wide variety of Texas was plotted
against the explored area. The mathematical expression of this relation is
S = CAZ, where, S is species richness, A represents area explored, Z is
288 Environ. Sci. & Engg. Vol. 2:Biodiversity and Conservation
regression coefficient and C is a constant for the given species. The
logarithmic scale gives straight line for the above expression.
log S = log C + Z log A
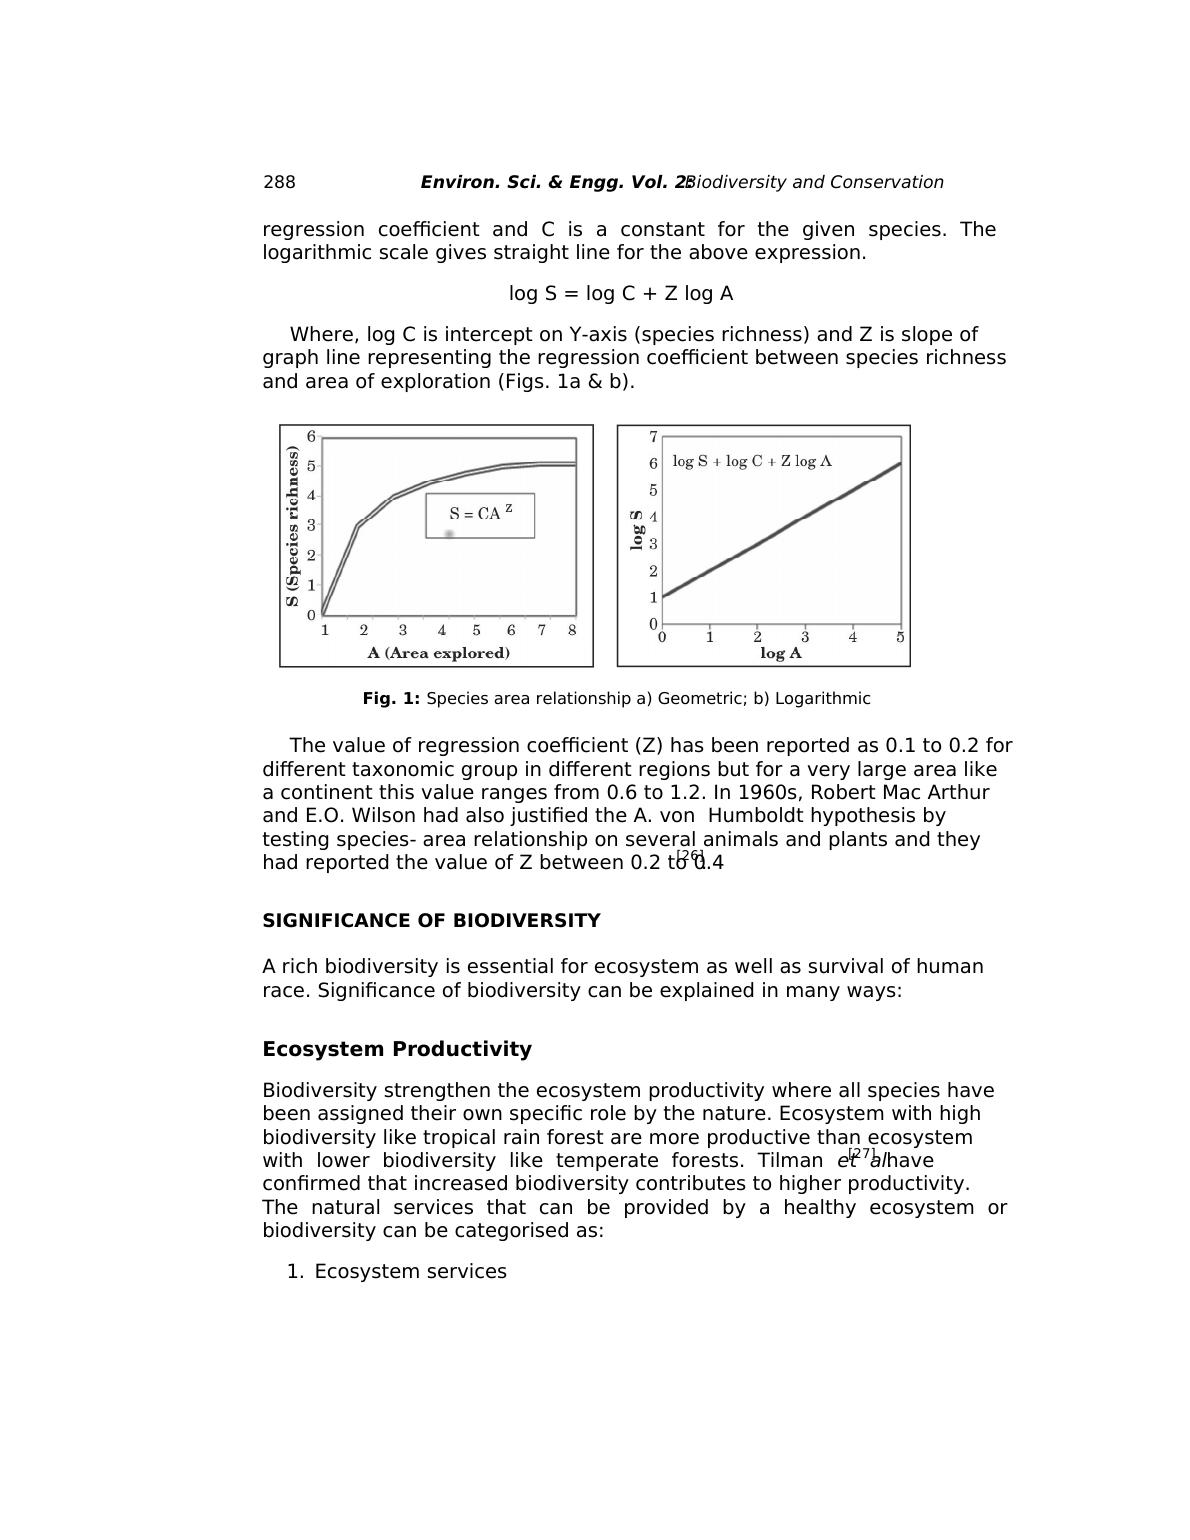
Where, log C is intercept on Y-axis (species richness) and Z is slope of
graph line representing the regression coefficient between species richness
and area of exploration (Figs. 1a & b).
The value of regression coefficient (Z) has been reported as 0.1 to 0.2 for
different taxonomic group in different regions but for a very large area like
a continent this value ranges from 0.6 to 1.2. In 1960s, Robert Mac Arthur
and E.O. Wilson had also justified the A. von Humboldt hypothesis by
testing species- area relationship on several animals and plants and they
had reported the value of Z between 0.2 to 0.4[26].
SIGNIFICANCE OF BIODIVERSITY
A rich biodiversity is essential for ecosystem as well as survival of human
race. Significance of biodiversity can be explained in many ways:
Ecosystem Productivity
Biodiversity strengthen the ecosystem productivity where all species have
been assigned their own specific role by the nature. Ecosystem with high
biodiversity like tropical rain forest are more productive than ecosystem
with lower biodiversity like temperate forests. Tilman et al.[27] have
confirmed that increased biodiversity contributes to higher productivity.
The natural services that can be provided by a healthy ecosystem or
biodiversity can be categorised as:
1. Ecosystem services
Fig. 1: Species area relationship a) Geometric; b) Logarithmic
regression coefficient and C is a constant for the given species. The
logarithmic scale gives straight line for the above expression.
log S = log C + Z log A
Where, log C is intercept on Y-axis (species richness) and Z is slope of
graph line representing the regression coefficient between species richness
and area of exploration (Figs. 1a & b).
The value of regression coefficient (Z) has been reported as 0.1 to 0.2 for
different taxonomic group in different regions but for a very large area like
a continent this value ranges from 0.6 to 1.2. In 1960s, Robert Mac Arthur
and E.O. Wilson had also justified the A. von Humboldt hypothesis by
testing species- area relationship on several animals and plants and they
had reported the value of Z between 0.2 to 0.4[26].
SIGNIFICANCE OF BIODIVERSITY
A rich biodiversity is essential for ecosystem as well as survival of human
race. Significance of biodiversity can be explained in many ways:
Ecosystem Productivity
Biodiversity strengthen the ecosystem productivity where all species have
been assigned their own specific role by the nature. Ecosystem with high
biodiversity like tropical rain forest are more productive than ecosystem
with lower biodiversity like temperate forests. Tilman et al.[27] have
confirmed that increased biodiversity contributes to higher productivity.
The natural services that can be provided by a healthy ecosystem or
biodiversity can be categorised as:
1. Ecosystem services
Fig. 1: Species area relationship a) Geometric; b) Logarithmic
End of preview
Want to access all the pages? Upload your documents or become a member.
Related Documents
Biodiversity-Threats and Conservationlg...
|36
|17044
|252