HI6007 Statistics Assignment: Regression and Frequency Distribution
VerifiedAdded on 2023/06/12
|9
|1563
|146
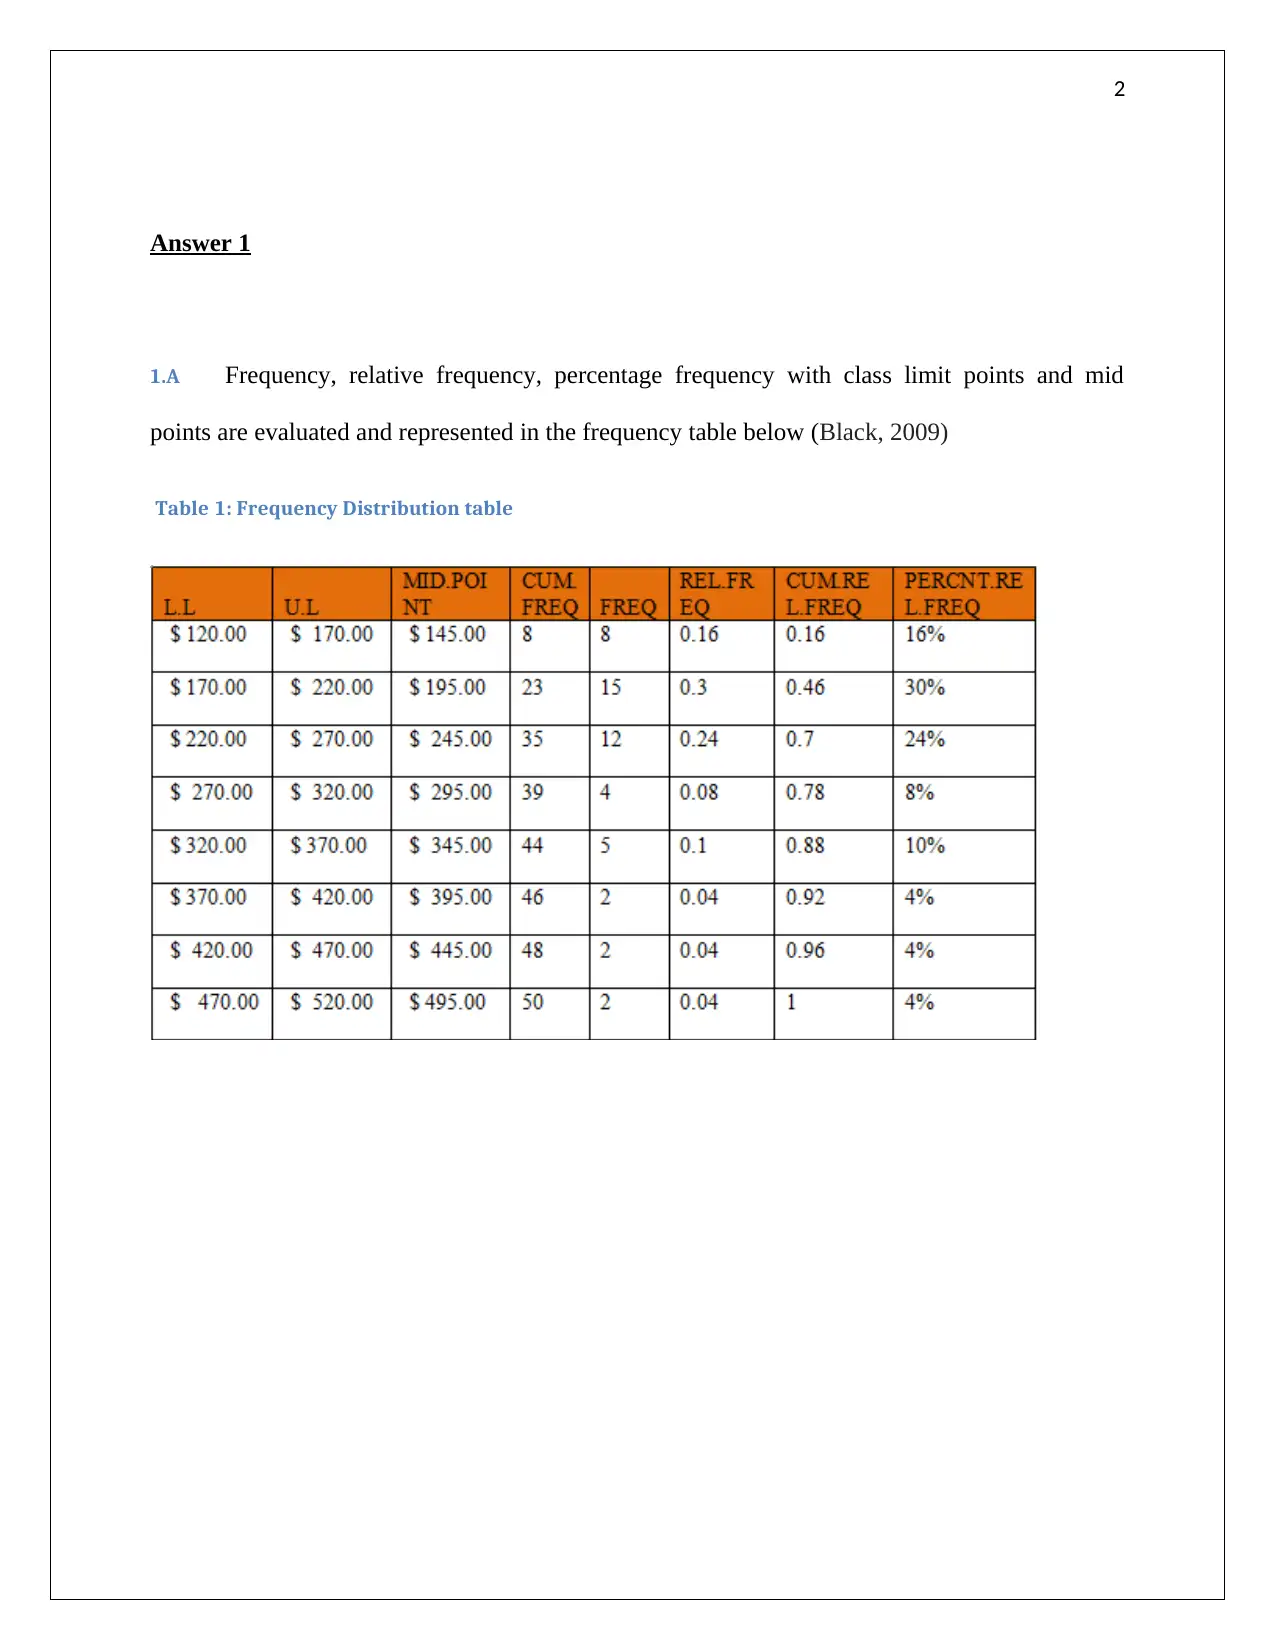
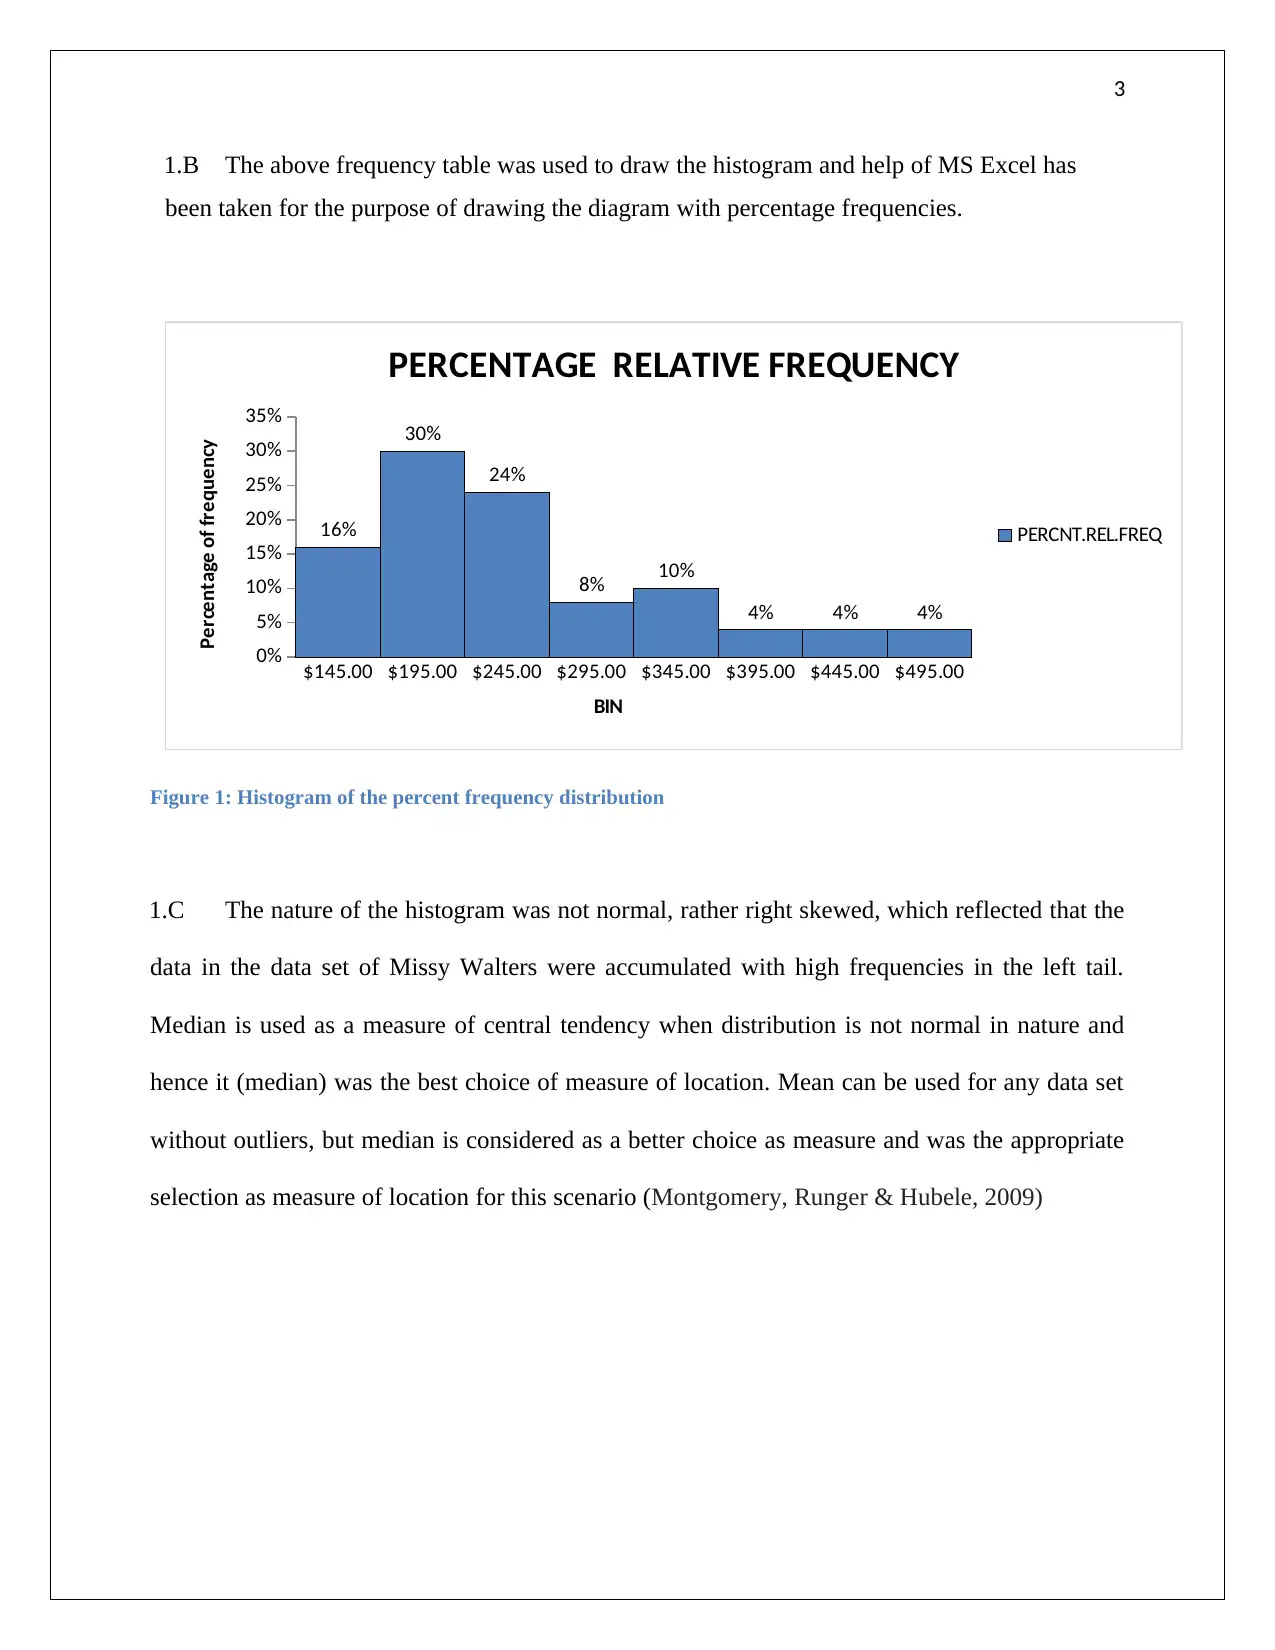
Homework Assignment
AI Summary
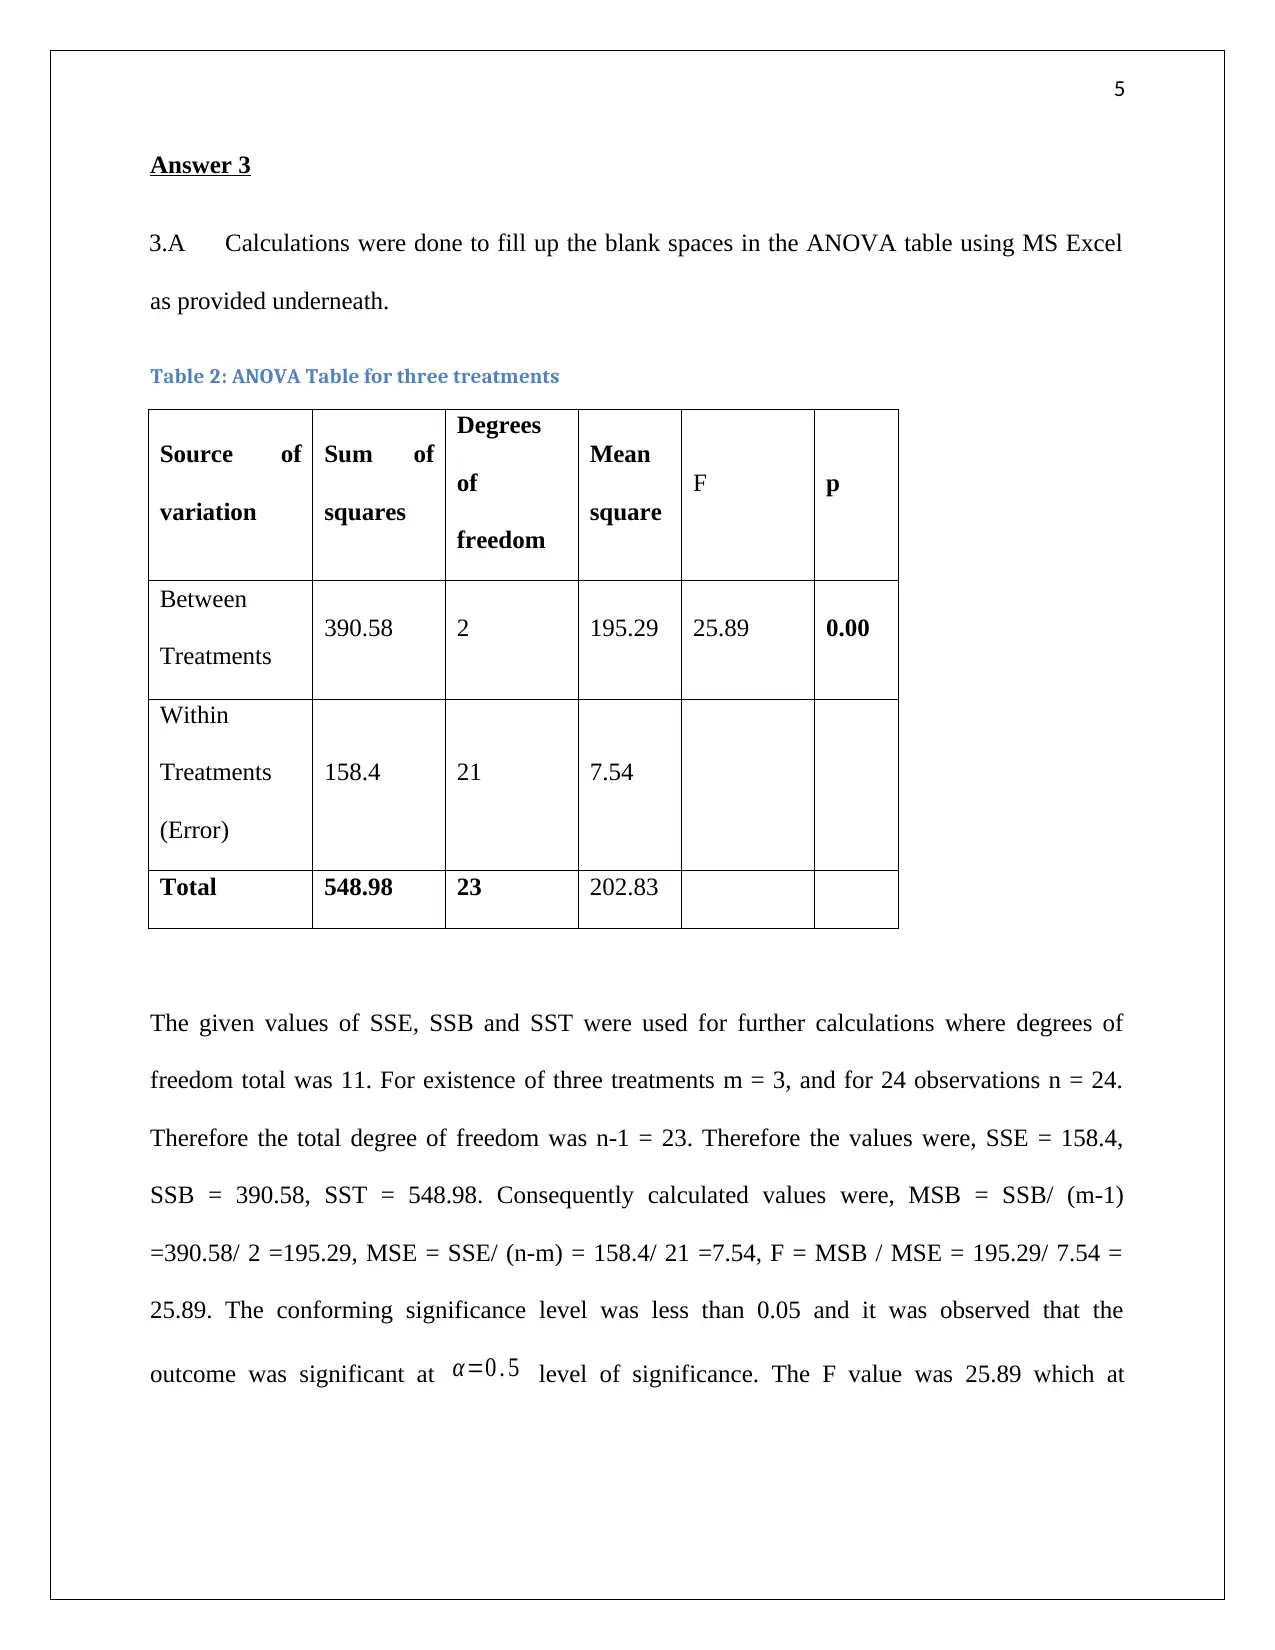
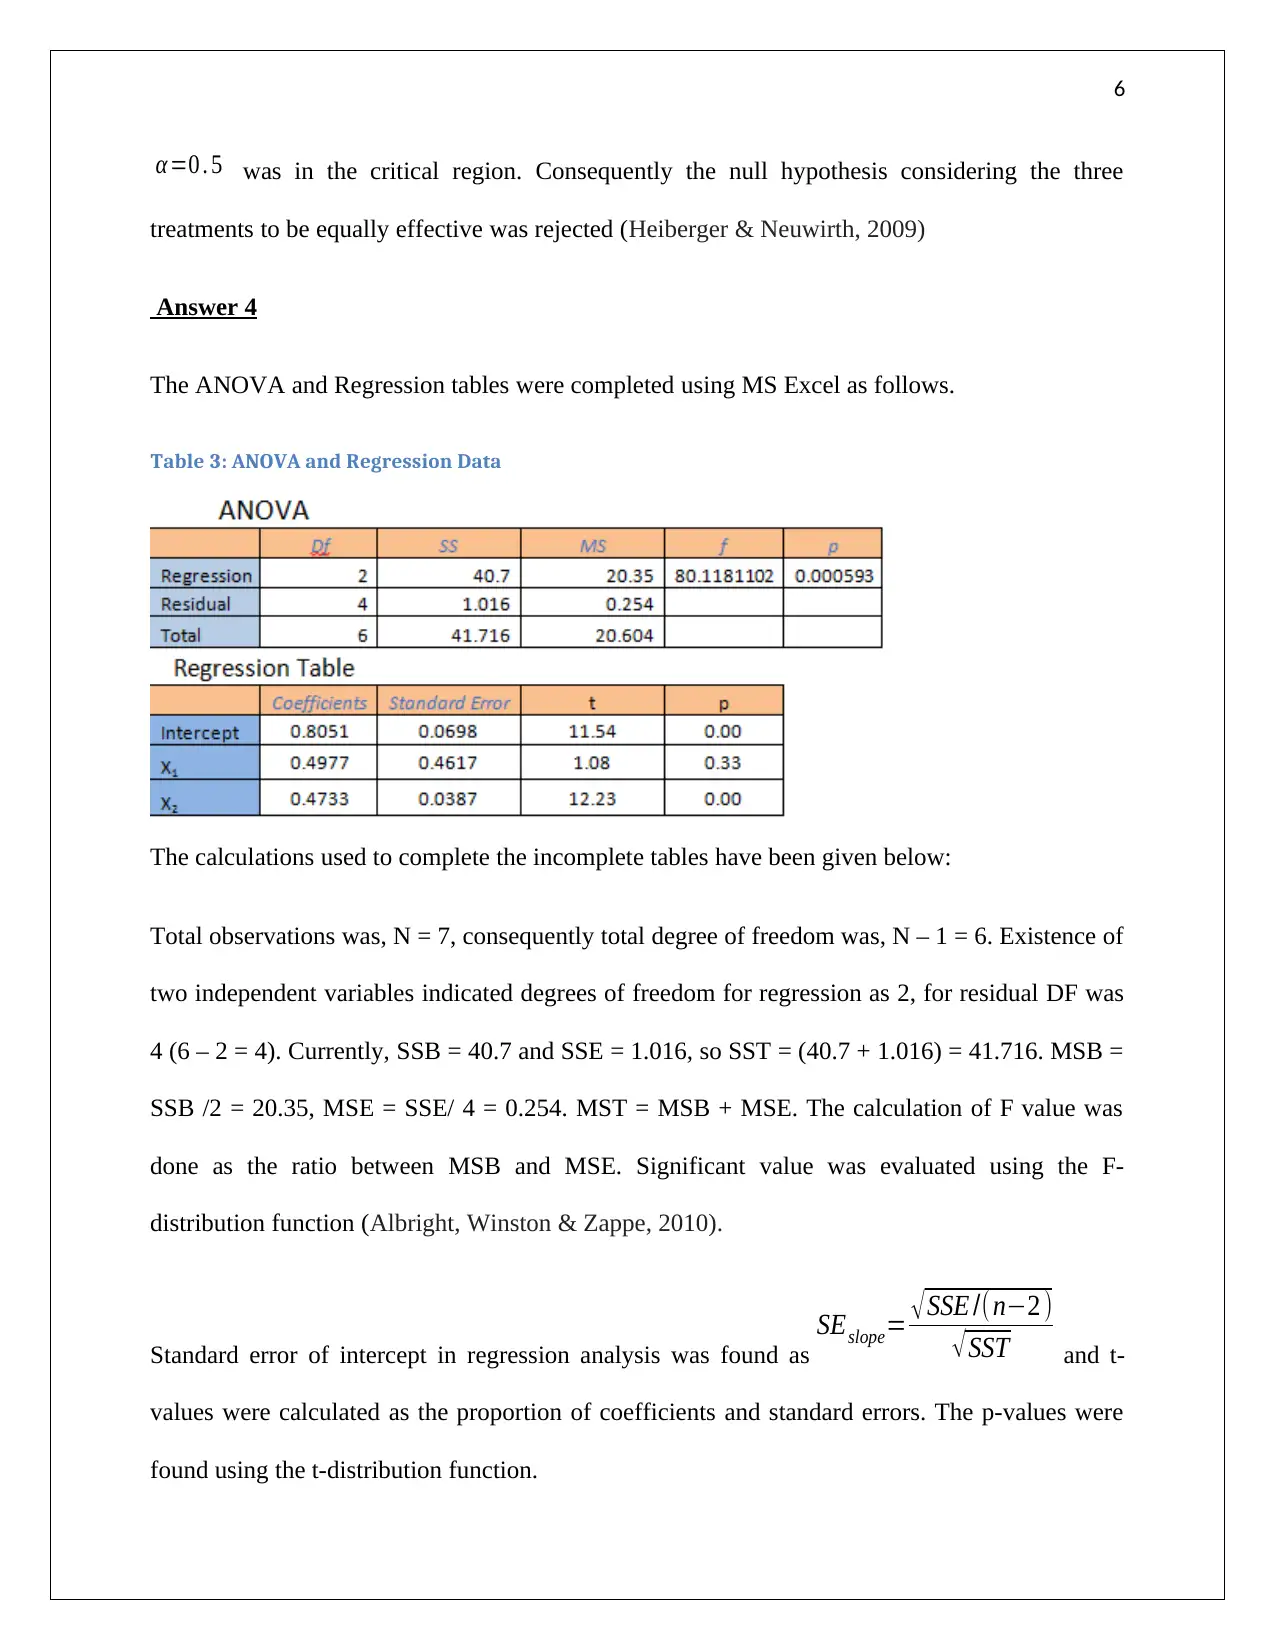
This assignment solution covers several statistical problems. The first problem involves creating a frequency distribution table and histogram from a given dataset, followed by determining the appropriate measure of central tendency. The second problem focuses on regression analysis, deriving a regression equation to model the relationship between demand and unit price, calculating the coefficient of determination, and evaluating the correlation coefficient. The third problem requires completing an ANOVA table and interpreting the results to determine the significance of different treatments. Finally, the fourth problem involves completing ANOVA and regression tables, formulating a regression model, testing hypotheses about the relationships between variables, and predicting mobile phone sales based on price and advertising spots. The solution uses MS Excel for calculations and graphical representations. Desklib offers a wide range of solved assignments and study resources for students.
1 out of 9
Related Documents


Your All-in-One AI-Powered Toolkit for Academic Success.
+13062052269
info@desklib.com
Available 24*7 on WhatsApp / Email
![[object Object]](/_next/static/media/star-bottom.7253800d.svg)
Copyright © 2020–2026 A2Z Services. All Rights Reserved. Developed and managed by ZUCOL.