SIT718: Share Price Performance of British Petroleum P.L.C. Analysis
VerifiedAdded on 2023/05/30
|8
|1274
|90
Report
AI Summary
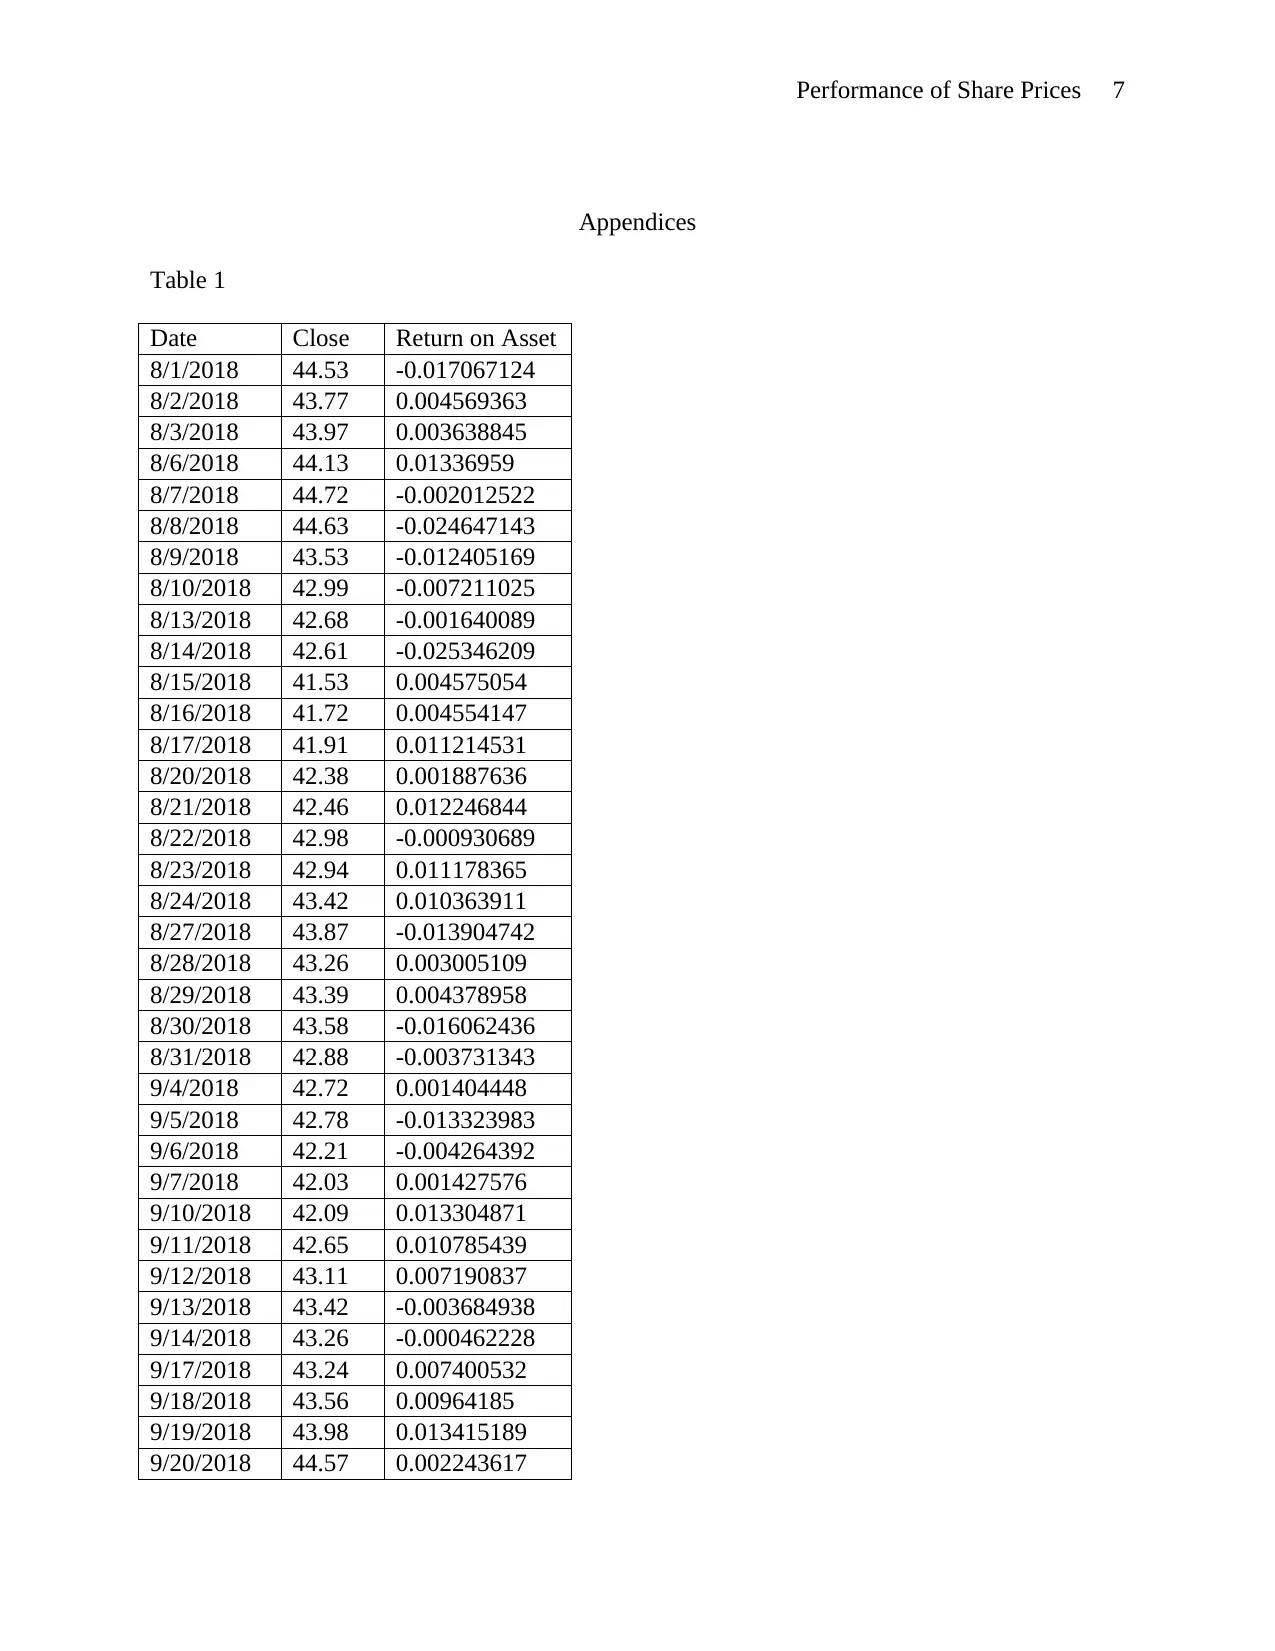
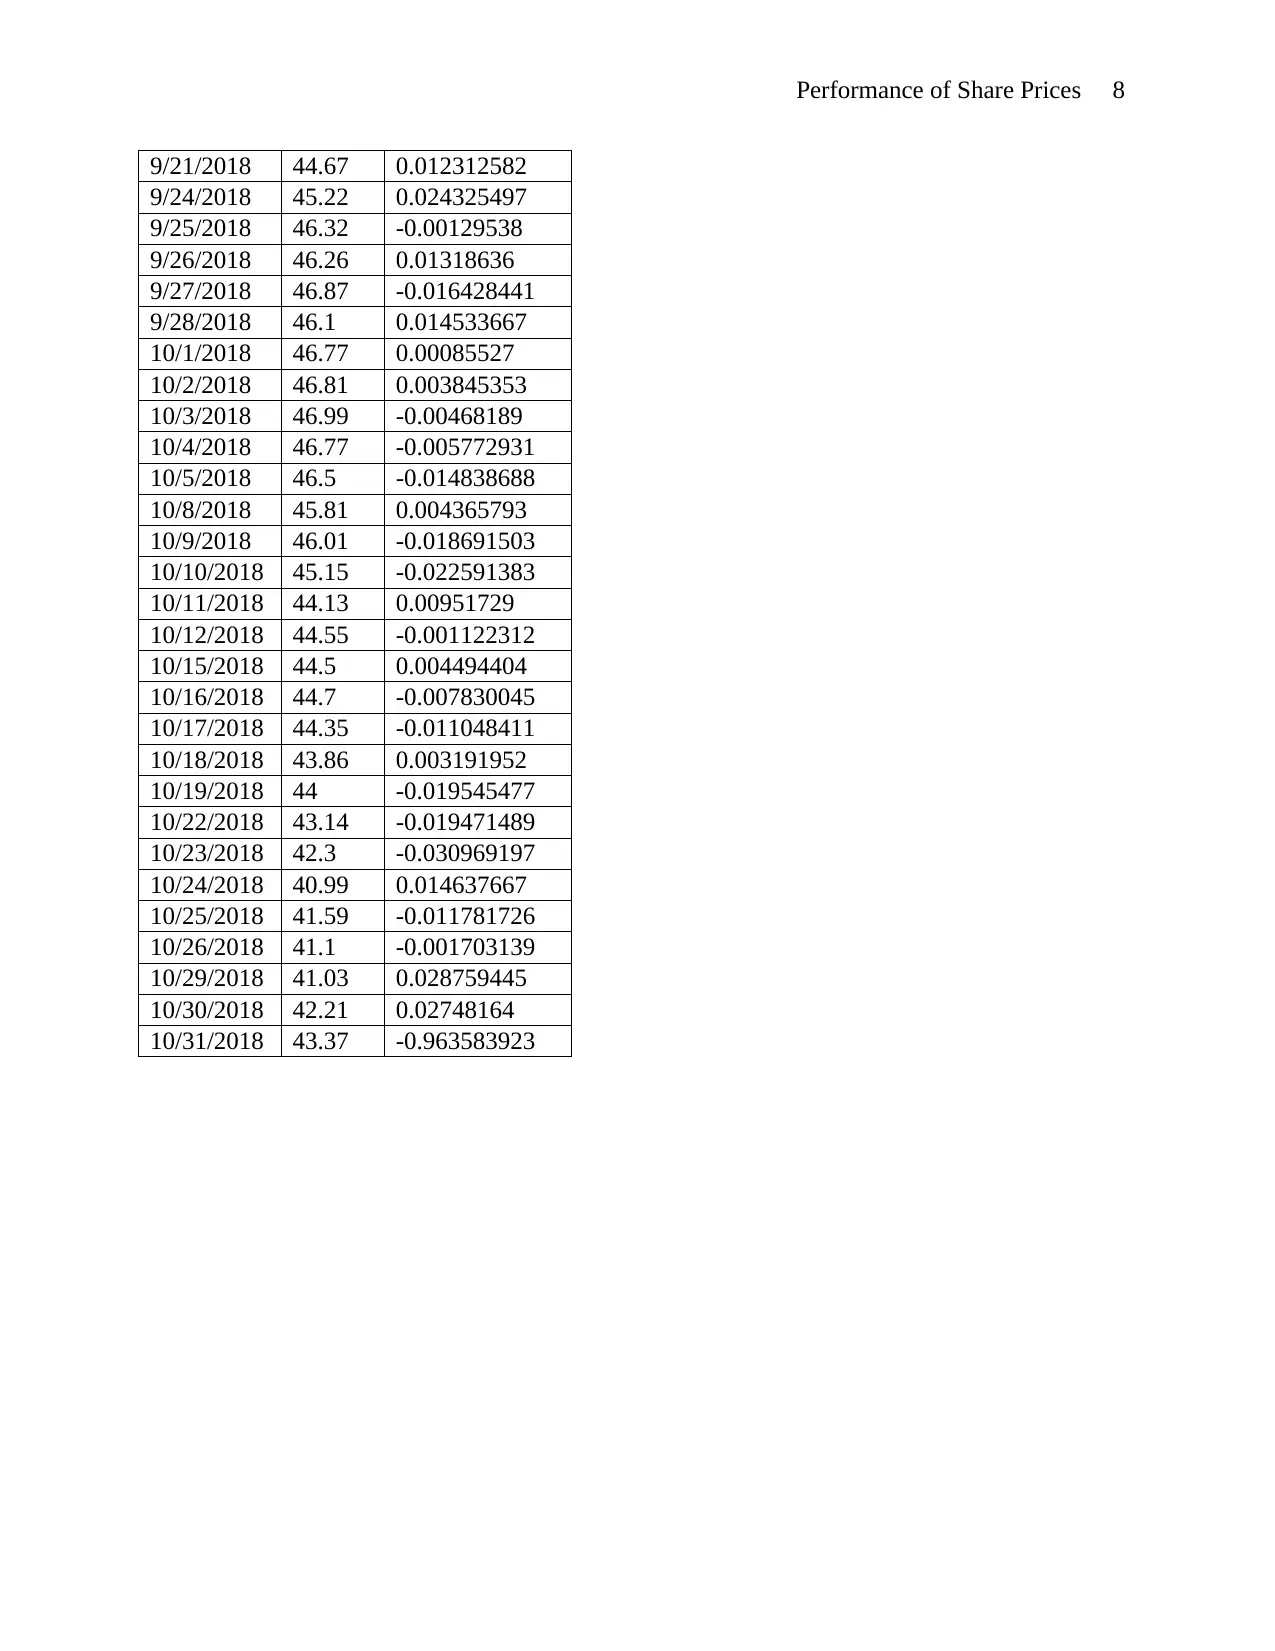
This report analyzes the behavior and performance of British Petroleum P.L.C. (BP) share prices between August and October 2018 using the Geometric Brownian Motion model. The analysis includes calculating drift and diffusion from historical closing prices obtained from Yahoo Finance. The report validates the applicability of the Geometric Brownian Motion by confirming the stability of the market and the duration of the data collected. It compares the calculated drift and diffusion values with information from BP's annual report, finding a favorable comparison for the fiscal year 2017/2018. The report also forecasts the share price for November 16, 2018, comparing it with actual values and discussing the limitations of the model, such as the assumption of a normal distribution and the limited duration of applicability. The study concludes by highlighting the model's usefulness for short-term forecasting but acknowledges its weaknesses related to distributional assumptions and potential for patterned simulated prices. Desklib provides access to similar solved assignments and past papers for students.

1 out of 8
Related Documents


Your All-in-One AI-Powered Toolkit for Academic Success.
+13062052269
info@desklib.com
Available 24*7 on WhatsApp / Email
![[object Object]](/_next/static/media/star-bottom.7253800d.svg)
Copyright © 2020–2026 A2Z Services. All Rights Reserved. Developed and managed by ZUCOL.