Road & Traffic Engineering: Signalized Intersection Design Report
VerifiedAdded on 2021/05/31
|16
|2729
|92
Report
AI Summary
This report delves into the design of signalized intersections, specifically focusing on an urban residential intersection experiencing morning peak traffic. It analyzes various aspects of signalized intersection design, including green splitting, cycle length determination, and phase design. The report ex...
Running Head: SIGNALIZED INTERSECTION DESIGN
Road and Traffic Engineering
Name
Institutional affiliation
Road and Traffic Engineering
Name
Institutional affiliation
Paraphrase This Document
Need a fresh take? Get an instant paraphrase of this document with our AI Paraphraser
SIGNALIZED INTERSECTION DESIGN 2
SIGNALIZED INTERSECTION DESIGN
This design paper on road and traffic engineering is about signalized intersection design
of a morning peak traffic count at an urban residential intersection by analyzing numerous
theories and concepts in signalized intersection design that incorporates aspects such as green
splitting, the design of cycle length, and design of phase. Intersections may be signalized to
improve crossing opportunities for vehicles and pedestrians and also address the road safety,
operation or efficiency issue. Numerous urban areas rely on the use of traffic signals heavily
across the world to efficiently and effectively regulate the movement of road users and also
vehicles. These signalized intersections are normally installed at the intersections of the major
roads and generally entails numerous lanes of approach on every leg (Akcelik, 2011).
Performance of Signalized Intersection
The parameters commonly used for evaluation of performance of signalized intersection
include cycle failure, queue length, and control delay. There is need of collecting vehicle control
delay data manually when measuring intersection performance. Signalized intersections should
provide operation and space conditions to support all the road users. The signalized design can
be designed to accommodate a variety of road users and can be either temporal or spatial
separation depending on the diverse users targeted. At signalized intersections, numerous
movements are separated in time and hence the risk to submissive cyclists is normally lower
compared to unsignalized intersections. Some of the significance of signalized intersection
include it does not need much during designing since it is very simple, numerous intersections
have effectively improved in their capacity, and also the smooth movement of the traffic.
However, these signalized intersections are faced with some shortcomings, such as complex in
its implementation and design, and also delays caused by stoppage durations (Australian, 2013).
SIGNALIZED INTERSECTION DESIGN 3
Design Concepts
The following are some of the signal intersection concepts and definitions which are used in the
signalized intersection design interpretation:
Cycle: This is the complete cycle of all the traffic through the used indication points
Red Interval: This is the time taken for the signal at the intersection to show red signal during a
given movement
Cycle length: This is the time taken for green light to reappear again and it is measured in
second. It is denoted by C.
Interval: This is the signal alternation from one stage of the signal to another. There are two
different types of interval domain, namely, clearance interlude and change interlude. Go-ahead
duration is also known as all red and is the time when the traffic signal indicates all red, basically
used to clear vehicle in a particular intersection side. Change duration is also known as the time
of the yellow signal and it indicates the time between green and red traffic signals during a single
approach. (Bell, 2011)
Green interval: This is the time when it indicates a go for a given intersection section normally
denoted by Gi. It is the actual duration when the lights change to green.
Red interval: This is the time when the signal of intersection indicates red at a given movement.
Phase: It is the summation of the following change plus clearance and green interval.
Lost time: This indicated the duration when a given intersection does not completely apply to any
movement of traffic (Florida, 2016).
Signal Design
⊘ This is a preview!⊘
Do you want full access?
Subscribe today to unlock all pages.
Trusted by 1+ million students worldwide
SIGNALIZED INTERSECTION DESIGN 4
The signal design is a procedure involving six steps, namely:
i. Phase design
ii. Amber determination and succeeding clearance time
iii. Length cycle determination
iv. Distribution of green time
v. Pedestrian crossing requirement
vi. Performance evaluation (Guberinic, 2009)
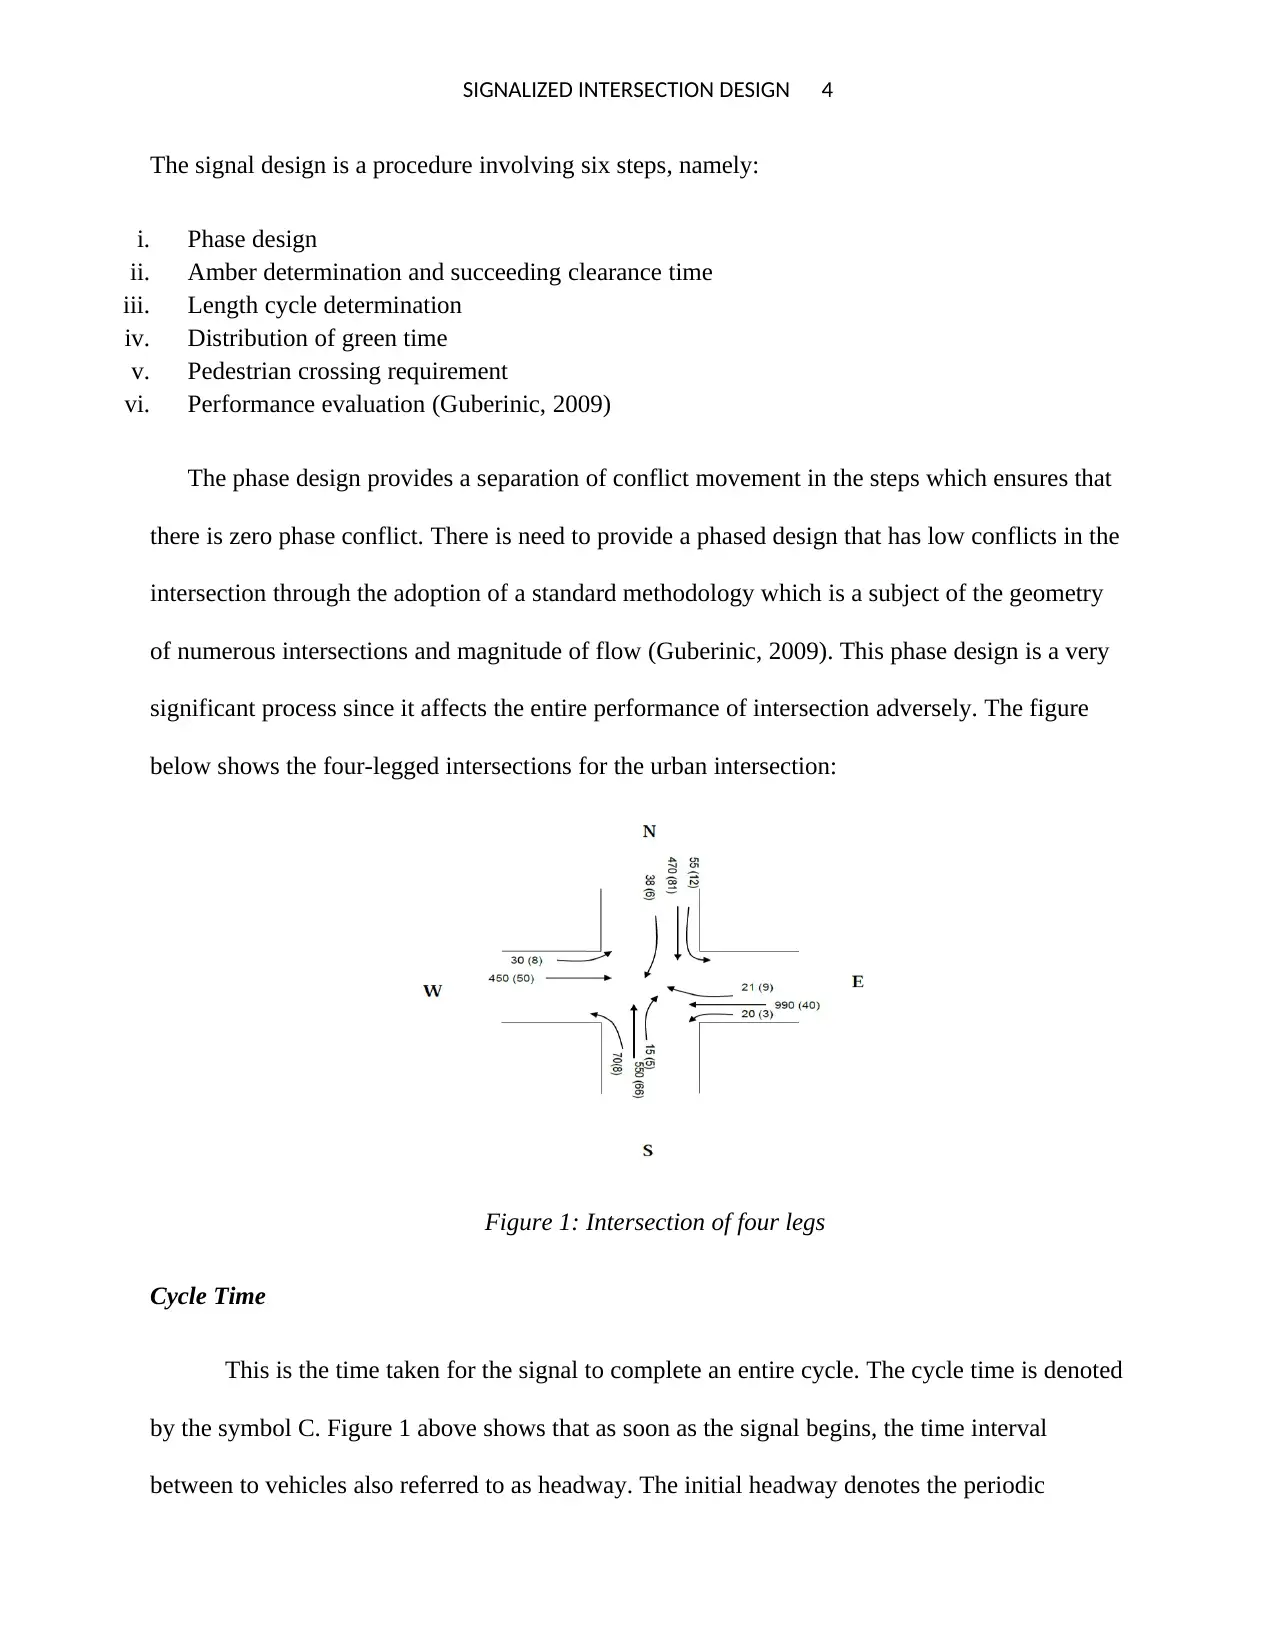
The phase design provides a separation of conflict movement in the steps which ensures that
there is zero phase conflict. There is need to provide a phased design that has low conflicts in the
intersection through the adoption of a standard methodology which is a subject of the geometry
of numerous intersections and magnitude of flow (Guberinic, 2009). This phase design is a very
significant process since it affects the entire performance of intersection adversely. The figure
below shows the four-legged intersections for the urban intersection:
Figure 1: Intersection of four legs
Cycle Time
This is the time taken for the signal to complete an entire cycle. The cycle time is denoted
by the symbol C. Figure 1 above shows that as soon as the signal begins, the time interval
between to vehicles also referred to as headway. The initial headway denotes the periodic
The signal design is a procedure involving six steps, namely:
i. Phase design
ii. Amber determination and succeeding clearance time
iii. Length cycle determination
iv. Distribution of green time
v. Pedestrian crossing requirement
vi. Performance evaluation (Guberinic, 2009)
The phase design provides a separation of conflict movement in the steps which ensures that
there is zero phase conflict. There is need to provide a phased design that has low conflicts in the
intersection through the adoption of a standard methodology which is a subject of the geometry
of numerous intersections and magnitude of flow (Guberinic, 2009). This phase design is a very
significant process since it affects the entire performance of intersection adversely. The figure
below shows the four-legged intersections for the urban intersection:
Figure 1: Intersection of four legs
Cycle Time
This is the time taken for the signal to complete an entire cycle. The cycle time is denoted
by the symbol C. Figure 1 above shows that as soon as the signal begins, the time interval
between to vehicles also referred to as headway. The initial headway denotes the periodic
Paraphrase This Document
Need a fresh take? Get an instant paraphrase of this document with our AI Paraphraser
SIGNALIZED INTERSECTION DESIGN 5
interval from the beginning of green signal to the immediate vehicle intersecting the restricted
stripe. The flow of other headways is portrayed in the above figure. It can be noted that instant
movement is expected to be longer since a lot of duration is wasted as a result of the reaction
time of the driver and the effective acceleration of the vehicle (Wolhuter, 2015). The assumption
made is that the headway of the driver will be in front of the first driver headway due to the low
time of reaction than the first driver. After a given number of the vehicles have passed the
intersection, the headways are expected to be constant, until a saturation headway id reached and
it is denoted by h (Wade, 2011).
Green Time
This is the available time that a vehicle can take to cross the junction safely. Effective
green time can be determined by adding the effective green phase, Gi and yellow signal to reduce
the duration of time lost. The lost time can be determined by summing the whole time lost during
clearance (11) and time lost during start-up (12). The real effective green time can be determined
by:
Gi = Gi + Yi - to (i)
Lane Capacity
The green ratio is the ratio between the effective green time and the cycle length (Gi/C). The
saturation flow is the is the number of vehicles moving in one hour through an intersection while
assuming that it will always be green (University, 2009). Therefore, the lane capacity can be
determined by:
ci = si gi /C (ii)
SIGNALIZED INTERSECTION DESIGN 6
Where C = cycle time in seconds, si is traffic flow capacity for every hour per lane, ci is the lane
capacity.
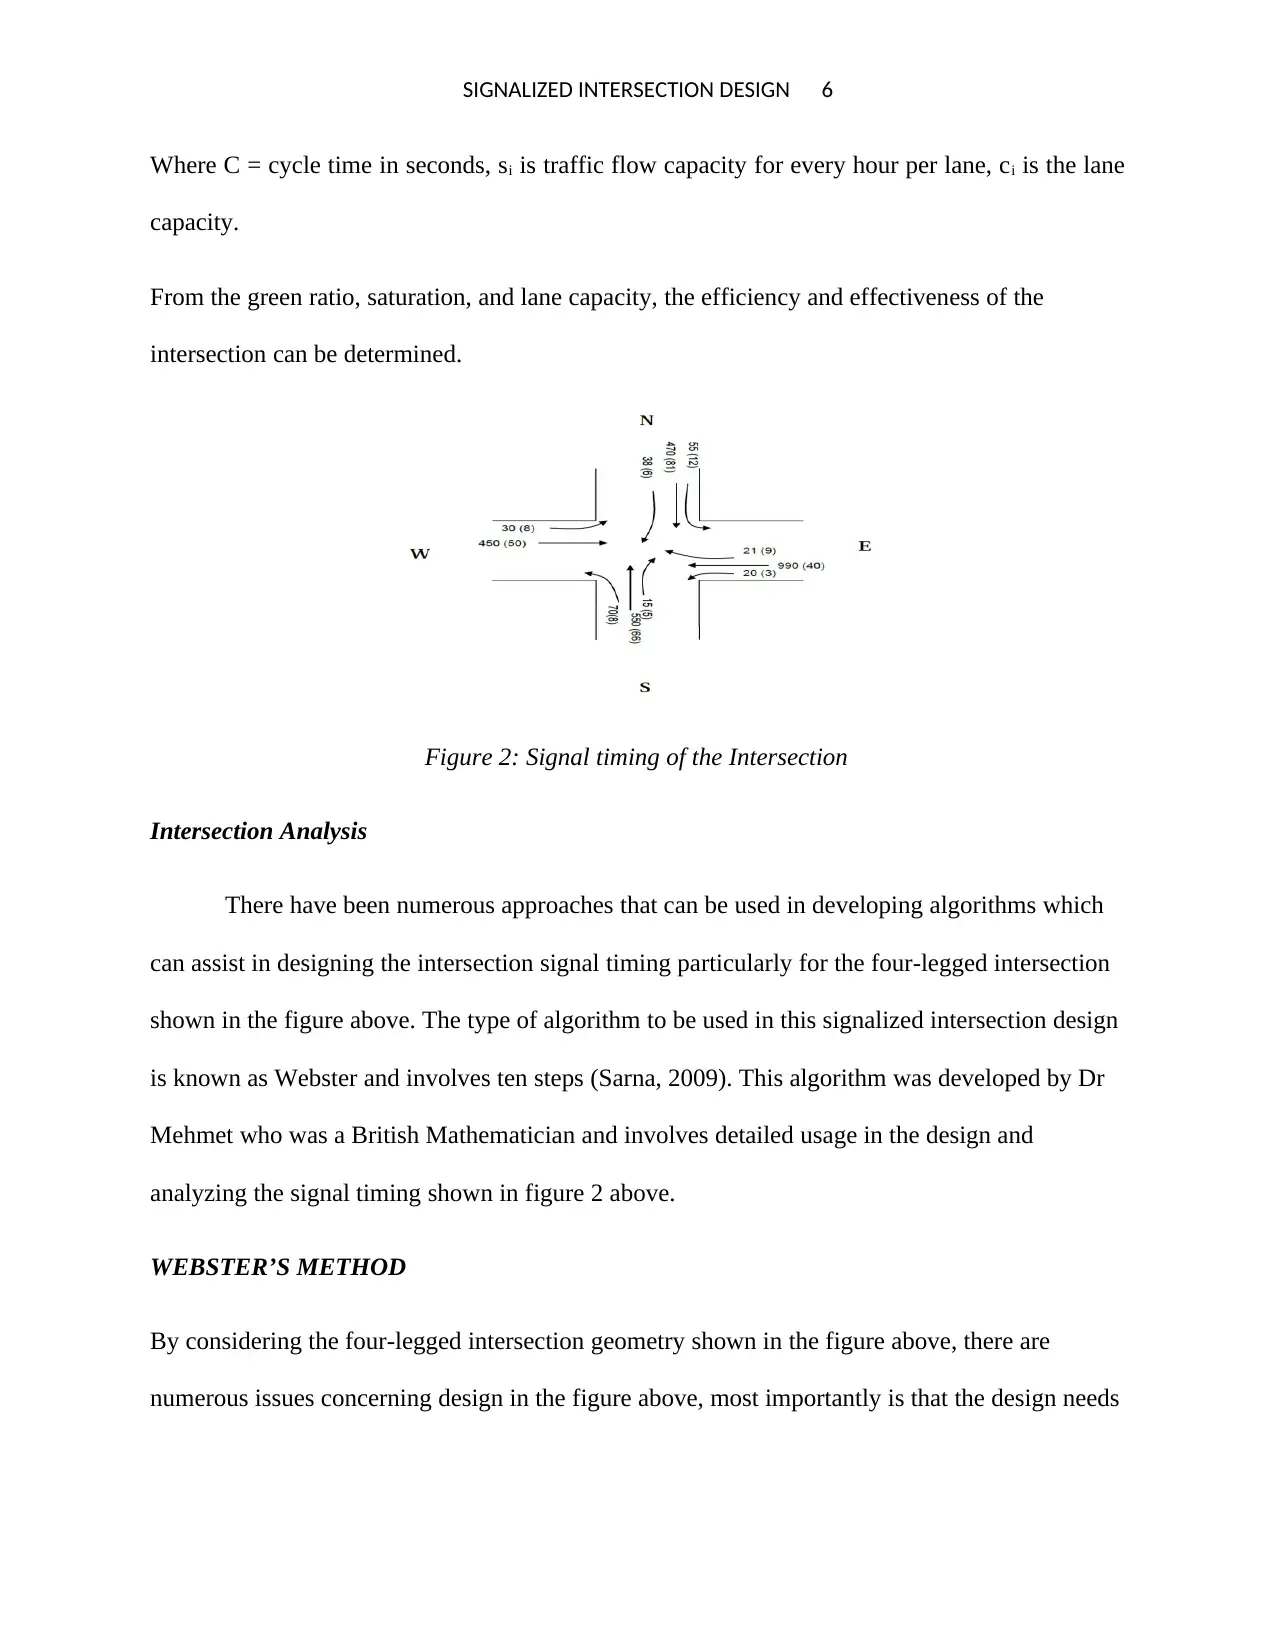
From the green ratio, saturation, and lane capacity, the efficiency and effectiveness of the
intersection can be determined.
Figure 2: Signal timing of the Intersection
Intersection Analysis
There have been numerous approaches that can be used in developing algorithms which
can assist in designing the intersection signal timing particularly for the four-legged intersection
shown in the figure above. The type of algorithm to be used in this signalized intersection design
is known as Webster and involves ten steps (Sarna, 2009). This algorithm was developed by Dr
Mehmet who was a British Mathematician and involves detailed usage in the design and
analyzing the signal timing shown in figure 2 above.
WEBSTER’S METHOD
By considering the four-legged intersection geometry shown in the figure above, there are
numerous issues concerning design in the figure above, most importantly is that the design needs
Where C = cycle time in seconds, si is traffic flow capacity for every hour per lane, ci is the lane
capacity.
From the green ratio, saturation, and lane capacity, the efficiency and effectiveness of the
intersection can be determined.
Figure 2: Signal timing of the Intersection
Intersection Analysis
There have been numerous approaches that can be used in developing algorithms which
can assist in designing the intersection signal timing particularly for the four-legged intersection
shown in the figure above. The type of algorithm to be used in this signalized intersection design
is known as Webster and involves ten steps (Sarna, 2009). This algorithm was developed by Dr
Mehmet who was a British Mathematician and involves detailed usage in the design and
analyzing the signal timing shown in figure 2 above.
WEBSTER’S METHOD
By considering the four-legged intersection geometry shown in the figure above, there are
numerous issues concerning design in the figure above, most importantly is that the design needs
⊘ This is a preview!⊘
Do you want full access?
Subscribe today to unlock all pages.
Trusted by 1+ million students worldwide
SIGNALIZED INTERSECTION DESIGN 7
to be either three or more intersection phases (Pratelli, 2013). For this signalized intersection
design, a four-phase design signal is ideal for the purposes of implementation.
Procedure
The assumption made while using the Webster design is that the driver has been the capability of
making a stop at the exact line of stoppage when the signal changes to red. The intersection
interval change can be determined by first adopting the algorithm below:
y=19.6 g+ v 85
2 a +t (iii)
Where g is the approach rating in decimal, a is the breaking rate of vehicles, v85 is the percentile
speediness of the vehicles impending in m/s, t is the reaction time for the driver, and y is the
duration of the yellow interludes in seconds (Guberinic, 2009).
Signal Design
There is need to provide the optimum effective capacity of traffic flow of the intersection
approaching to efficiently and effectively design signal timing. There should also be the low
vehicle of interruptions and also small queue while issuing the optimum opportunity for the
traffic passing on the given duration for mainstream users. The signal timing should seriously
consider the normal traffic flow through the intersection. The cycle length is normally 40
seconds to 60 seconds for the 2-phase signal while longer cycle length is designed for traffics
that are more complex than 2-phases (Australian, 2013). The algorithm that should be used while
designing the signal includes:
i. Finding the traffic volume for different directions and roads
ii. Determining the breadth of the roads
Paraphrase This Document
Need a fresh take? Get an instant paraphrase of this document with our AI Paraphraser
SIGNALIZED INTERSECTION DESIGN 8
iii. The product acquired is the major input for the outcome of the capacity of rad traffic,
planning the timing of the signal centred on the methods delivered by a given design method
(Sarna, 2009).
Evaluations
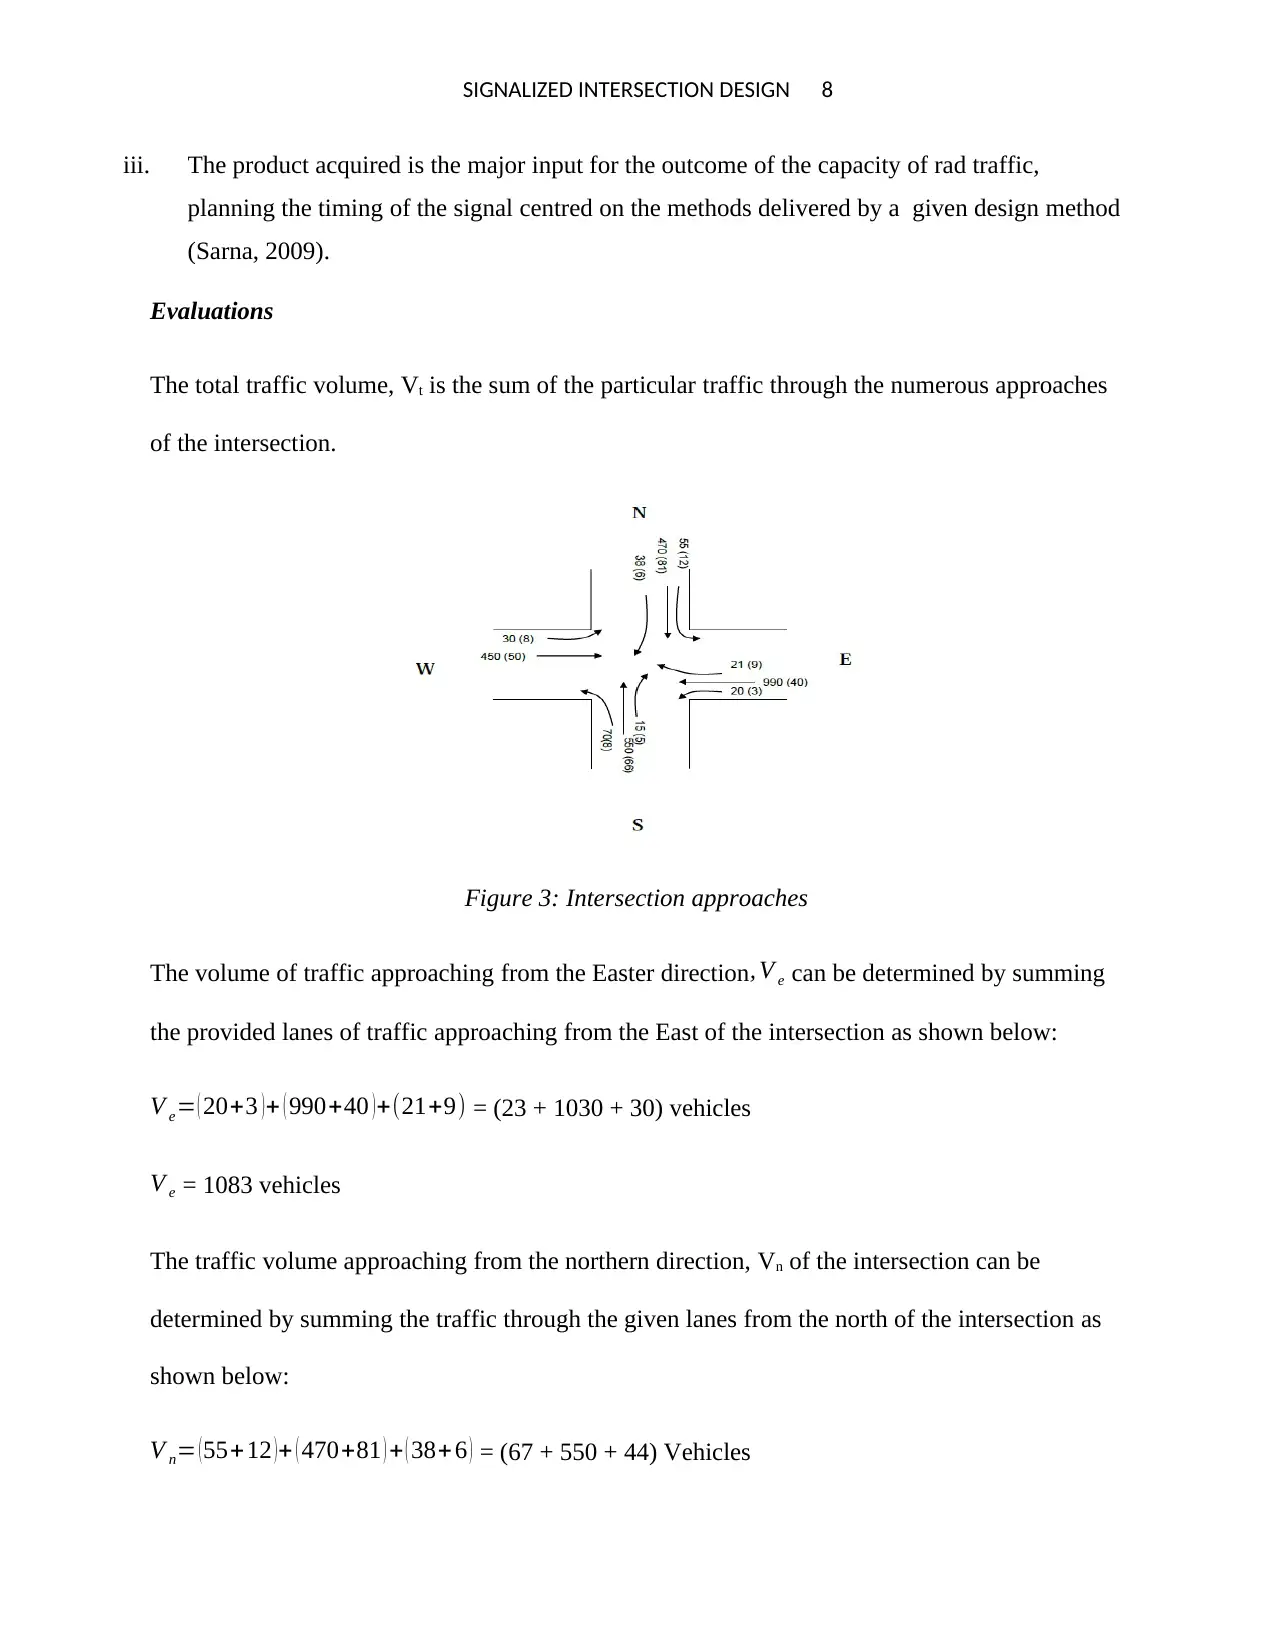
The total traffic volume, Vt is the sum of the particular traffic through the numerous approaches
of the intersection.
Figure 3: Intersection approaches
The volume of traffic approaching from the Easter direction , V e can be determined by summing
the provided lanes of traffic approaching from the East of the intersection as shown below:
V e= ( 20+3 )+ ( 990+40 )+(21+9) = (23 + 1030 + 30) vehicles
V e = 1083 vehicles
The traffic volume approaching from the northern direction, Vn of the intersection can be
determined by summing the traffic through the given lanes from the north of the intersection as
shown below:
V n= ( 55+12 ) + ( 470+81 ) + ( 38+6 ) = (67 + 550 + 44) Vehicles
iii. The product acquired is the major input for the outcome of the capacity of rad traffic,
planning the timing of the signal centred on the methods delivered by a given design method
(Sarna, 2009).
Evaluations
The total traffic volume, Vt is the sum of the particular traffic through the numerous approaches
of the intersection.
Figure 3: Intersection approaches
The volume of traffic approaching from the Easter direction , V e can be determined by summing
the provided lanes of traffic approaching from the East of the intersection as shown below:
V e= ( 20+3 )+ ( 990+40 )+(21+9) = (23 + 1030 + 30) vehicles
V e = 1083 vehicles
The traffic volume approaching from the northern direction, Vn of the intersection can be
determined by summing the traffic through the given lanes from the north of the intersection as
shown below:
V n= ( 55+12 ) + ( 470+81 ) + ( 38+6 ) = (67 + 550 + 44) Vehicles
SIGNALIZED INTERSECTION DESIGN 9
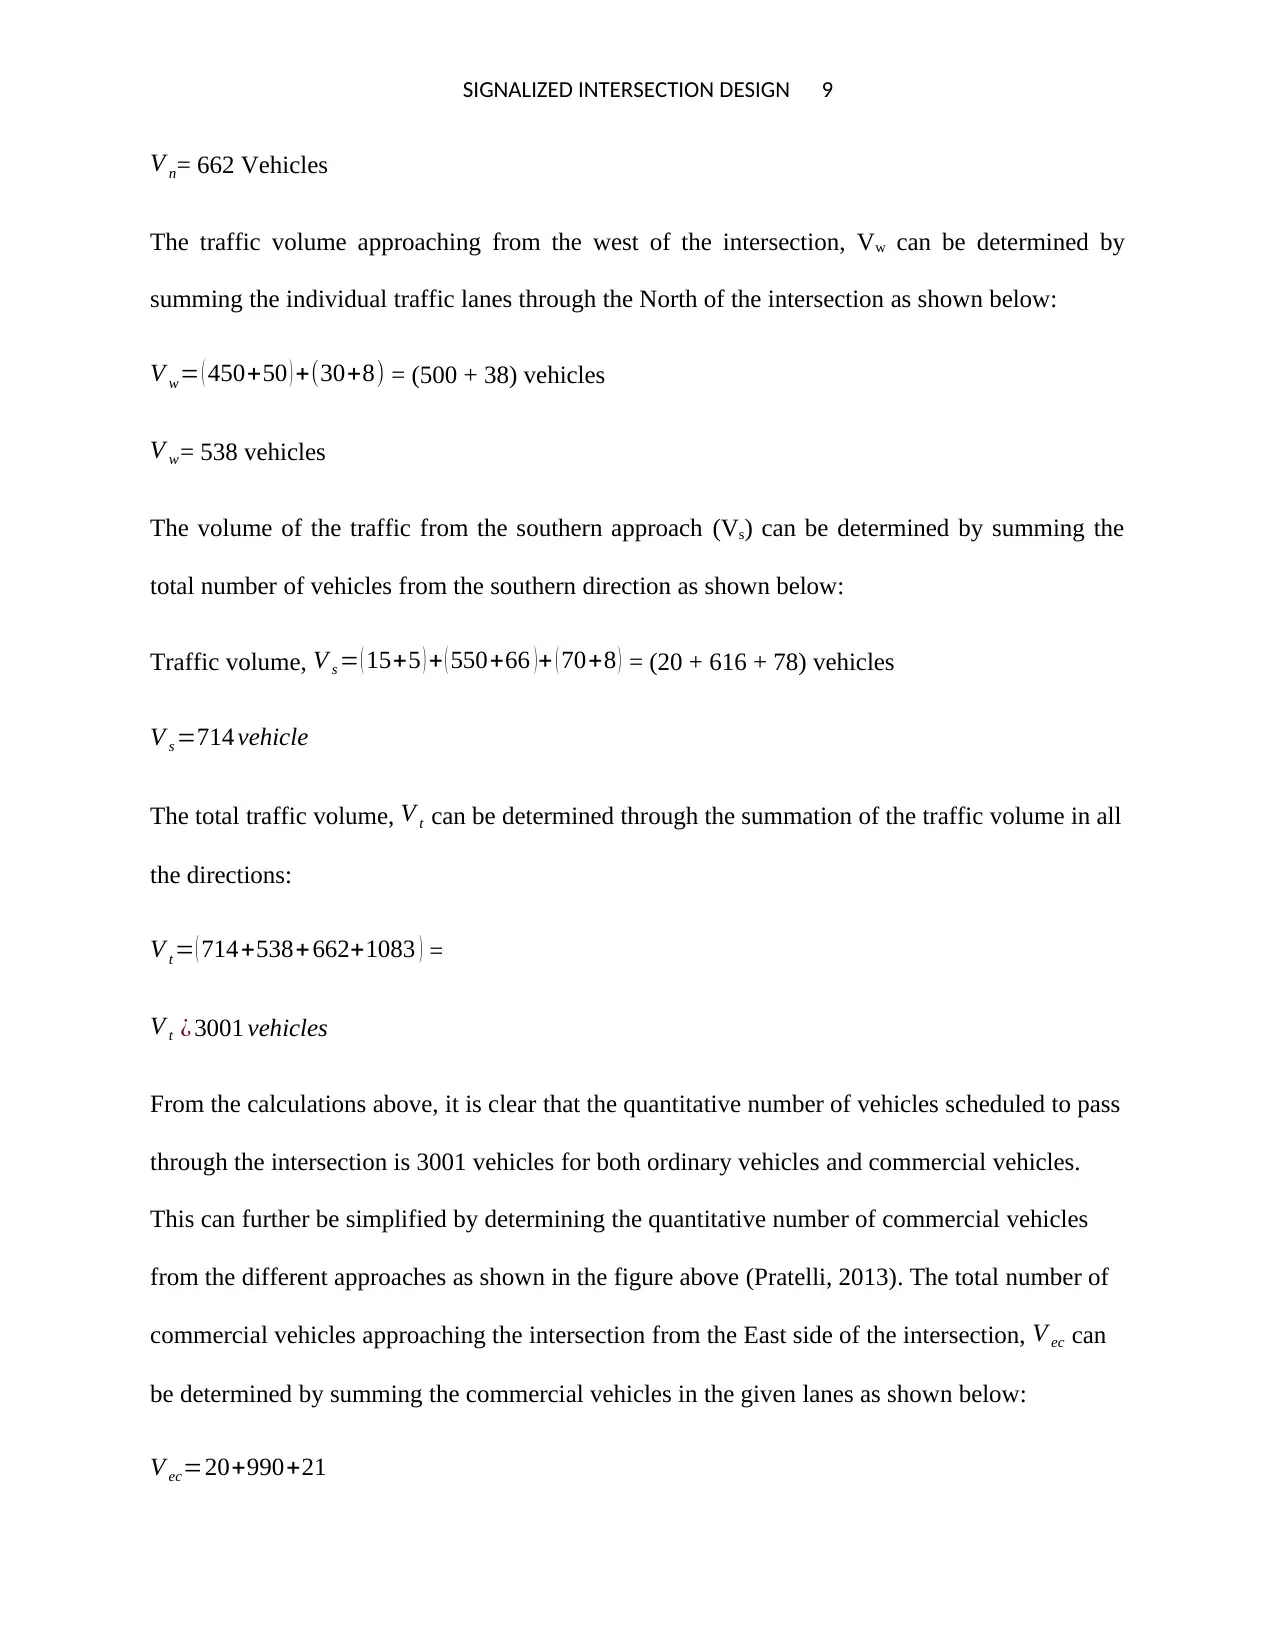
V n= 662 Vehicles
The traffic volume approaching from the west of the intersection, Vw can be determined by
summing the individual traffic lanes through the North of the intersection as shown below:
V w= ( 450+50 ) +(30+8) = (500 + 38) vehicles
V w= 538 vehicles
The volume of the traffic from the southern approach (Vs) can be determined by summing the
total number of vehicles from the southern direction as shown below:
Traffic volume, V s = ( 15+5 ) + ( 550+66 ) + ( 70+8 ) = (20 + 616 + 78) vehicles
V s =714 vehicle
The total traffic volume, V t can be determined through the summation of the traffic volume in all
the directions:
V t = ( 714+538+ 662+1083 ) =
V t ¿ 3001 vehicles
From the calculations above, it is clear that the quantitative number of vehicles scheduled to pass
through the intersection is 3001 vehicles for both ordinary vehicles and commercial vehicles.
This can further be simplified by determining the quantitative number of commercial vehicles
from the different approaches as shown in the figure above (Pratelli, 2013). The total number of
commercial vehicles approaching the intersection from the East side of the intersection, V ec can
be determined by summing the commercial vehicles in the given lanes as shown below:
V ec=20+990+21
⊘ This is a preview!⊘
Do you want full access?
Subscribe today to unlock all pages.
Trusted by 1+ million students worldwide
SIGNALIZED INTERSECTION DESIGN 10
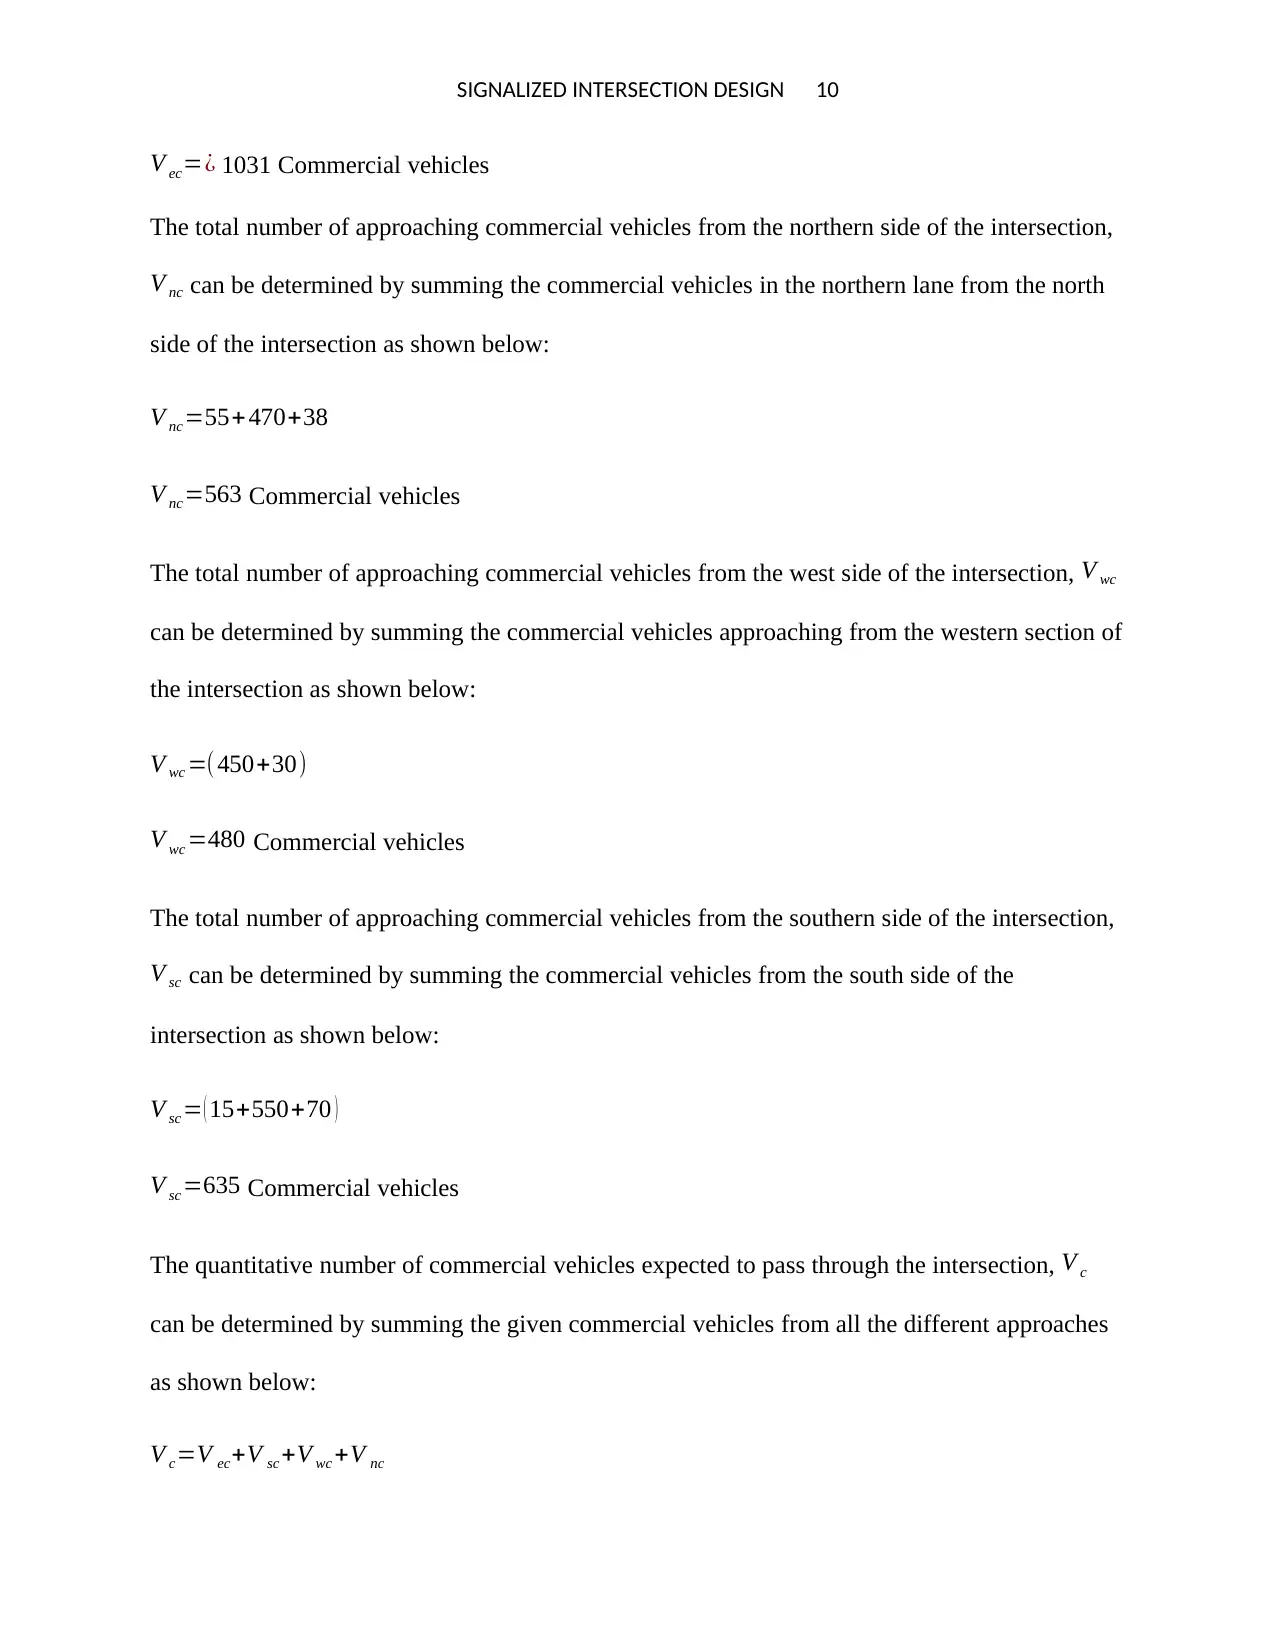
V ec=¿ 1031 Commercial vehicles
The total number of approaching commercial vehicles from the northern side of the intersection,
V nc can be determined by summing the commercial vehicles in the northern lane from the north
side of the intersection as shown below:
V nc=55+ 470+38
V nc=563 Commercial vehicles
The total number of approaching commercial vehicles from the west side of the intersection, V wc
can be determined by summing the commercial vehicles approaching from the western section of
the intersection as shown below:
V wc =( 450+30)
V wc =480 Commercial vehicles
The total number of approaching commercial vehicles from the southern side of the intersection,
V sc can be determined by summing the commercial vehicles from the south side of the
intersection as shown below:
V sc = ( 15+550+70 )
V sc =635 Commercial vehicles
The quantitative number of commercial vehicles expected to pass through the intersection, V c
can be determined by summing the given commercial vehicles from all the different approaches
as shown below:
V c=V ec+V sc +V wc +V nc
Paraphrase This Document
Need a fresh take? Get an instant paraphrase of this document with our AI Paraphraser
SIGNALIZED INTERSECTION DESIGN 11
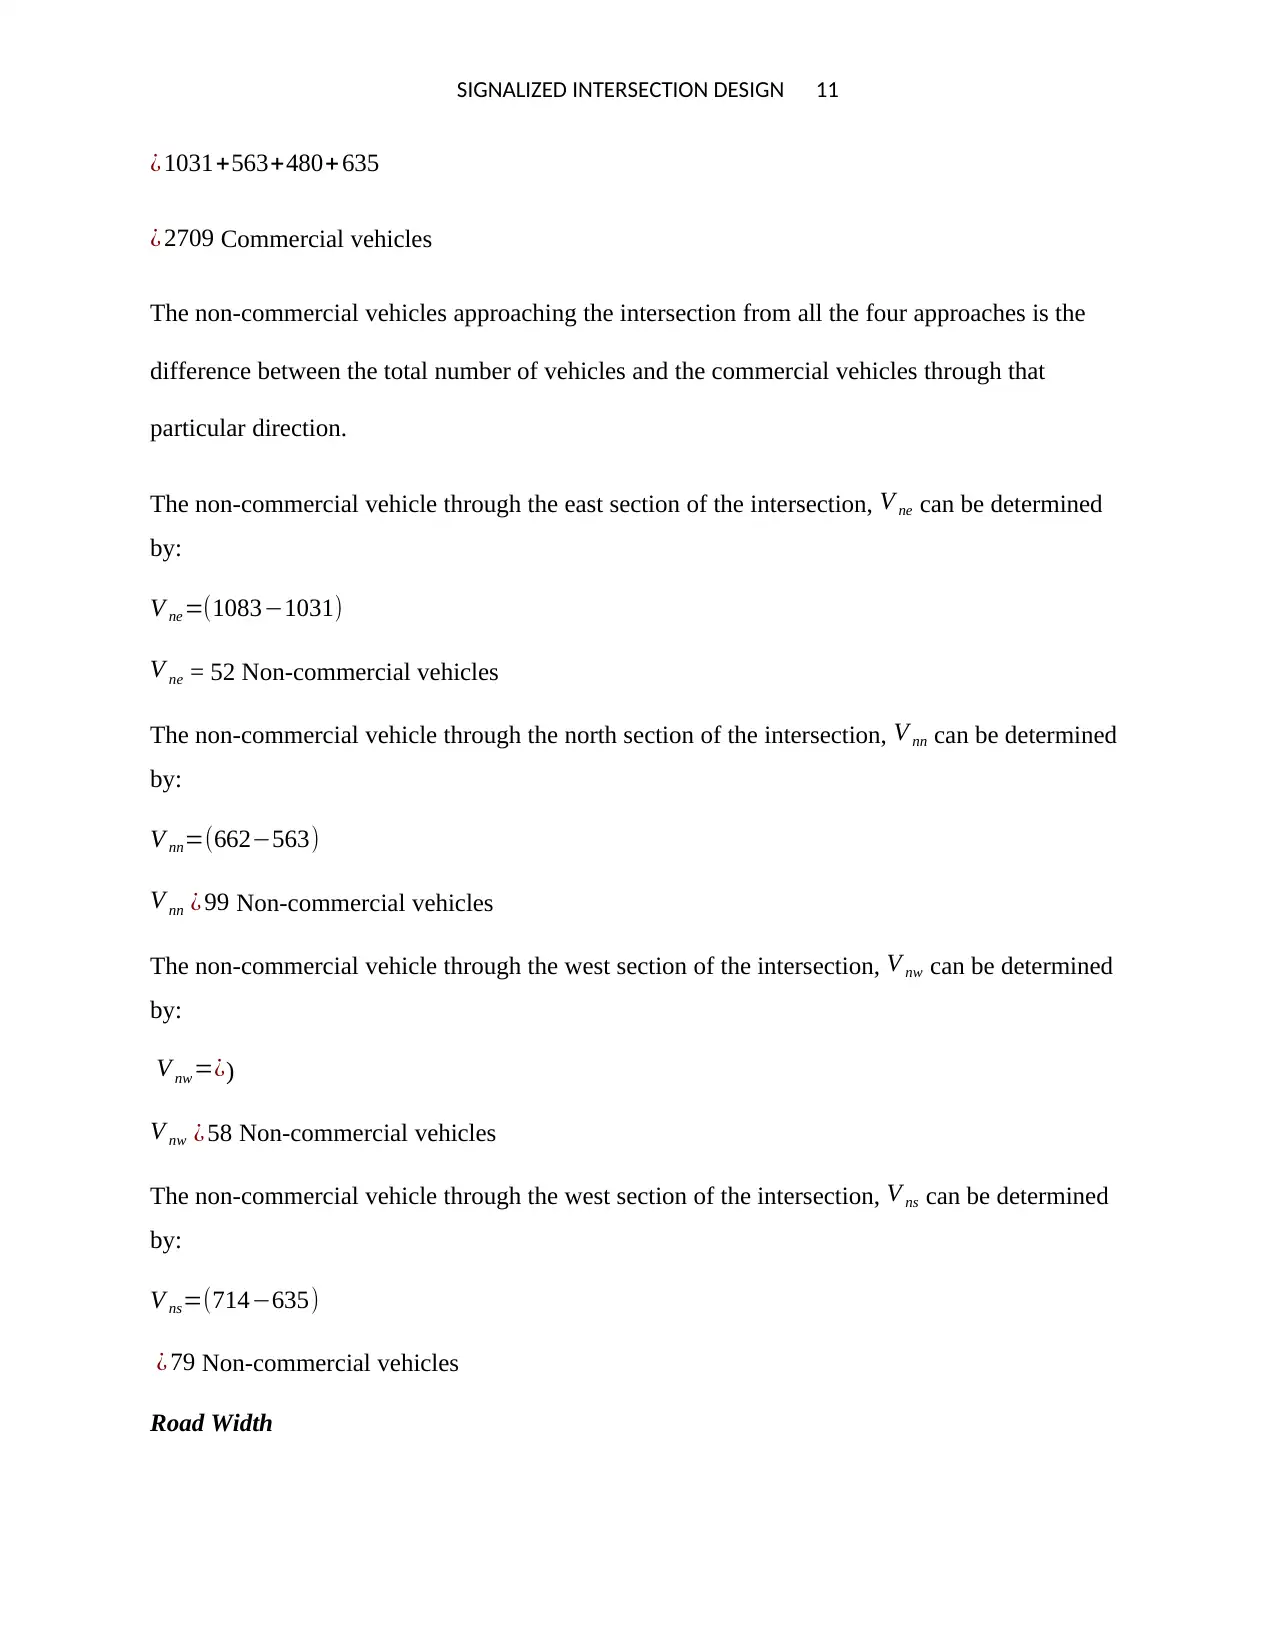
¿ 1031+563+480+ 635
¿ 2709 Commercial vehicles
The non-commercial vehicles approaching the intersection from all the four approaches is the
difference between the total number of vehicles and the commercial vehicles through that
particular direction.
The non-commercial vehicle through the east section of the intersection, V ne can be determined
by:
V ne =(1083−1031)
V ne = 52 Non-commercial vehicles
The non-commercial vehicle through the north section of the intersection, V nn can be determined
by:
V nn=(662−563)
V nn ¿ 99 Non-commercial vehicles
The non-commercial vehicle through the west section of the intersection, V nw can be determined
by:
V nw=¿)
V nw ¿ 58 Non-commercial vehicles
The non-commercial vehicle through the west section of the intersection, V ns can be determined
by:
V ns=(714−635)
¿ 79 Non-commercial vehicles
Road Width
SIGNALIZED INTERSECTION DESIGN 12
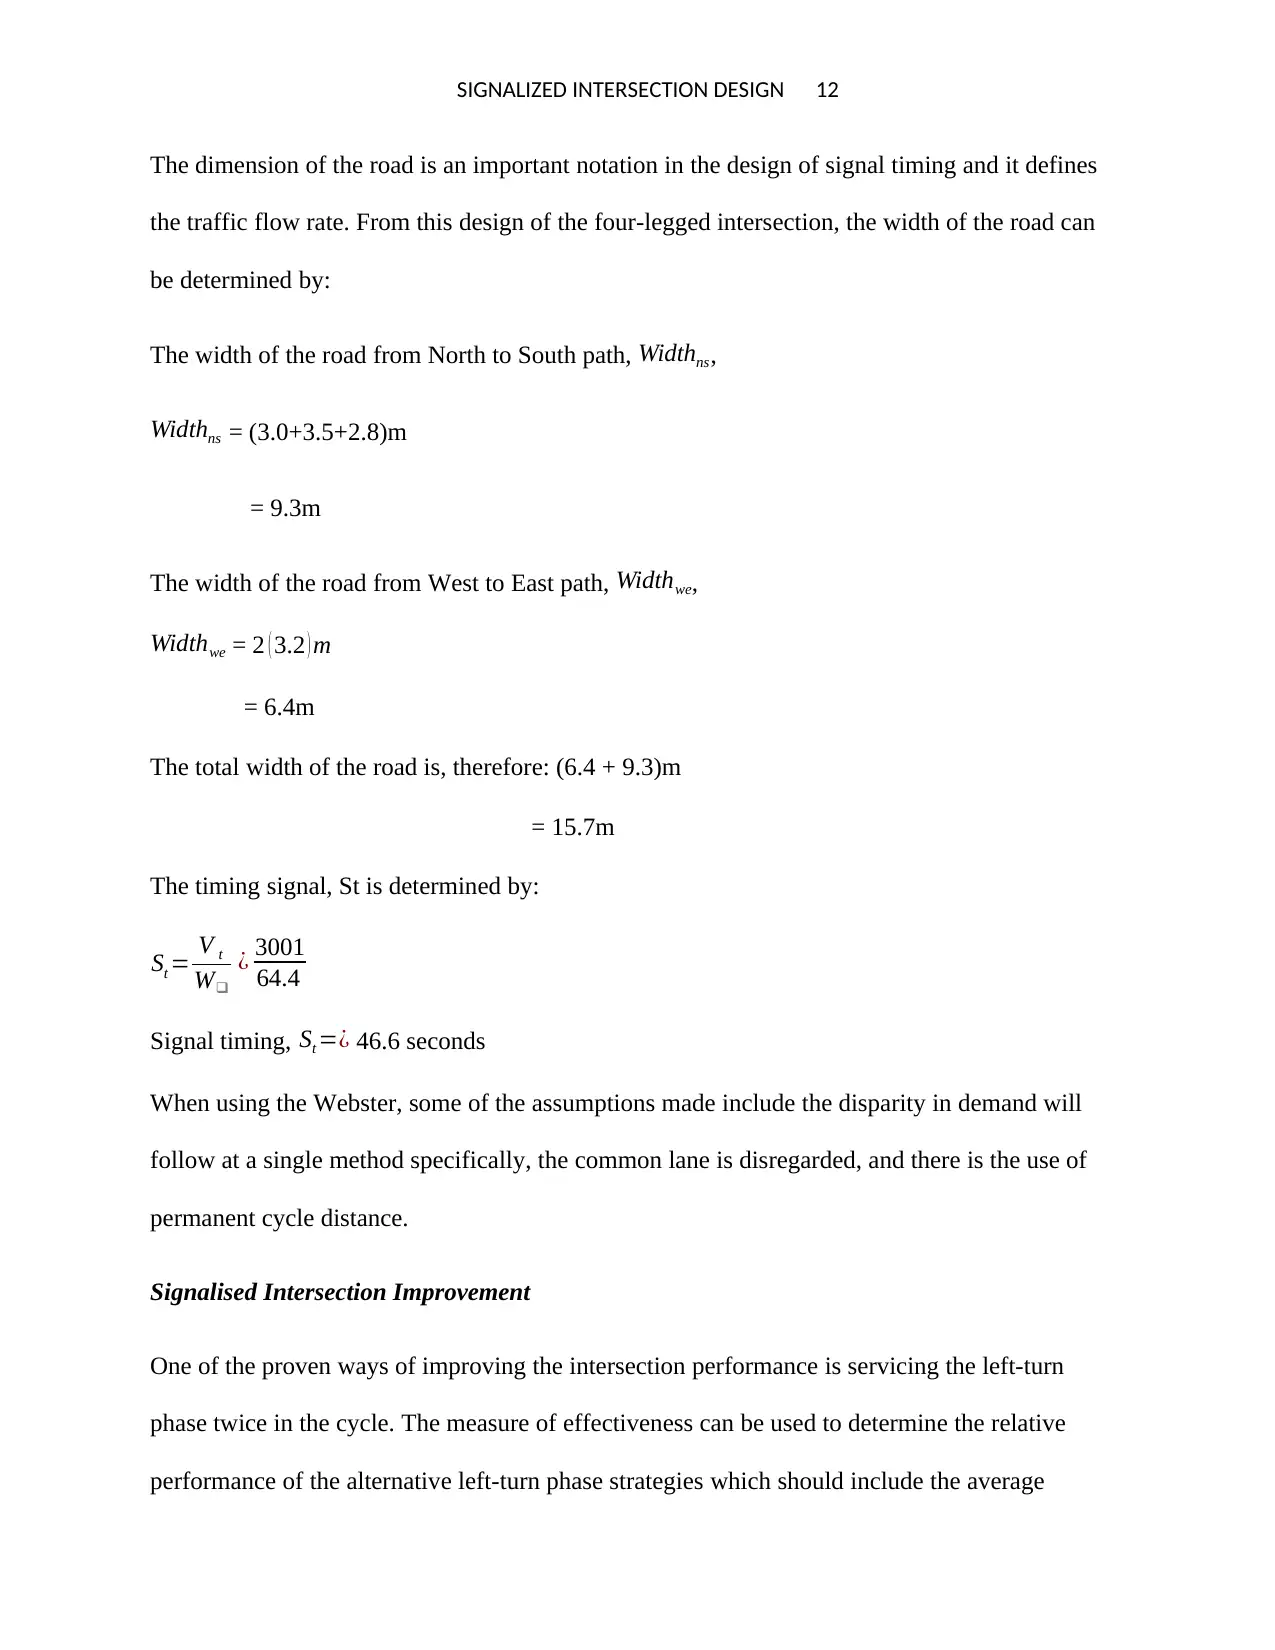
The dimension of the road is an important notation in the design of signal timing and it defines
the traffic flow rate. From this design of the four-legged intersection, the width of the road can
be determined by:
The width of the road from North to South path, Widthns,
Widthns = (3.0+3.5+2.8)m
= 9.3m
The width of the road from West to East path, Widthwe,
Widthwe = 2 ( 3.2 ) m
= 6.4m
The total width of the road is, therefore: (6.4 + 9.3)m
= 15.7m
The timing signal, St is determined by:
St = V t
W❑
¿ 3001
64.4
Signal timing, St =¿ 46.6 seconds
When using the Webster, some of the assumptions made include the disparity in demand will
follow at a single method specifically, the common lane is disregarded, and there is the use of
permanent cycle distance.
Signalised Intersection Improvement
One of the proven ways of improving the intersection performance is servicing the left-turn
phase twice in the cycle. The measure of effectiveness can be used to determine the relative
performance of the alternative left-turn phase strategies which should include the average
⊘ This is a preview!⊘
Do you want full access?
Subscribe today to unlock all pages.
Trusted by 1+ million students worldwide
SIGNALIZED INTERSECTION DESIGN 13
intersection delay per cycle length and hourly in the entire left-turn phases. From the
investigation, it can be recommended that the dual left-turn phases in a cycle can be considered
an effective method of improving the efficiency of signalized intersection in the situation above.
Other ways of ensuring that efficiency of signalized intersection include optimization of signal
timing, giving considerations to all turning movements at the intersection, and maintaining
continuity lane.
Conclusion
The signalized design can be designed to accommodate a variety of road users and can be
either temporal or spatial separation depending on the diverse users targeted. At signalized
intersections, numerous movements are separated in time and hence the risk to submissive
cyclists is normally lower compared to unsignalized intersections. The steps involved in
signalized intersection design include phase design, amber determination and succeeding
clearance time, length cycle determination, distribution of green time, pedestrian crossing
requirement, and performance evaluation.
Paraphrase This Document
Need a fresh take? Get an instant paraphrase of this document with our AI Paraphraser
SIGNALIZED INTERSECTION DESIGN 14
Reference
Akcelik, R. (2011). Signalised Intersection Capacity Workshop. Melbourne: Northwestern University.
Australian, B. (2013). Road & Transport Research, Volume 12. Perth: Australian Road Research Board.
Bell, M. (2011). Transport Planning and Traffic Engineering. Gold Coast: Elsevier,
Florida, D. (2016). Determination of an Optimal Analytical Intersection Design Procedure. Florida:
University of Florida, Transportation Research Center.
Guberinic, S. (2009). Optimal Traffic Control:. London: CRC Press.
Michael, B. (2011). Transport Planning and Traffic Engineering. Sydney: Elsevier.
Pratelli, A. (2013). Urban Street Design & Planning. Michigan: WIT Press.
Sarna, A. (2009). Design and performance characteristics of signalised intersections. California: Central
Road Research Institute.
University, M. (2009). Traffic Engineering & Control, Volume 35. Michigan: Printerhall.
Wade, K. (2011). Traffic Engineering Practice. Perth: Monash University.
Wolhuter, K. (2015). Geometric Design of Roads Handbook. Colorado: CRC Press.

SIGNALIZED INTERSECTION DESIGN 15
⊘ This is a preview!⊘
Do you want full access?
Subscribe today to unlock all pages.
Trusted by 1+ million students worldwide

SIGNALIZED INTERSECTION DESIGN 16
1 out of 16
Related Documents


Your All-in-One AI-Powered Toolkit for Academic Success.
+13062052269
info@desklib.com
Available 24*7 on WhatsApp / Email
![[object Object]](/_next/static/media/star-bottom.7253800d.svg)
Unlock your academic potential
© 2024 | Zucol Services PVT LTD | All rights reserved.