Singapore Macroeconomic Performance: 2005-2014 Analysis Report
VerifiedAdded on 2020/03/07
|11
|2648
|59
Report
AI Summary
This report provides a comprehensive macroeconomic analysis of Singapore's economic performance from 2005 to 2014. It begins with an introduction to Singapore, highlighting its geographical location, population, and strong trade links. The analysis delves into key macroeconomic indicators, including real GDP, real GDP growth rate, and real GDP per capita, presenting graphical representations and discussing trends over the ten-year period. The report examines the impact of the global financial crisis and government measures on GDP. It then analyzes the labor market, discussing unemployment types (cyclical, structural, and frictional) and presenting unemployment trends with government interventions. Further, it assesses price level analysis, focusing on inflation trends, causes of inflation, and government measures to control it. The conclusion summarizes the key findings, emphasizing the impact of policies implemented and the overall economic trajectory of Singapore during the analyzed period.
Running Head: Singapore Economic Performance
Singapore Macroeconomic Analysis (2005-2014)
Student Name
Institutional Affiliation
Course/Number
Instructor Name
Due Date
Singapore Macroeconomic Analysis (2005-2014)
Student Name
Institutional Affiliation
Course/Number
Instructor Name
Due Date
Paraphrase This Document
Need a fresh take? Get an instant paraphrase of this document with our AI Paraphraser
Singapore Economic Performance 2
Singapore Macroeconomic Analysis (2005-2014)
Introduction
Singapore is an island country located in Southern Asia between Malaysia and
Indonesia. Its size is 697 sq km with 10 sq km being covered by water and the rest by
land (Cia.gov, 2017). This economy’s population is approximately 5.8 million. The
economy has strong trade links and is a major tourist destination. It has many natural
and artificial features that has contributed to its improved demand for tourism activities.
The improvements in the transportation sector has improved the trading networks with
other major trading economies. This economy has the busiest port in the world (the
Singapore port); the number of containers handled in this port are many in comparison
to other major ports. This economy has been experiencing growth in the current years
owing to the improved performance in the manufacturing sector attributed to increased
external demand (FocusEconomics, 2017).
Production Output Performance Analysis
Singapore Real GDP
The definition of GDP provided by many scholarly articles and many economists
is that it is a monetary value of everything a country produces in the given year. Its
measure of economic growth is that it is an important true for deriving the real growth
rate and the GDP per capita. The higher the real GDP, the higher the GDP per capita if
there is no variation in the population change. It is referred to as real GDP when it is in
the constant prices; meaning that it is estimated with a basis of a set year price. This
ensures that a change in prices does not cause a change in GDP that cannot be
compared with the other years.
Singapore Economic Performance 3
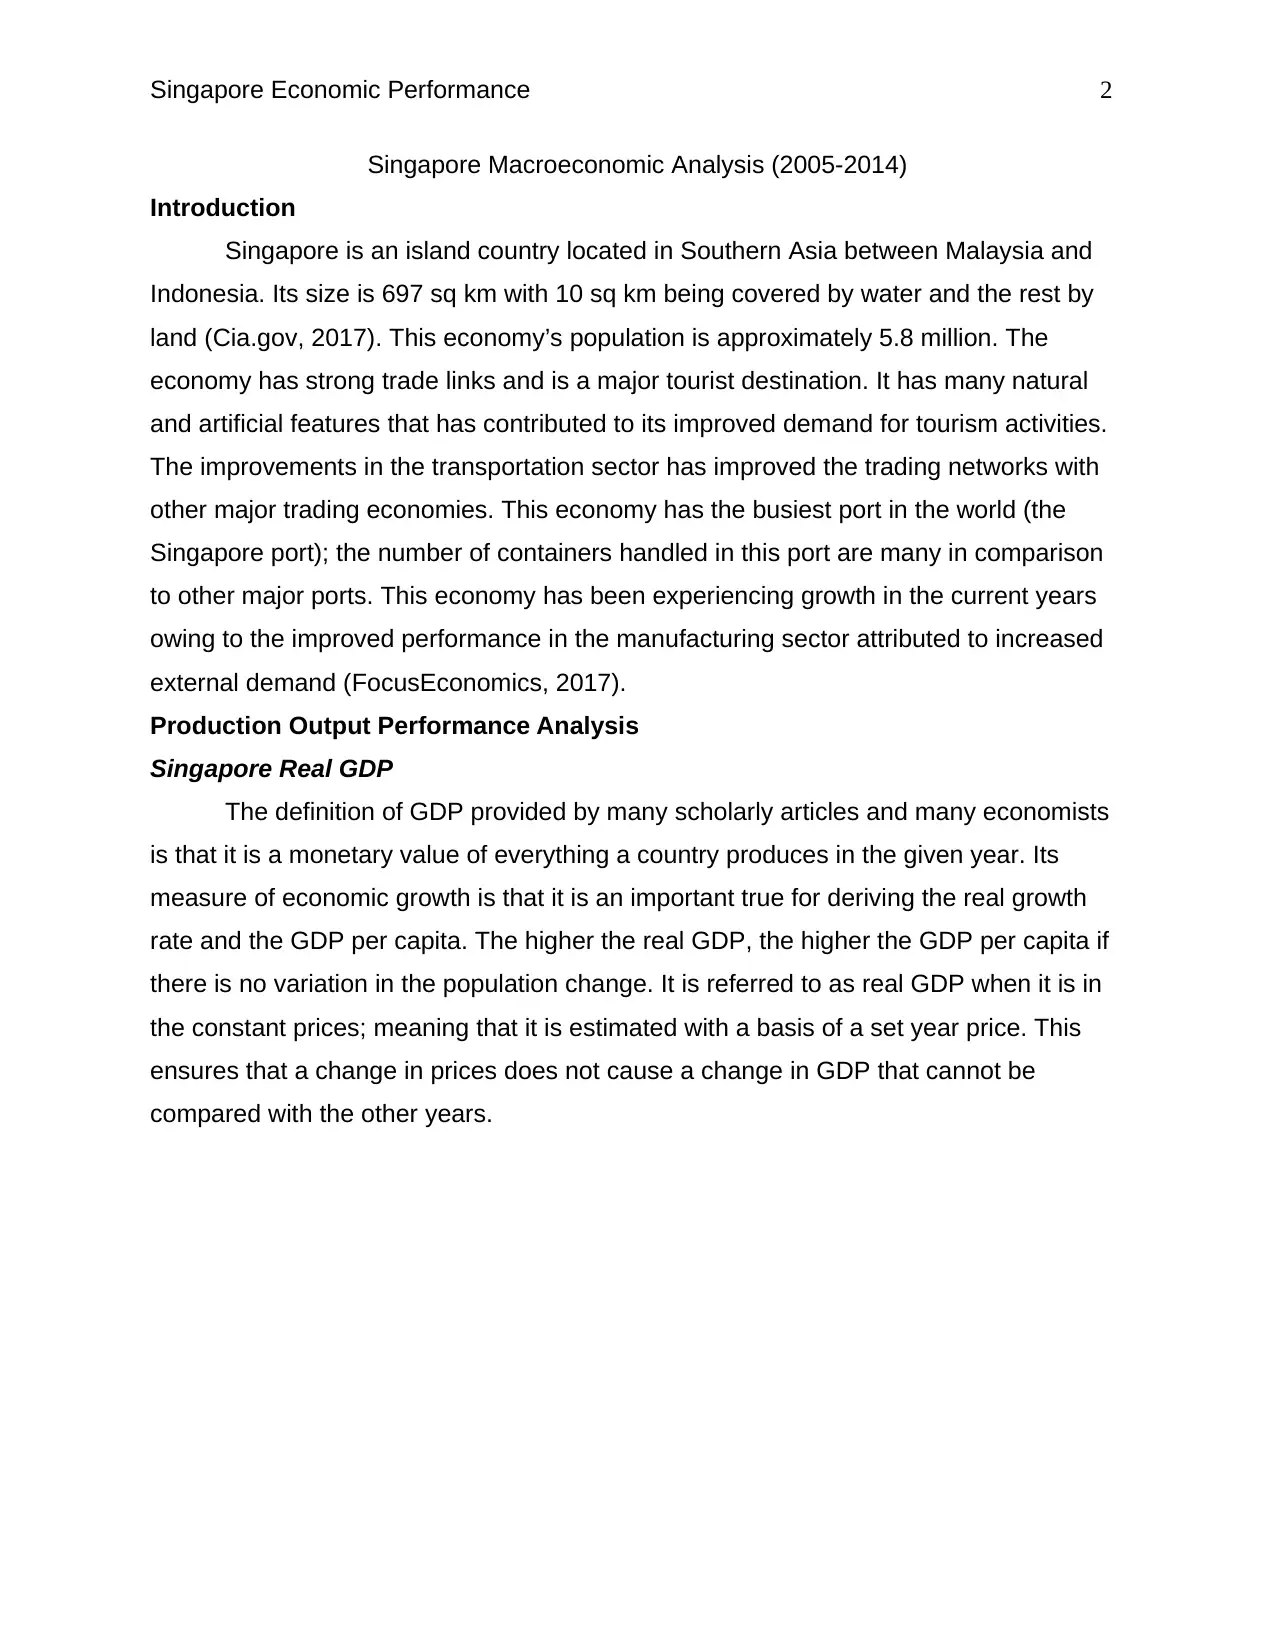
Fig: Real GDP for Singapore
2005 2006 2007 2008 2009 2010 2011 2012 2013 2014
0
50
100
150
200
250
300
350
400
450
Real GDP for Singapore
Year
Real GDP (Billions)
The total monetary value of all goods produced within the Singapore boundaries
for the 10 years is presented in the graph above and is expressed into real terms. The
trend line is derived to show the direction in which production is taking, in the graph, the
real GDP can be argued to have gone up from 2005 to 2014. The increase have been
recorded every year except in 2009; this is because there was a global financial crisis
during this period which led to contraction of economies. Singapore was not much
affected by the GFC as there was an increase in the value of production if the
subsequent years.
Singapore Real GDP Growth Rate
The economy grows at different rate every year. It is nearly impossible for an
economy to experience an equal growth rate for two consecutive periods. The economic
situations are different every year and this explains the existing differences. Real GDP
growth rate is thus a measure of the changes in the Real GDP from a period to another.
It measures the economic performance in that it helps the policy makers and the
interested parties to determine whether the economy is contracting or expanding. Also
when the economy is expanding, it helps determine whether this is at an increasing or
⊘ This is a preview!⊘
Do you want full access?
Subscribe today to unlock all pages.
Trusted by 1+ million students worldwide
Singapore Economic Performance 4
decreasing rate. A healthy economy should be experiencing a periodical increasing
growth rate which is at an increasing rate.
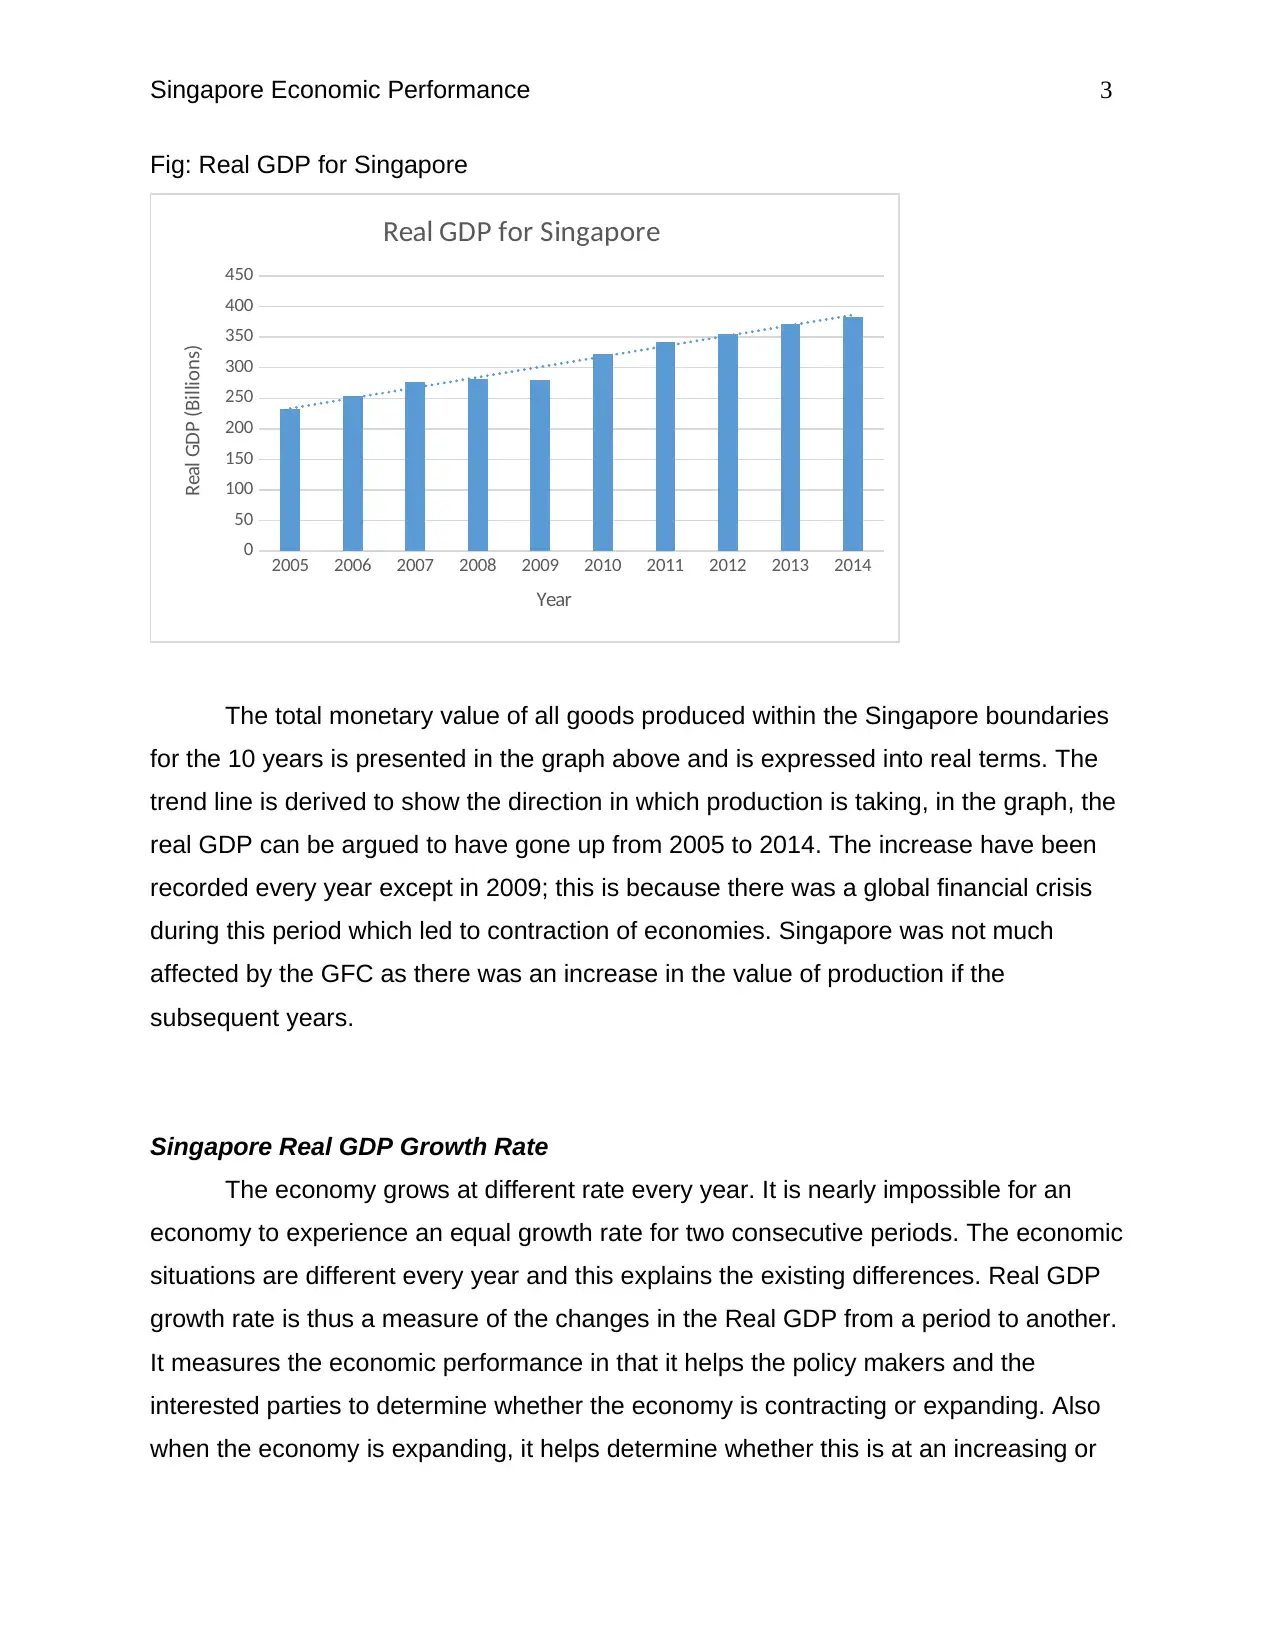
Fig: Singapore real GDP growth rate
2005 2006 2007 2008 2009 2010 2011 2012 2013 2014
-2
0
2
4
6
8
10
12
14
16
18
Real GDP Growth Rate for Singapore
Year
Real GDP Growth Rate (%)
The real GDP growth rate for Singapore was very impressive from 2005 to 2007;
an observation from the graph above can reveal an increasing growth rate during this
three years. There was a sharp decline in the growth rate in 2008 and a continued fall in
2009 where the economy’s growth rate was less than zero. The negative growth rate
coupled with the fact that the rate had fallen for two consecutive periods is an
explanation that Singapore was in a recession in 2009. The recession did not last for
long as a positive growth rate (highest level ever; more than 1.5 time the high level
recorded in 2007) was recorded. This was good for this economy but was not sustained
as there was a more than a half decline in 2011. The rate continues to fall and the
lowest rate since the recovery was achieved in 2010 got recorded in 2014. On average,
the Singaporean real GDP growth rate fell in this 10 year period as shown by the trend
line.
Singapore Real GDP per Capita
It is the division of the Real GDP value for an economy by its population that we arrive
at the real GDP per capita. It thus shows the worth of each individual in the given
economy. It is used in the estimation of economic growth as an economy’s health is
decreasing rate. A healthy economy should be experiencing a periodical increasing
growth rate which is at an increasing rate.
Fig: Singapore real GDP growth rate
2005 2006 2007 2008 2009 2010 2011 2012 2013 2014
-2
0
2
4
6
8
10
12
14
16
18
Real GDP Growth Rate for Singapore
Year
Real GDP Growth Rate (%)
The real GDP growth rate for Singapore was very impressive from 2005 to 2007;
an observation from the graph above can reveal an increasing growth rate during this
three years. There was a sharp decline in the growth rate in 2008 and a continued fall in
2009 where the economy’s growth rate was less than zero. The negative growth rate
coupled with the fact that the rate had fallen for two consecutive periods is an
explanation that Singapore was in a recession in 2009. The recession did not last for
long as a positive growth rate (highest level ever; more than 1.5 time the high level
recorded in 2007) was recorded. This was good for this economy but was not sustained
as there was a more than a half decline in 2011. The rate continues to fall and the
lowest rate since the recovery was achieved in 2010 got recorded in 2014. On average,
the Singaporean real GDP growth rate fell in this 10 year period as shown by the trend
line.
Singapore Real GDP per Capita
It is the division of the Real GDP value for an economy by its population that we arrive
at the real GDP per capita. It thus shows the worth of each individual in the given
economy. It is used in the estimation of economic growth as an economy’s health is
Paraphrase This Document
Need a fresh take? Get an instant paraphrase of this document with our AI Paraphraser
Singapore Economic Performance 5
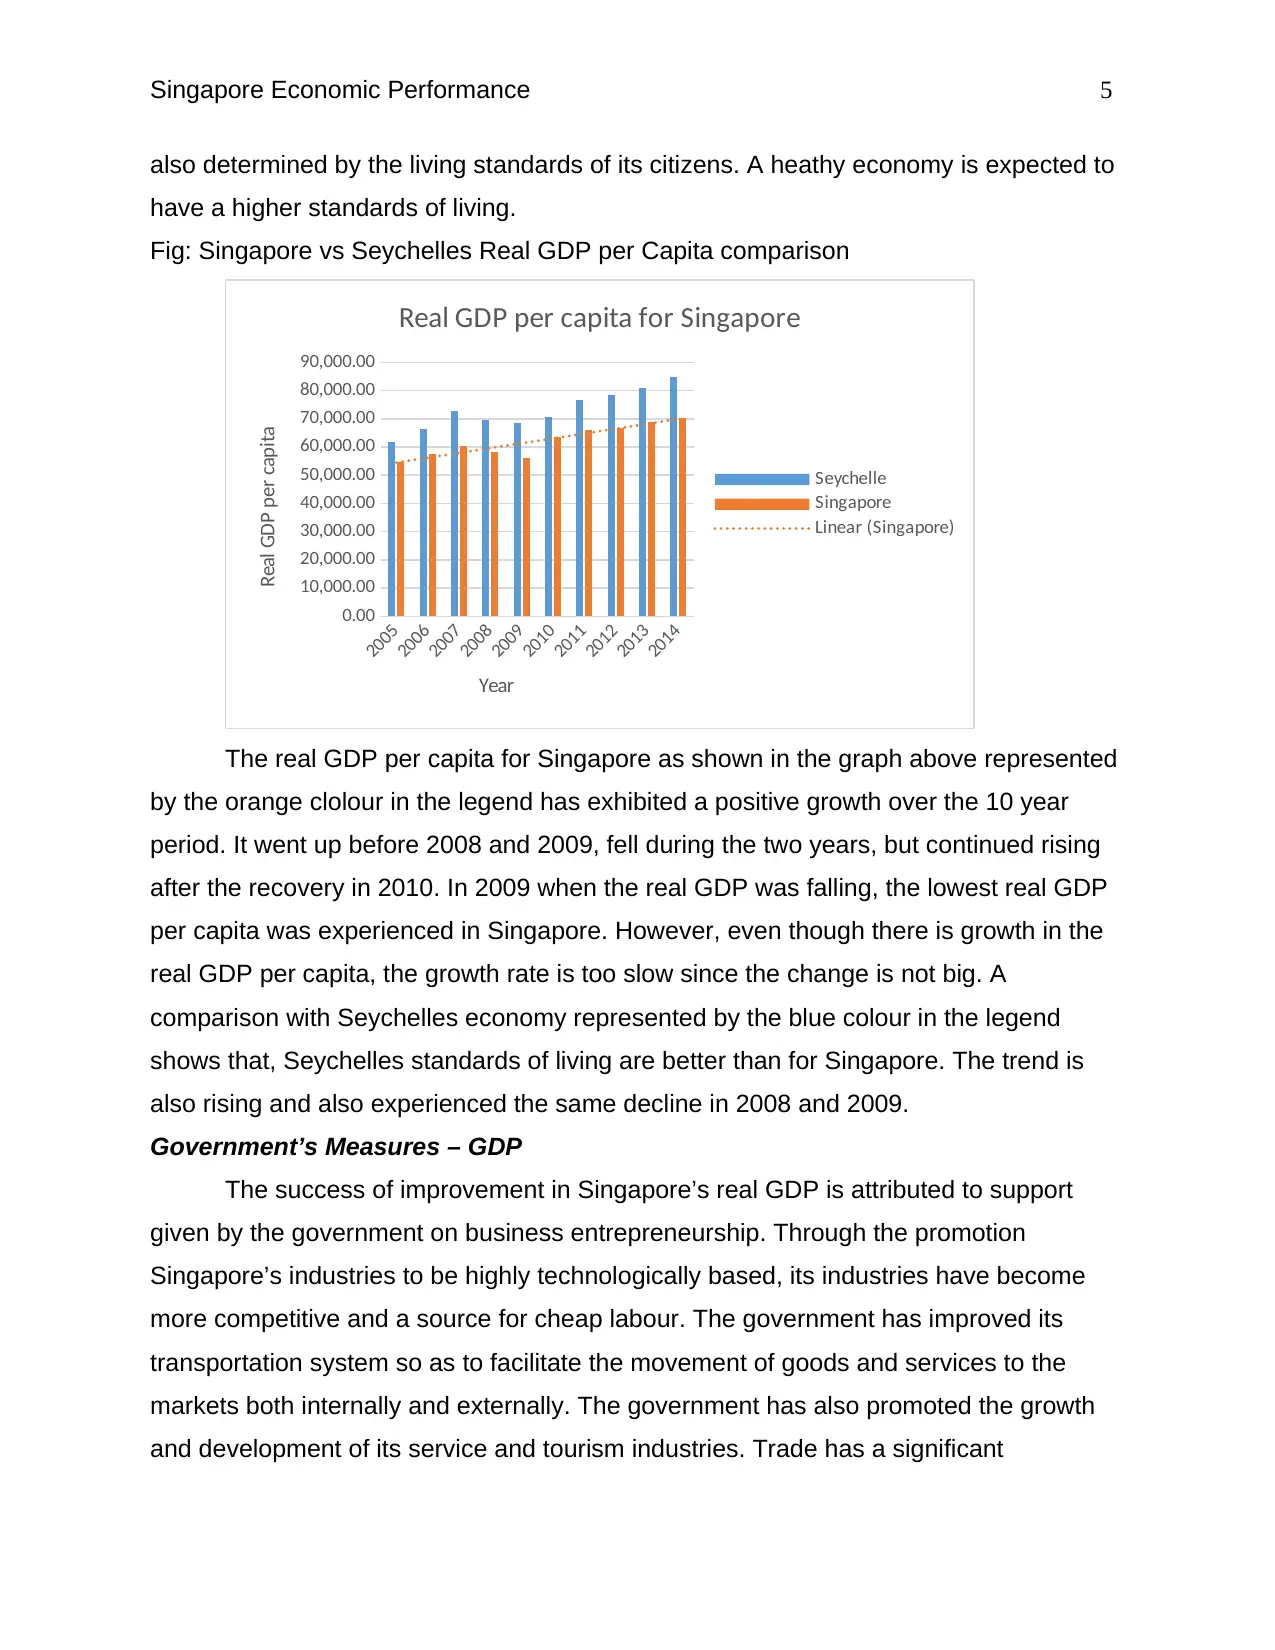
also determined by the living standards of its citizens. A heathy economy is expected to
have a higher standards of living.
Fig: Singapore vs Seychelles Real GDP per Capita comparison
2005
2006
2007
2008
2009
2010
2011
2012
2013
2014
0.00
10,000.00
20,000.00
30,000.00
40,000.00
50,000.00
60,000.00
70,000.00
80,000.00
90,000.00
Real GDP per capita for Singapore
Seychelle
Singapore
Linear (Singapore)
Year
Real GDP per capita
The real GDP per capita for Singapore as shown in the graph above represented
by the orange clolour in the legend has exhibited a positive growth over the 10 year
period. It went up before 2008 and 2009, fell during the two years, but continued rising
after the recovery in 2010. In 2009 when the real GDP was falling, the lowest real GDP
per capita was experienced in Singapore. However, even though there is growth in the
real GDP per capita, the growth rate is too slow since the change is not big. A
comparison with Seychelles economy represented by the blue colour in the legend
shows that, Seychelles standards of living are better than for Singapore. The trend is
also rising and also experienced the same decline in 2008 and 2009.
Government’s Measures – GDP
The success of improvement in Singapore’s real GDP is attributed to support
given by the government on business entrepreneurship. Through the promotion
Singapore’s industries to be highly technologically based, its industries have become
more competitive and a source for cheap labour. The government has improved its
transportation system so as to facilitate the movement of goods and services to the
markets both internally and externally. The government has also promoted the growth
and development of its service and tourism industries. Trade has a significant
Singapore Economic Performance 6
contribution to its real GDP and thus to promote trade, the government supports the
ASEAN Free Trade Area (AFTA) and also the maintenance of membership with many
regional organizations.
Labour Market Analysis
Unemployment Types
The global definition of unemployment is under three conditions according to
Stats.mom.gov.sg (2016); one is that it includes only those who have no jobs, second
these people must have been actively looking for a job, and lastly they must be willing to
take any job offered to them. Unemployment have different causes which results in
different categorization of unemployment types based on the causes. One of the causes
is the presence of business cycles; this category is the cyclical unemployment. It is
dependent on the performances by the businesses in an economy. In a period of slow
economic growth such as during a recession, the unemployment rate rises; businesses
contraction results in the cut on the number of workers since demand in the economy
falls making the businesses to produce less. The second cause is the technological
advancements; this category is the structural unemployment. It is dependent on the
structural changes resulting from technological advancements. Workers who are not
able to keep up with the advancing technology are laid off. New technology demands
unique skills that may not be held by all the workers. Unless these workers find another
job matching their current skills, the may be forced to acquire the demanded skills or to
remain unfit for the available job vacancies. According to Feng (2015), structural
unemployment is evident in Singapore as there exist unfilled job vacancies annually.
The third cause is the information asymmetry; this is the frictional unemployment
category. It is dependent on the information on job vacancies presented to the job
seekers, and the information on the suitability of a job seeker to the employers. The
labor markets are not efficient in informing all the job seekers of the available jobs
(Tucker, 2008). Some people lack the means of receiving such information and may
take time before accessing it.
⊘ This is a preview!⊘
Do you want full access?
Subscribe today to unlock all pages.
Trusted by 1+ million students worldwide
Singapore Economic Performance 7
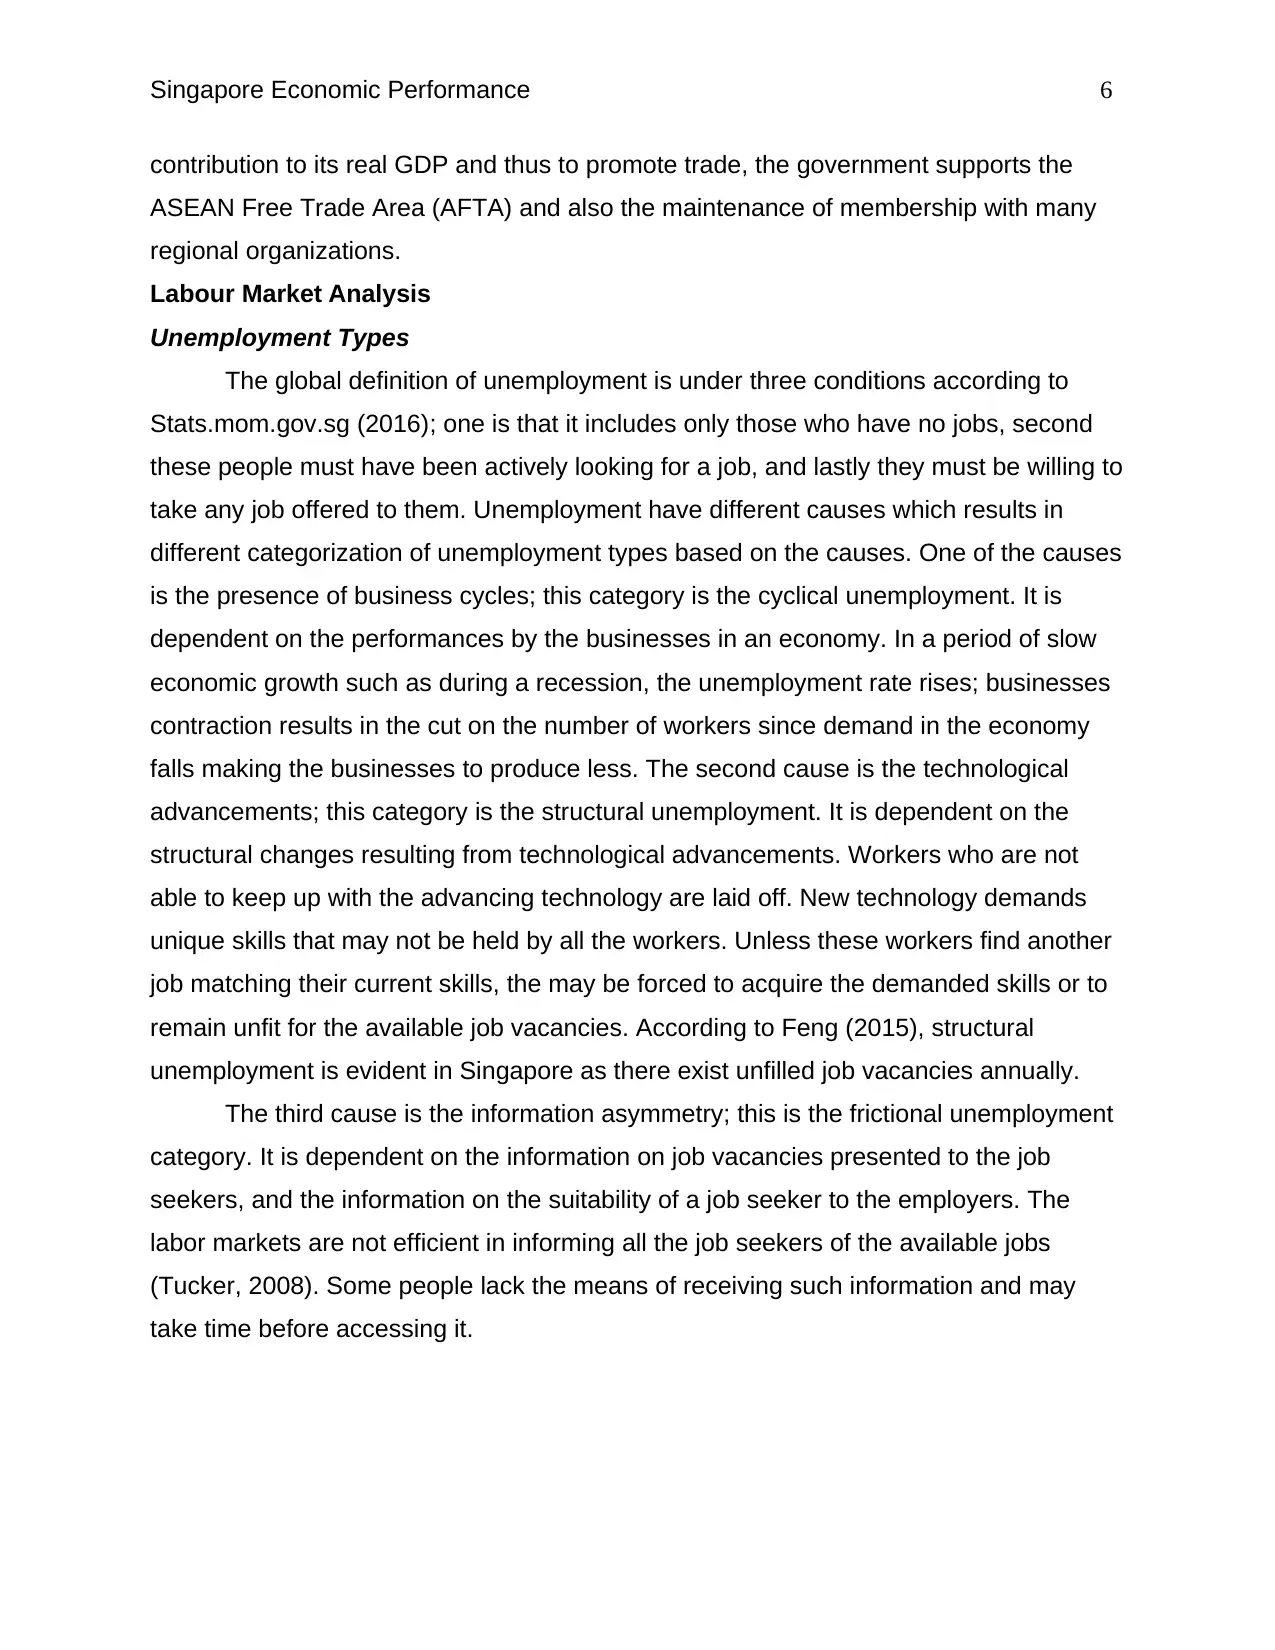
Unemployment Trend in Singapore
Fig: Unemployment in Singapore
2005 2006 2007 2008 2009 2010 2011 2012 2013 2014
0
0.5
1
1.5
2
2.5
3
3.5
Unemployment Rate for Singapore
Year
Unemployment Rate
The falling Singaporean unemployment trend observed in the graph above is an
indicator that there is improvements in its labor market. The unemployment rate was
highest in 2005 and fell continuously for the next two years. It rose for the next two
years (2008 and 2009). The rate fell in 2010 and continued declining until 2013, but a
small rise was observed in 2014.
Government Measures – Unemployment
The government has ensured the presence of various organizations that facilitate
the matching of jobs at the lowest time possible for example the Community
Development Council (CDC). It has also ensured a strong networking of companies in
order to control frictional unemployment by improving the accessibility of information;
this is facilitated by Singapore Workforce Development Agency (WDA) (Jie, 2017). He
also noted that Employment & Employability Institute (E2I) and the WDA runs programs
to upgrade workers skills; this controls structural unemployment. Seow (2016) also
noted that the government formulated a program for career support for the workers
under 40 years looking for a job.
Paraphrase This Document
Need a fresh take? Get an instant paraphrase of this document with our AI Paraphraser
Singapore Economic Performance 8
Price Level Analysis
Inflation Trend in Singapore
Inflation is a major concern since it is not good for an economy. It is a loss in the
purchasing power for an economy’s currency owing to an increased general price level.
During an inflation, the income held cannot buy the same amount of goods as it could
before the inflation; it thus causes the standard of living to fall as households are force
to spend more income to buy less goods.
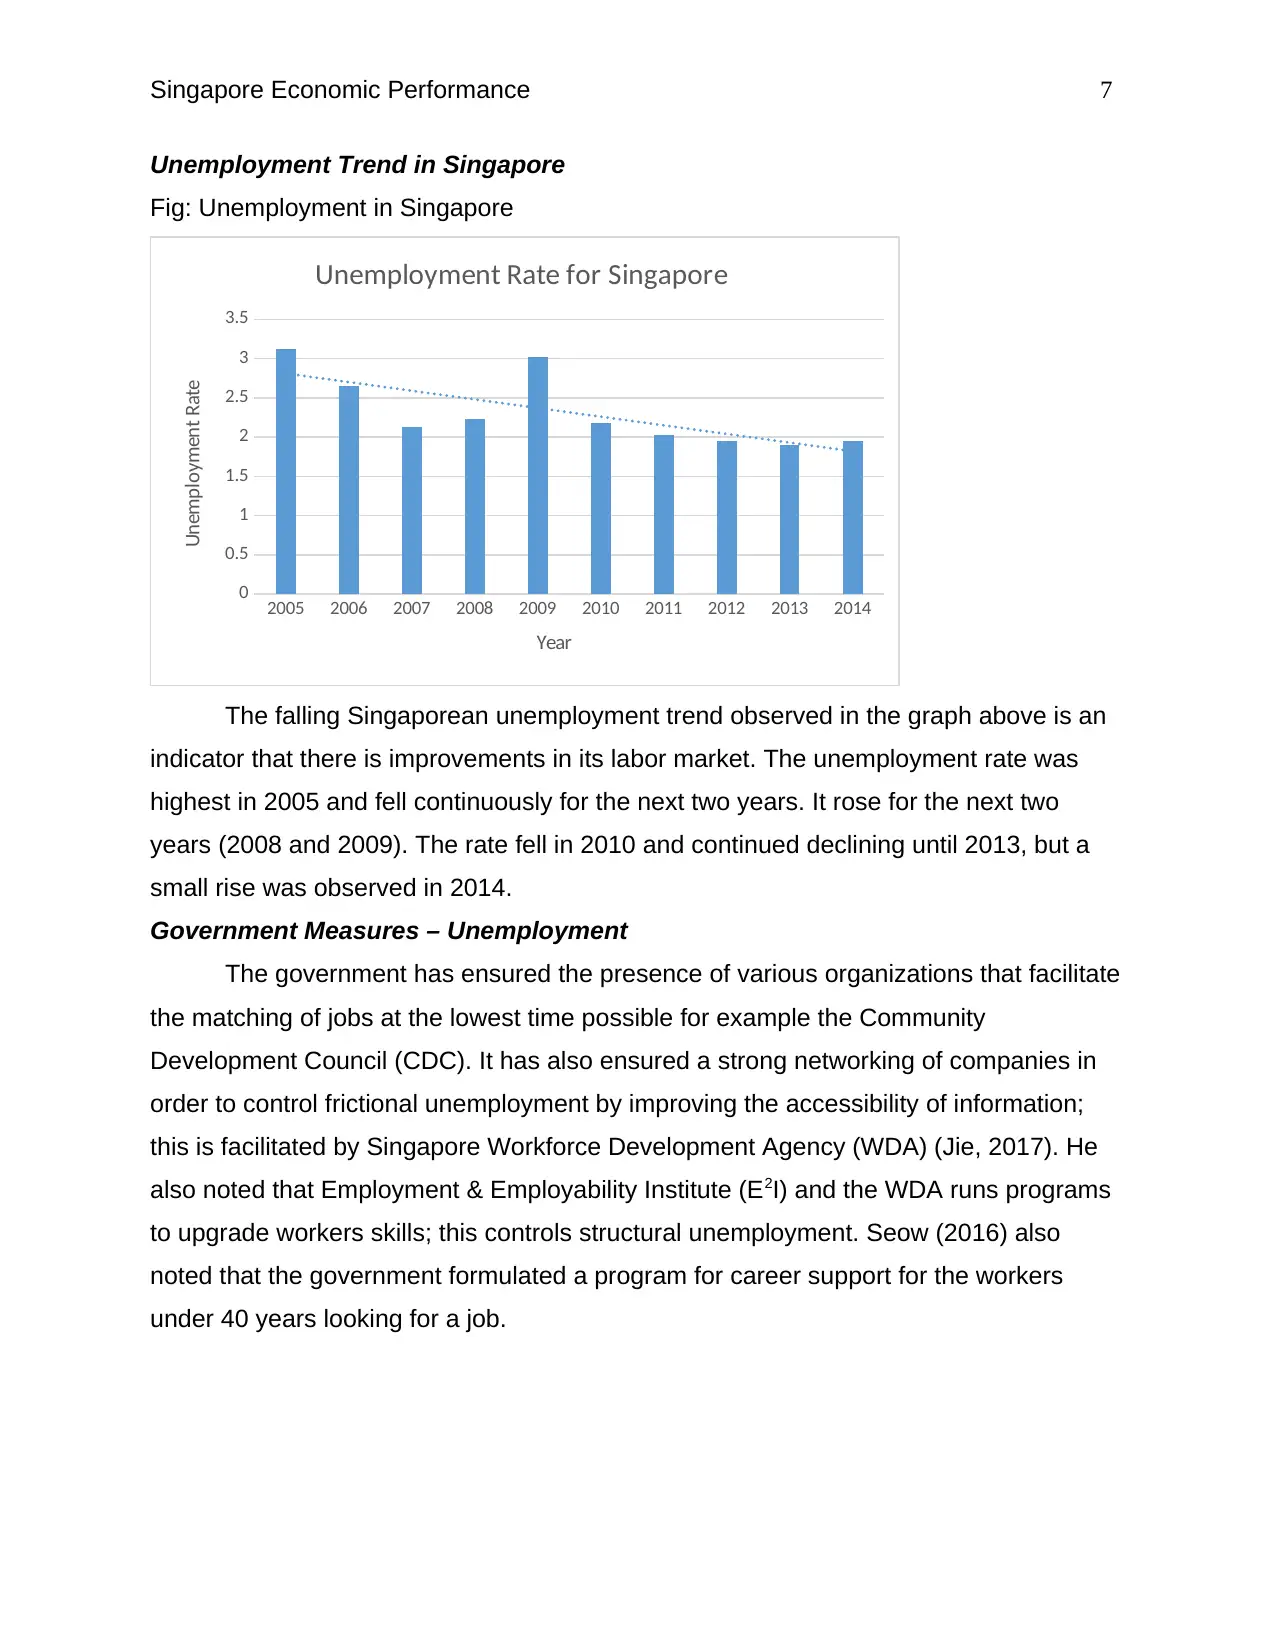
Fig: Singapore Inflation rate
2005 2006 2007 2008 2009 2010 2011 2012 2013 2014
0
1
2
3
4
5
6
7
Inflation Rate for Singapore
Year
Inflation Rate (%)
A rising trend of Singaporean inflation rate is observed in the graph above. Very
low inflation rate is as bad to the economy as high inflation rate. The lowest inflation rate
for Singapore was present in 2005 and rose for the next three years. The inflation rate
in Singapore was very high in 2008 for the 10 year period. A low rate closer to that
recorded in 2005 was recorded in 2009. The rate went up in the next two years but
started falling again in 2012. Since 2011, the Singaporean inflation rate was on a falling
trend till 2014. For the 10 years period, the economy experienced high inflation rate in
the last 5 years.
Causes of Inflation
Inflation is caused by both the demand and supply forces. The demand forces
are stimulated by the government expansionary monetary policies. For instance the
increase in money supply by the government’s bank results in increased money in the
Price Level Analysis
Inflation Trend in Singapore
Inflation is a major concern since it is not good for an economy. It is a loss in the
purchasing power for an economy’s currency owing to an increased general price level.
During an inflation, the income held cannot buy the same amount of goods as it could
before the inflation; it thus causes the standard of living to fall as households are force
to spend more income to buy less goods.
Fig: Singapore Inflation rate
2005 2006 2007 2008 2009 2010 2011 2012 2013 2014
0
1
2
3
4
5
6
7
Inflation Rate for Singapore
Year
Inflation Rate (%)
A rising trend of Singaporean inflation rate is observed in the graph above. Very
low inflation rate is as bad to the economy as high inflation rate. The lowest inflation rate
for Singapore was present in 2005 and rose for the next three years. The inflation rate
in Singapore was very high in 2008 for the 10 year period. A low rate closer to that
recorded in 2005 was recorded in 2009. The rate went up in the next two years but
started falling again in 2012. Since 2011, the Singaporean inflation rate was on a falling
trend till 2014. For the 10 years period, the economy experienced high inflation rate in
the last 5 years.
Causes of Inflation
Inflation is caused by both the demand and supply forces. The demand forces
are stimulated by the government expansionary monetary policies. For instance the
increase in money supply by the government’s bank results in increased money in the
Singapore Economic Performance 9
circulation and thus the households’ income expands. The households demand goes up
creating an excessive demand which pushes up the price level. On the other hand, the
supply forces are stimulated by the increase price of output resulting from an increased
price of raw materials. The higher the costs of production, the higher the price of
outputs.
Government Measures – Inflation
During the periods when inflation rate in Singapore was high, the government
implemented the policy of allowing its currency to appreciate so as to ensure tightening
of the monetary policy (Mof.gov.sg, 2012). This was aimed to curb demand-led or
imported inflation e.g. on food. Inflation is noted to result mainly on food,
accommodation and transportation. The government has also introduced policies to
supply build-on-order flats and other private residential houses to curb the rising
housing prices (Kit, 2016).
Conclusion
Since the GFC, Singapore economy’s real growth rate has been too low; it’s only
in 2010 when the growth rate was extremely impressive. It is as if the policy
implemented in 2009 to stimulate growth were not sustainable for this economy from
2011 to 2014. However the policies can be argued to have worked effectively to bring
massive growth in 2010. The real GDP for Singapore has been rising even though its
GDP growth rate has been falling. The positive low records made is an explanation that
Singapore is growing at a decreasing rate. All the macroeconomic indicator have one
thing in common; there was a poor performance in 2008-09. All the indicators are
interrelated; it can be observed that similar movement were recorded in the 10 year
period. Finally it can be concluded that the Singaporean economy does not have a good
economic performance. Even with some indicators like unemployment rate performing
well, the rate is still too high and the decline is insignificance. Therefore, a healthy
economy can be argued to a country whose all the macroeconomic indicators records a
positive desired movement.
⊘ This is a preview!⊘
Do you want full access?
Subscribe today to unlock all pages.
Trusted by 1+ million students worldwide
Singapore Economic Performance 10
Bibliography
Cia.gov. (2017). The World Factbook — Central Intelligence Agency. Cia.gov. Retrieved
14 August 2017, from https://www.cia.gov/library/publications/the-world-
factbook/geos/sn.html.
Feng, Y. (2015). Unemployment Rate in Singapore. DollarsAndSense.sg. Retrieved 15
August 2017, from http://dollarsandsense.sg/unemployment-rate-in-singapore/.
FocusEconomics. (2017). Singapore Economic Outlook. FocusEconomics. Retrieved 14
August 2017, from http://www.focus-economics.com/countries/singapore.
Heritage.org. (2017). Singapore Economy: Population, GDP, Inflation, Business, Trade,
FDI, Corruption. Heritage.org. Retrieved 15 August 2017, from
http://www.heritage.org/index/country/singapore.
Imf.org. (2017). Report for Selected Countries and Subjects. Imf.org. Retrieved 14
August 2017, from
https://www.imf.org/external/pubs/ft/weo/2016/02/weodata/weorept.aspx?
pr.x=68&pr.y=14&sy=2005&ey=2014&scsm=1&ssd=1&sort=country&ds=.&br=1
&c=718%2C576&s=NGDPRPC&grp=0&a=.
Jie, W. (2017). Measure to Reduce Unemployment. Scribd. Retrieved 15 August 2017,
from https://www.scribd.com/doc/56052178/Measure-to-Reduce-Unemployment.
Kit, T. (2016). Breaking Singapore's record streak of negative inflation: 5 key questions.
Channel NewsAsia. Retrieved 16 August 2017, from
http://www.channelnewsasia.com/news/business/breaking-singapore-s-record-
streak-of-negative-inflation-5-key-q-7656780.
Mof.gov.sg. (2012). Government Measures to Contain Rising Costs and Help Lower
Income Group. Mof.gov.sg. Retrieved 15 August 2017, from
http://www.mof.gov.sg/news-reader/articleid/325/parentId/59/year/2012?
category=Parliamentary%20Replies.
Seow, J. (2016). Parliament: New measures to help unemployed Singaporeans and
employers who take them on. The Straits Times. Retrieved 15 August 2017, from
http://www.straitstimes.com/singapore/manpower/new-measures-to-help-
unemployed-singaporeans-and-employers-who-take-them-on.
Paraphrase This Document
Need a fresh take? Get an instant paraphrase of this document with our AI Paraphraser
Singapore Economic Performance 11
Stats.mom.gov.sg. (2016). Unemployment. Stats.mom.gov.sg. Retrieved 15 August
2017, from http://stats.mom.gov.sg/SL/Pages/Unemployment-FAQs.aspx?
Flag=2&Category=FAQ.
Tucker, B. (2008). Survey of economics. Mason, OH: South-Western Cengage
Learning.
Stats.mom.gov.sg. (2016). Unemployment. Stats.mom.gov.sg. Retrieved 15 August
2017, from http://stats.mom.gov.sg/SL/Pages/Unemployment-FAQs.aspx?
Flag=2&Category=FAQ.
Tucker, B. (2008). Survey of economics. Mason, OH: South-Western Cengage
Learning.
1 out of 11
Related Documents


Your All-in-One AI-Powered Toolkit for Academic Success.
+13062052269
info@desklib.com
Available 24*7 on WhatsApp / Email
![[object Object]](/_next/static/media/star-bottom.7253800d.svg)
Unlock your academic potential
Copyright © 2020–2026 A2Z Services. All Rights Reserved. Developed and managed by ZUCOL.