SIT718 Real World Analytics
This assignment will test your knowledge and understanding of the aggregation functions and their applications for data summarization and prediction. This assignment will also test your ability in R programming, in using specific R commands as well as R packages.
9 Pages2017 Words57 Views
Added on 2023-01-05
About This Document
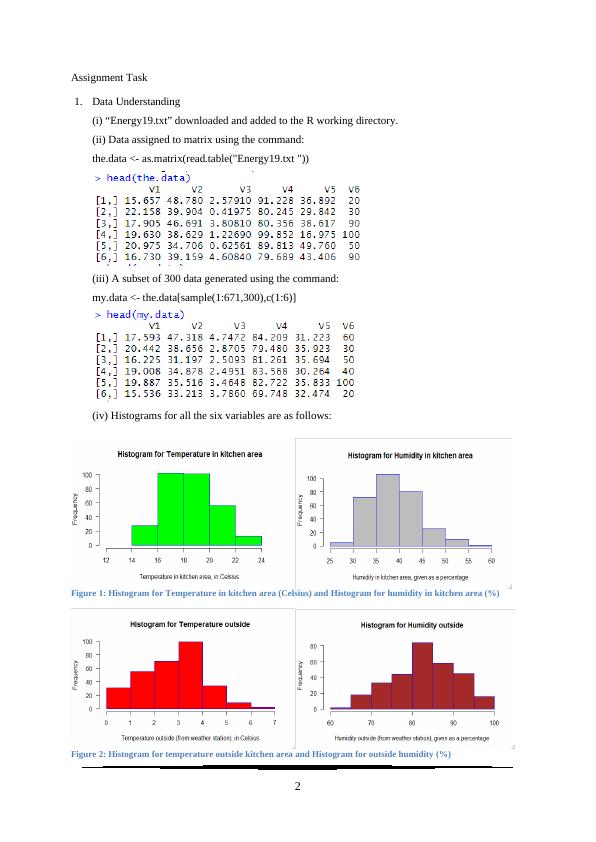
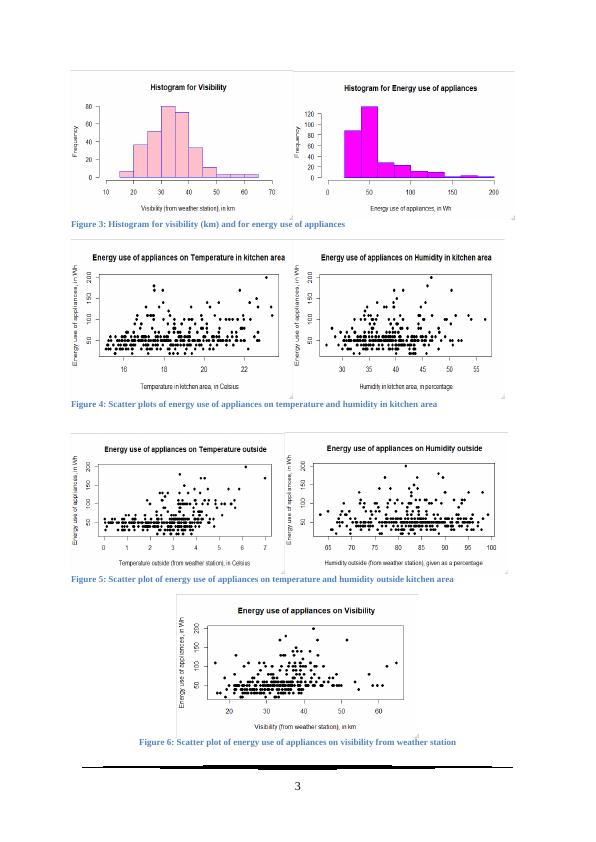
This document discusses the importance of variables and linear regression modeling in real world analytics. It explores the correlations and distributions of different variables related to energy use of appliances. The document also introduces the concepts of QAM, OWA, and Choquet integral fitting functions and their parameters. Additionally, it provides insights on using the models for prediction and compares the results with linear regression modeling. The document concludes with a discussion on the significance of the predictors and the overall fit of the models.
SIT718 Real World Analytics
This assignment will test your knowledge and understanding of the aggregation functions and their applications for data summarization and prediction. This assignment will also test your ability in R programming, in using specific R commands as well as R packages.
Added on 2023-01-05
ShareRelated Documents

End of preview
Want to access all the pages? Upload your documents or become a member.
Using Aggregation Functions for Data Analysis
|21
|4592
|22
Real World Analytics Using R
|12
|1483
|53
Home Energy Management System
|9
|1403
|18
Real World Analytics
|17
|2263
|3
Real World Analytics
|18
|2791
|103
Analysis of Forest Fires Dataset using Linear Regression
|7
|2070
|115