Social Cost of Sugar Sweetened Beverages Report 2022
VerifiedAdded on 2022/08/28
|6
|2082
|12
AI Summary
Contribute Materials
Your contribution can guide someone’s learning journey. Share your
documents today.
Running head: Social Cost of Sugar Sweetened Beverages
Social Cost of Sugar Sweetened Beverages
Name of the Student
Name of the University
Student ID
Social Cost of Sugar Sweetened Beverages
Name of the Student
Name of the University
Student ID
Secure Best Marks with AI Grader
Need help grading? Try our AI Grader for instant feedback on your assignments.
1Social Cost of Sugar Sweetened Beverages
Introduction
With rise in consumption, the problem of obesity has been growing. Obesity is a
health problem that increases the possibility of other potentially harmful diseases such as
cardiac disease, cancer and many more. This research essay studies the problem of
obesity in Australia and thereby analyses how consumption of sugar sweetened
beverages are increasing the problem of obesity in the country significantly.
Discussion
The problem of obesity is growing all around the world and Australia is not lagging
behind. It has been observed that obesity has struck the population of the country widely
in the last 20 years. Data show that from 2007-08 to the current period the number of
people in Australia suffering from obesity has increased by twice. In 2007-08, the number
of adult obese people in Australia was 2.7 million and currently it has increased to 5.8
million. In last 3 to 4 years around 0.9 million people joined the obese club in the country.
As per National Health Survey data, in 1990 the percentage of obese people was 8%,
which has increased to 31.3 % in 2018 (Static1.squarespace.com., 2020). Considering the
trend the problem is going to reach a critical stage in near future. Along with adults, the
country has experienced a striking rise in child obesity as well. In the last 5 years, the child
obesity has increased by 60% in the country which is a serious problem, and must be
solved immediately. It has been observed that the frequency of sugary drink consumption
is more among the youth and children in comparison to aged persons. Even if obesity is
not a diseases itself but it makes the body prone to several kind of harmful and fatal
diseases and one of the major causes of obesity is over consumption of sugar sweetened
beverages (SSB). In Australia, around 48% people consume SSB and among them
around 10% consume daily (Abs.gov.au 2018). It is more harmful for children than for the
adults. It is found that children who consume high amount of SSB are prone to diseases
like dental erosion, resistant to insulin, cardiovascular diseases, weak bones and cancer.
There are thirteen types of cancer chances of which increases due to consumption of SSB
according to study done by WHO (Who.int., 2020). Australians are among top consumers
of SSBs and thus the out of total amount sugar consumed the people of the country
around 52% comes from consumption of SSB. Large portions of people are getting
diseases due to this obese factor and thus its cost to society is significantly high. In 2011-
2012, obesity costs Australia $8.6 billion and as per estimations, it would go up as high as
$11.8 billion by 2018 including both direct and indirect cost (Miller et al., 2019). Therefore,
social cost SSB should be significantly high as more than 50% of sugar comes from
consumption of SSB.
Australia is among the largest consumers of SSBs and as per the current trend, the
consumption will rise further in future. Attractive and influencing advertisements and
promotional activities are playing the role of consumption booster. Consumption of any
good depends on the utility gathered from it, its availability and income of the consumers.
Therefore, without any restriction consumers would consume until their utility is fulfilled. It
is the main reason for high SSB consumption in Australia (Shim et al., 2019). Without any
restriction, the people consume SSBs as they like and in most cases, they end up over
consuming. Consequently, the people become obese and fell prey to harmful diseases.
This adds up to the unwanted cost of Australia that pushes the country economically and
health wise backward. In figure 1, the graphical illustration of the problem has been
2Social Cost of Sugar Sweetened Beverages
PMC=S1
SMC=S2
Q1 Q
P
P
1
SSB
Consumption
Price of SSB
D
Deadweight Loss
Tax
P
1
PMC=S1
SMC=S2
P
P*
Price of SSB
D
Deadweight Loss
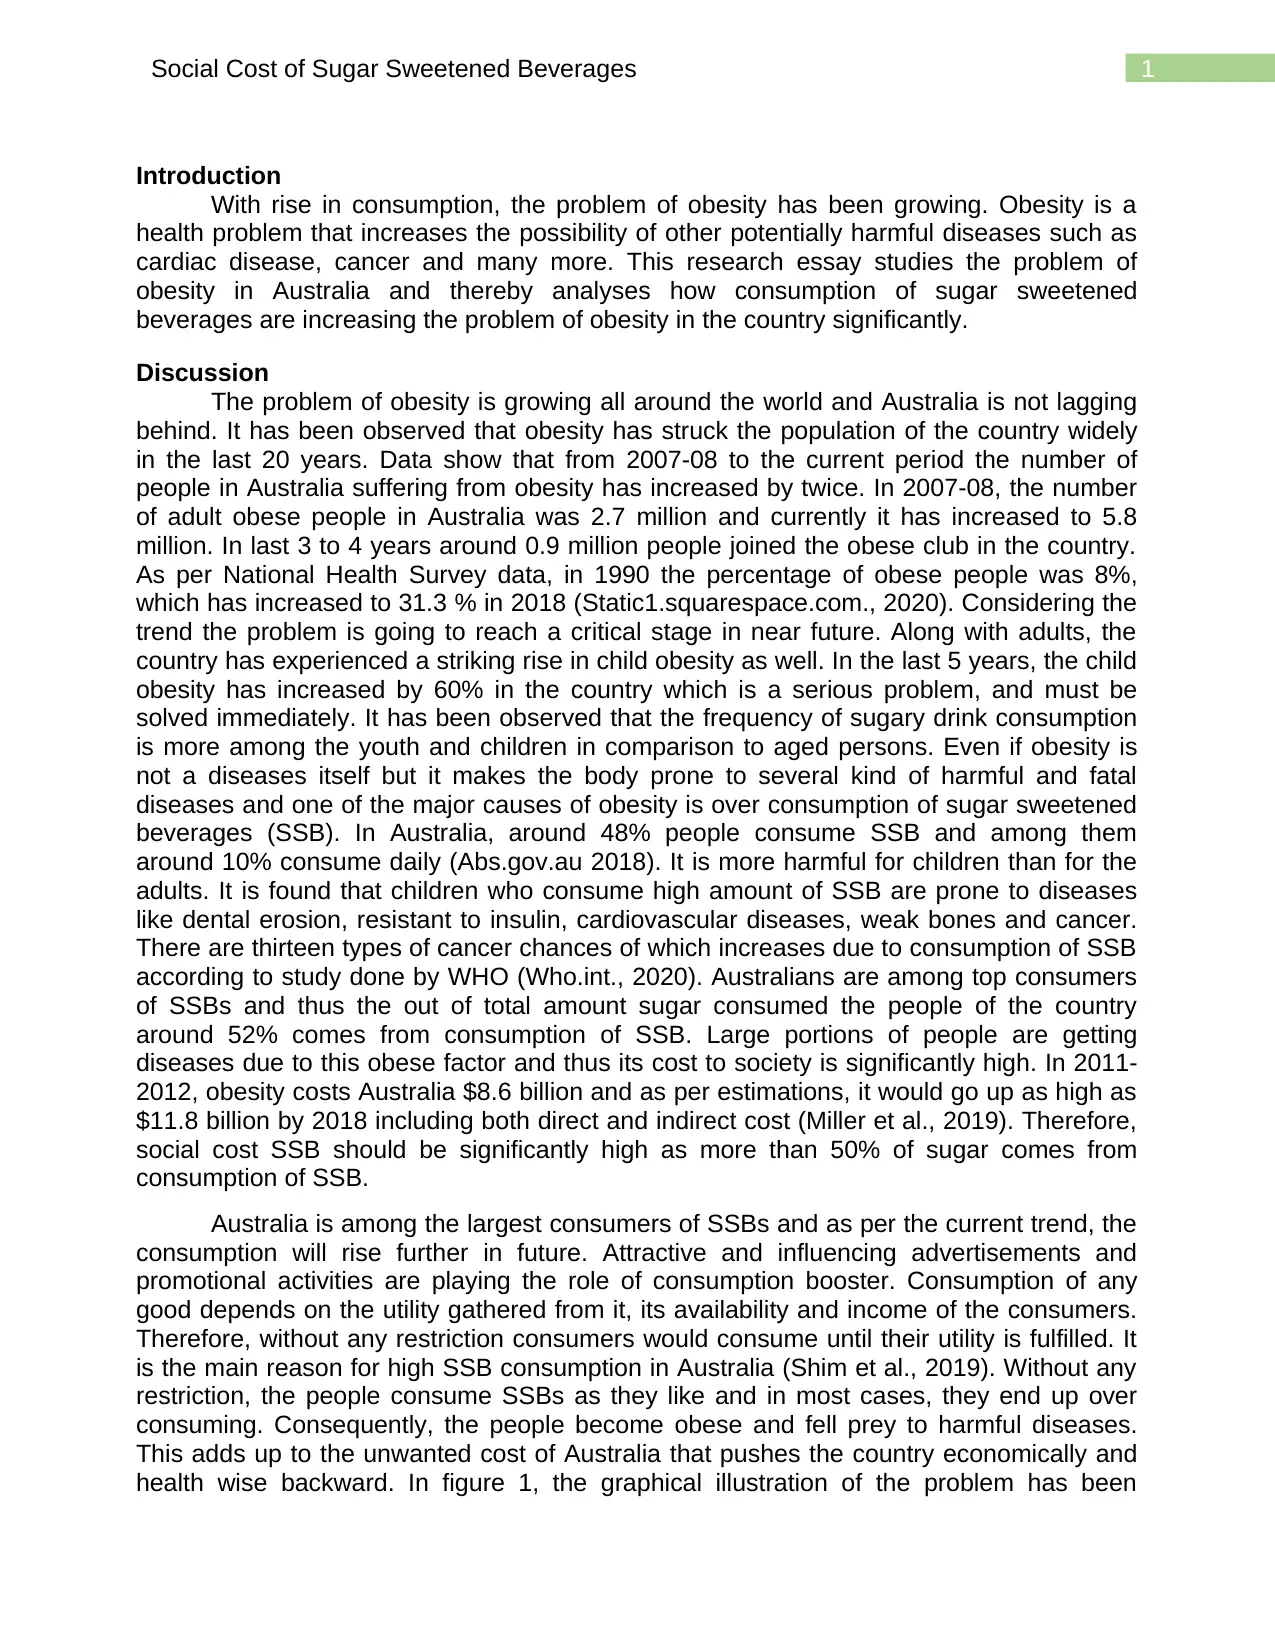
shown. Under free market operation, the amount of SSB consumed by people is given by
Q and equilibrium price at this level of quantity is P. This equilibrium is shown by the
crossing point between demand curve and producers’ marginal cost (PMC) curve. In the
figure, the social marginal cost (SMC) curve is shown as SMC or S2 (Jacobs, 2018).
Market equilibrium given by crossing point between demand curve (D) and SMC is the
desired level of SSB consumption where there is no social cost to the country. Therefore,
equilibrium price and quantity is at this point is P1 and Q1 respectively. The deadweight
loss shown as yellow triangle in the figure is the social cost to the country occurring due to
diseases happening to the people suffering from obesity owing to over consumption of
SSB (Pincus, 2018). Therefore, to internalize this negative externality the country need
effective policies that will move the equilibrium of the SSB market to the socially efficient
equilibrium given by intersection point between SMC and D.
Figure 1: SSB consumption and social cost
Source: (Created by the Author)
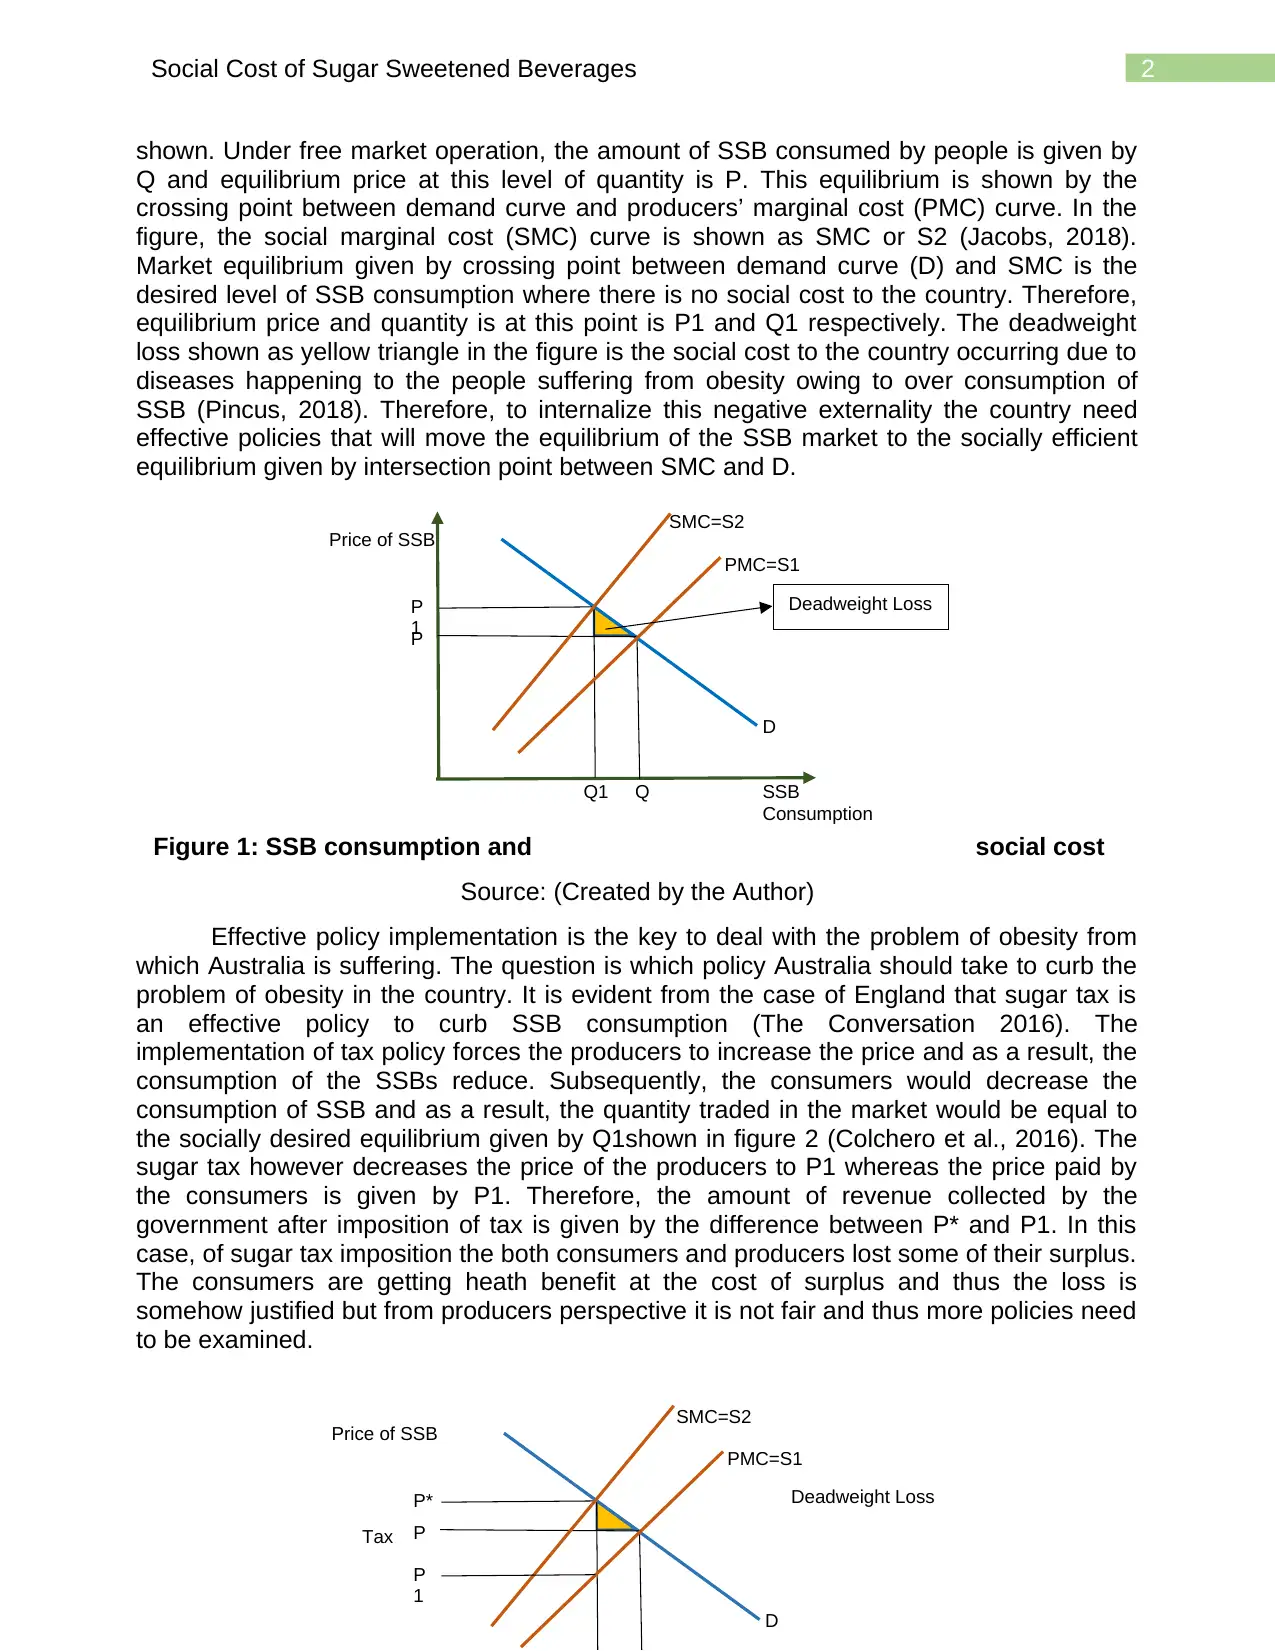
Effective policy implementation is the key to deal with the problem of obesity from
which Australia is suffering. The question is which policy Australia should take to curb the
problem of obesity in the country. It is evident from the case of England that sugar tax is
an effective policy to curb SSB consumption (The Conversation 2016). The
implementation of tax policy forces the producers to increase the price and as a result, the
consumption of the SSBs reduce. Subsequently, the consumers would decrease the
consumption of SSB and as a result, the quantity traded in the market would be equal to
the socially desired equilibrium given by Q1shown in figure 2 (Colchero et al., 2016). The
sugar tax however decreases the price of the producers to P1 whereas the price paid by
the consumers is given by P1. Therefore, the amount of revenue collected by the
government after imposition of tax is given by the difference between P* and P1. In this
case, of sugar tax imposition the both consumers and producers lost some of their surplus.
The consumers are getting heath benefit at the cost of surplus and thus the loss is
somehow justified but from producers perspective it is not fair and thus more policies need
to be examined.
PMC=S1
SMC=S2
Q1 Q
P
P
1
SSB
Consumption
Price of SSB
D
Deadweight Loss
Tax
P
1
PMC=S1
SMC=S2
P
P*
Price of SSB
D
Deadweight Loss
shown. Under free market operation, the amount of SSB consumed by people is given by
Q and equilibrium price at this level of quantity is P. This equilibrium is shown by the
crossing point between demand curve and producers’ marginal cost (PMC) curve. In the
figure, the social marginal cost (SMC) curve is shown as SMC or S2 (Jacobs, 2018).
Market equilibrium given by crossing point between demand curve (D) and SMC is the
desired level of SSB consumption where there is no social cost to the country. Therefore,
equilibrium price and quantity is at this point is P1 and Q1 respectively. The deadweight
loss shown as yellow triangle in the figure is the social cost to the country occurring due to
diseases happening to the people suffering from obesity owing to over consumption of
SSB (Pincus, 2018). Therefore, to internalize this negative externality the country need
effective policies that will move the equilibrium of the SSB market to the socially efficient
equilibrium given by intersection point between SMC and D.
Figure 1: SSB consumption and social cost
Source: (Created by the Author)
Effective policy implementation is the key to deal with the problem of obesity from
which Australia is suffering. The question is which policy Australia should take to curb the
problem of obesity in the country. It is evident from the case of England that sugar tax is
an effective policy to curb SSB consumption (The Conversation 2016). The
implementation of tax policy forces the producers to increase the price and as a result, the
consumption of the SSBs reduce. Subsequently, the consumers would decrease the
consumption of SSB and as a result, the quantity traded in the market would be equal to
the socially desired equilibrium given by Q1shown in figure 2 (Colchero et al., 2016). The
sugar tax however decreases the price of the producers to P1 whereas the price paid by
the consumers is given by P1. Therefore, the amount of revenue collected by the
government after imposition of tax is given by the difference between P* and P1. In this
case, of sugar tax imposition the both consumers and producers lost some of their surplus.
The consumers are getting heath benefit at the cost of surplus and thus the loss is
somehow justified but from producers perspective it is not fair and thus more policies need
to be examined.
3Social Cost of Sugar Sweetened Beverages
Q1 Q SSB
Consumption
PMC=S1
SMC=PMC=S
2
Q1 Q
P
P*
SSB
Consumption
Price of SSB
D
Deadweight Loss
Figure 2: Effect of sugar tax policy
Source: (Created by the Author)
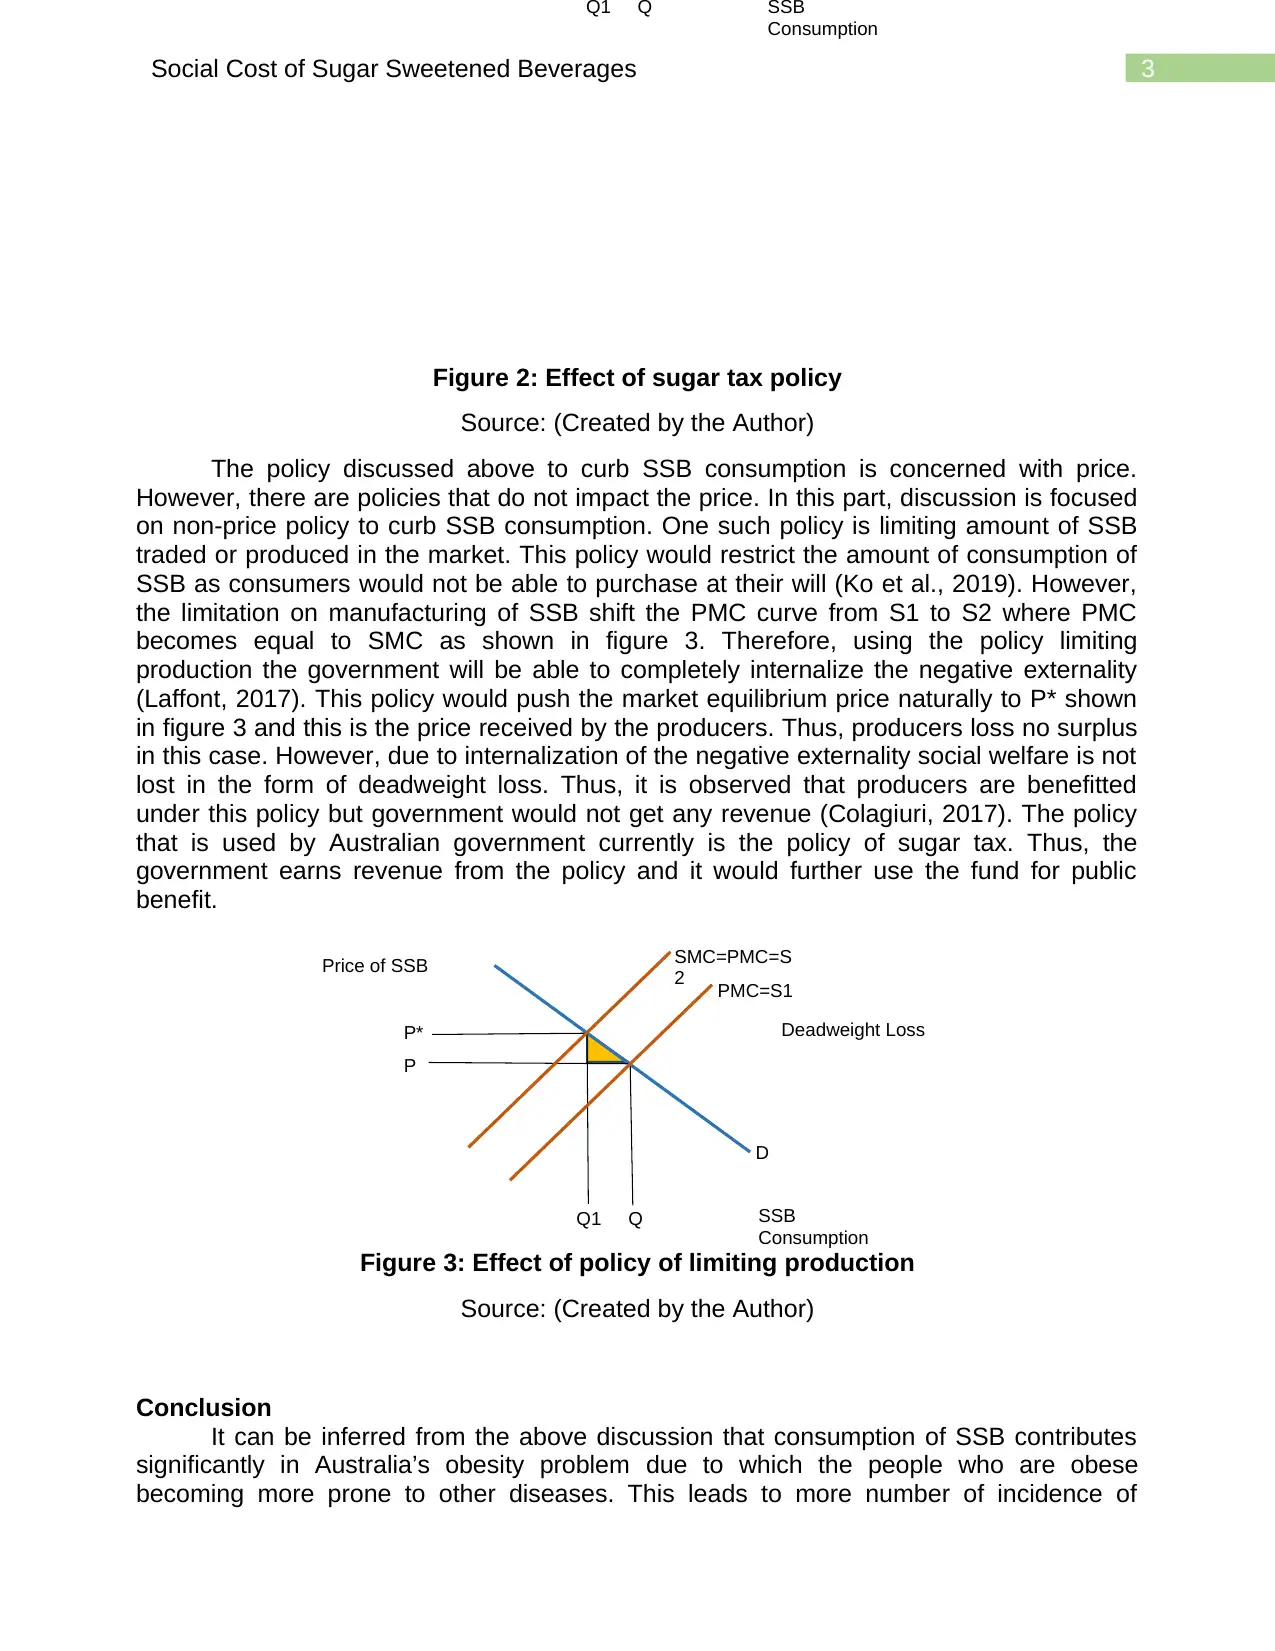
The policy discussed above to curb SSB consumption is concerned with price.
However, there are policies that do not impact the price. In this part, discussion is focused
on non-price policy to curb SSB consumption. One such policy is limiting amount of SSB
traded or produced in the market. This policy would restrict the amount of consumption of
SSB as consumers would not be able to purchase at their will (Ko et al., 2019). However,
the limitation on manufacturing of SSB shift the PMC curve from S1 to S2 where PMC
becomes equal to SMC as shown in figure 3. Therefore, using the policy limiting
production the government will be able to completely internalize the negative externality
(Laffont, 2017). This policy would push the market equilibrium price naturally to P* shown
in figure 3 and this is the price received by the producers. Thus, producers loss no surplus
in this case. However, due to internalization of the negative externality social welfare is not
lost in the form of deadweight loss. Thus, it is observed that producers are benefitted
under this policy but government would not get any revenue (Colagiuri, 2017). The policy
that is used by Australian government currently is the policy of sugar tax. Thus, the
government earns revenue from the policy and it would further use the fund for public
benefit.
Figure 3: Effect of policy of limiting production
Source: (Created by the Author)
Conclusion
It can be inferred from the above discussion that consumption of SSB contributes
significantly in Australia’s obesity problem due to which the people who are obese
becoming more prone to other diseases. This leads to more number of incidence of
Q1 Q SSB
Consumption
PMC=S1
SMC=PMC=S
2
Q1 Q
P
P*
SSB
Consumption
Price of SSB
D
Deadweight Loss
Figure 2: Effect of sugar tax policy
Source: (Created by the Author)
The policy discussed above to curb SSB consumption is concerned with price.
However, there are policies that do not impact the price. In this part, discussion is focused
on non-price policy to curb SSB consumption. One such policy is limiting amount of SSB
traded or produced in the market. This policy would restrict the amount of consumption of
SSB as consumers would not be able to purchase at their will (Ko et al., 2019). However,
the limitation on manufacturing of SSB shift the PMC curve from S1 to S2 where PMC
becomes equal to SMC as shown in figure 3. Therefore, using the policy limiting
production the government will be able to completely internalize the negative externality
(Laffont, 2017). This policy would push the market equilibrium price naturally to P* shown
in figure 3 and this is the price received by the producers. Thus, producers loss no surplus
in this case. However, due to internalization of the negative externality social welfare is not
lost in the form of deadweight loss. Thus, it is observed that producers are benefitted
under this policy but government would not get any revenue (Colagiuri, 2017). The policy
that is used by Australian government currently is the policy of sugar tax. Thus, the
government earns revenue from the policy and it would further use the fund for public
benefit.
Figure 3: Effect of policy of limiting production
Source: (Created by the Author)
Conclusion
It can be inferred from the above discussion that consumption of SSB contributes
significantly in Australia’s obesity problem due to which the people who are obese
becoming more prone to other diseases. This leads to more number of incidence of
Secure Best Marks with AI Grader
Need help grading? Try our AI Grader for instant feedback on your assignments.
4Social Cost of Sugar Sweetened Beverages
cancer, cardiac diseases. The problem is increasing with passage of time and children are
falling prey to this problem. Thus, effective policies like sugar tax or limitation on
production of SSB should be implemented to lessen the existing problem.
cancer, cardiac diseases. The problem is increasing with passage of time and children are
falling prey to this problem. Thus, effective policies like sugar tax or limitation on
production of SSB should be implemented to lessen the existing problem.
5Social Cost of Sugar Sweetened Beverages
Reference
Abs.gov.au. (2018). National Health Survey: First Results, 2017-18. (2020). Retrieved from
https://www.abs.gov.au/ausstats/abs@.nsf/Lookup/by%20Subject/4364.0.55.001~2017-
18~Main%20Features~Sugar%20sweetened%20and%20diet%20drink
%20consumption~110
Colagiuri, S. (2017). The obesity epidemic and sugar-sweetened beverages: a taxing time. The
Medical Journal of Australia, 206(3), 109-110.
Colchero, M. A., Popkin, B. M., Rivera, J. A., & Ng, S. W. (2016). Beverage purchases from stores
in Mexico under the excise tax on sugar sweetened beverages: observational
study. bmj, 352, h6704.
Jacobs, B. (2018). The marginal cost of public funds is one at the optimal tax system. International
Tax and Public Finance, 25(4), 883-912.
Ko, C. W., Qu, J., & Tso, P. (2019). Editorial on Sramkova et al.,“Apolipoprotein M: a novel
adipokine decreasing with obesity and upregulated by calorie restriction”.
Laffont, J. J. (2017). Externalities. The New Palgrave Dictionary of Economics, 1-4.
Miller, C., Wakefield, M., Braunack-Mayer, A., Roder, D., O’Dea, K., Ettridge, K., & Dono, J.
(2019). Who drinks sugar sweetened beverages and juice? An Australian population study
of behaviour, awareness and attitudes. BMC Obesity, 6(1). doi:10.1186/s40608-018-0224-2
Pincus, J. (2018). Grattan Institute's case for sugar tax is not proven. Australian Economic
Review, 51(1), 41-51.
Shim, J. S., Kang, N. H., Lee, J. S., Kim, K. N., Chung, H. K., Chung, H. R., ... & Chang, M. J.
(2019). Socioeconomic burden of sugar-sweetened beverages consumption in
Korea. Nutrition research and practice, 13(2), 134-140.
Static1.squarespace.com. (2020). Retrieved 11 January 2020, from
https://static1.squarespace.com/static/57e9ebb16a4963ef7adfafdb/t/
5c9a8961f4e1fc9deceb1ae4/1553631602322/
Obesity+Collective_Australias+Growing+Obesity+Epidemic+report+27+03+19.pdf
The Conversation. (2016). When it comes to sugary drinks, people prefer a nudge to a tax. (2016).
Retrieved from http://theconversation.com/when-it-comes-to-sugary-drinks-people-prefer-a-
nudge-to-a-tax-58617
Who.int. (2020). WHO | Why does childhood overweight and obesity matter?. (2020). Retrieved
from https://www.who.int/dietphysicalactivity/childhood_consequences/en/
1 out of 6
Related Documents


Your All-in-One AI-Powered Toolkit for Academic Success.
+13062052269
info@desklib.com
Available 24*7 on WhatsApp / Email
![[object Object]](/_next/static/media/star-bottom.7253800d.svg)
Unlock your academic potential
© 2024 | Zucol Services PVT LTD | All rights reserved.