Comprehensive Market Research on Soft Drink Preferences at USC
VerifiedAdded on 2023/06/10
|10
|1495
|297
Report
AI Summary
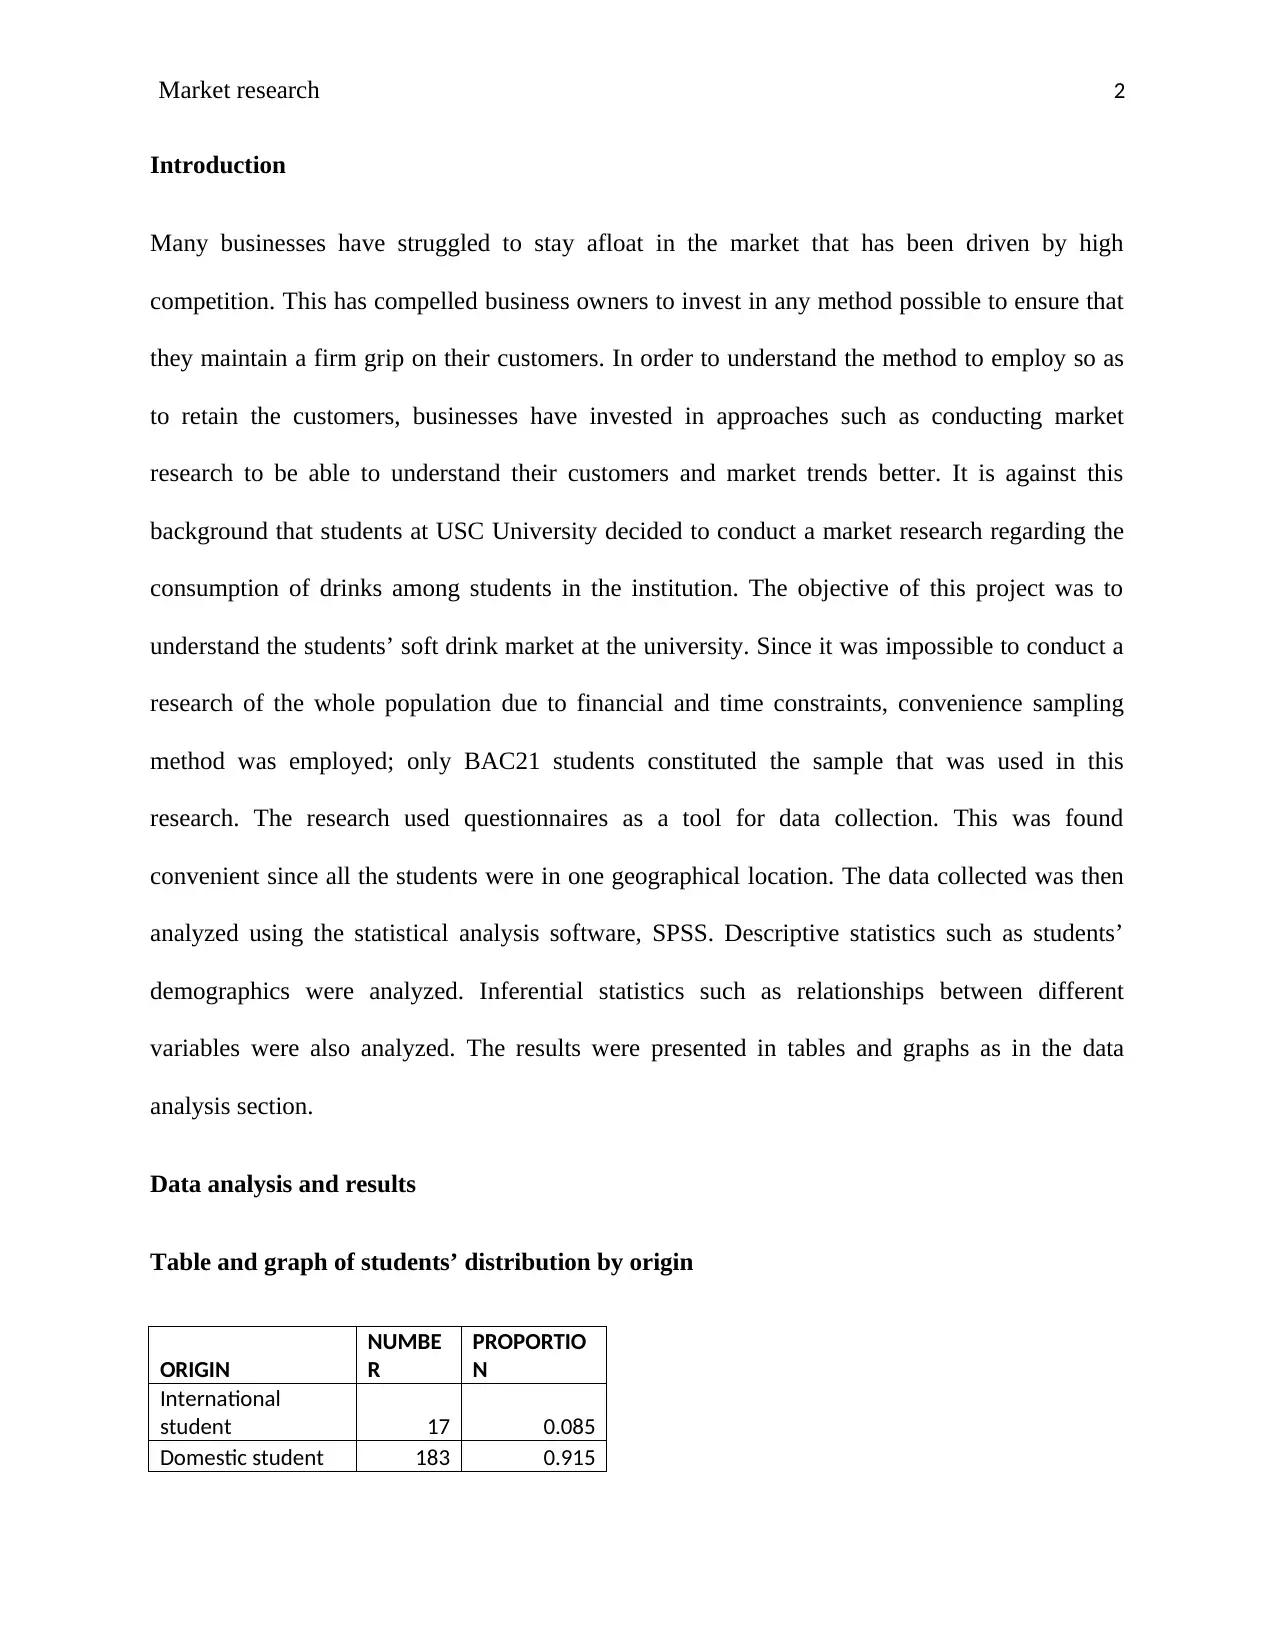
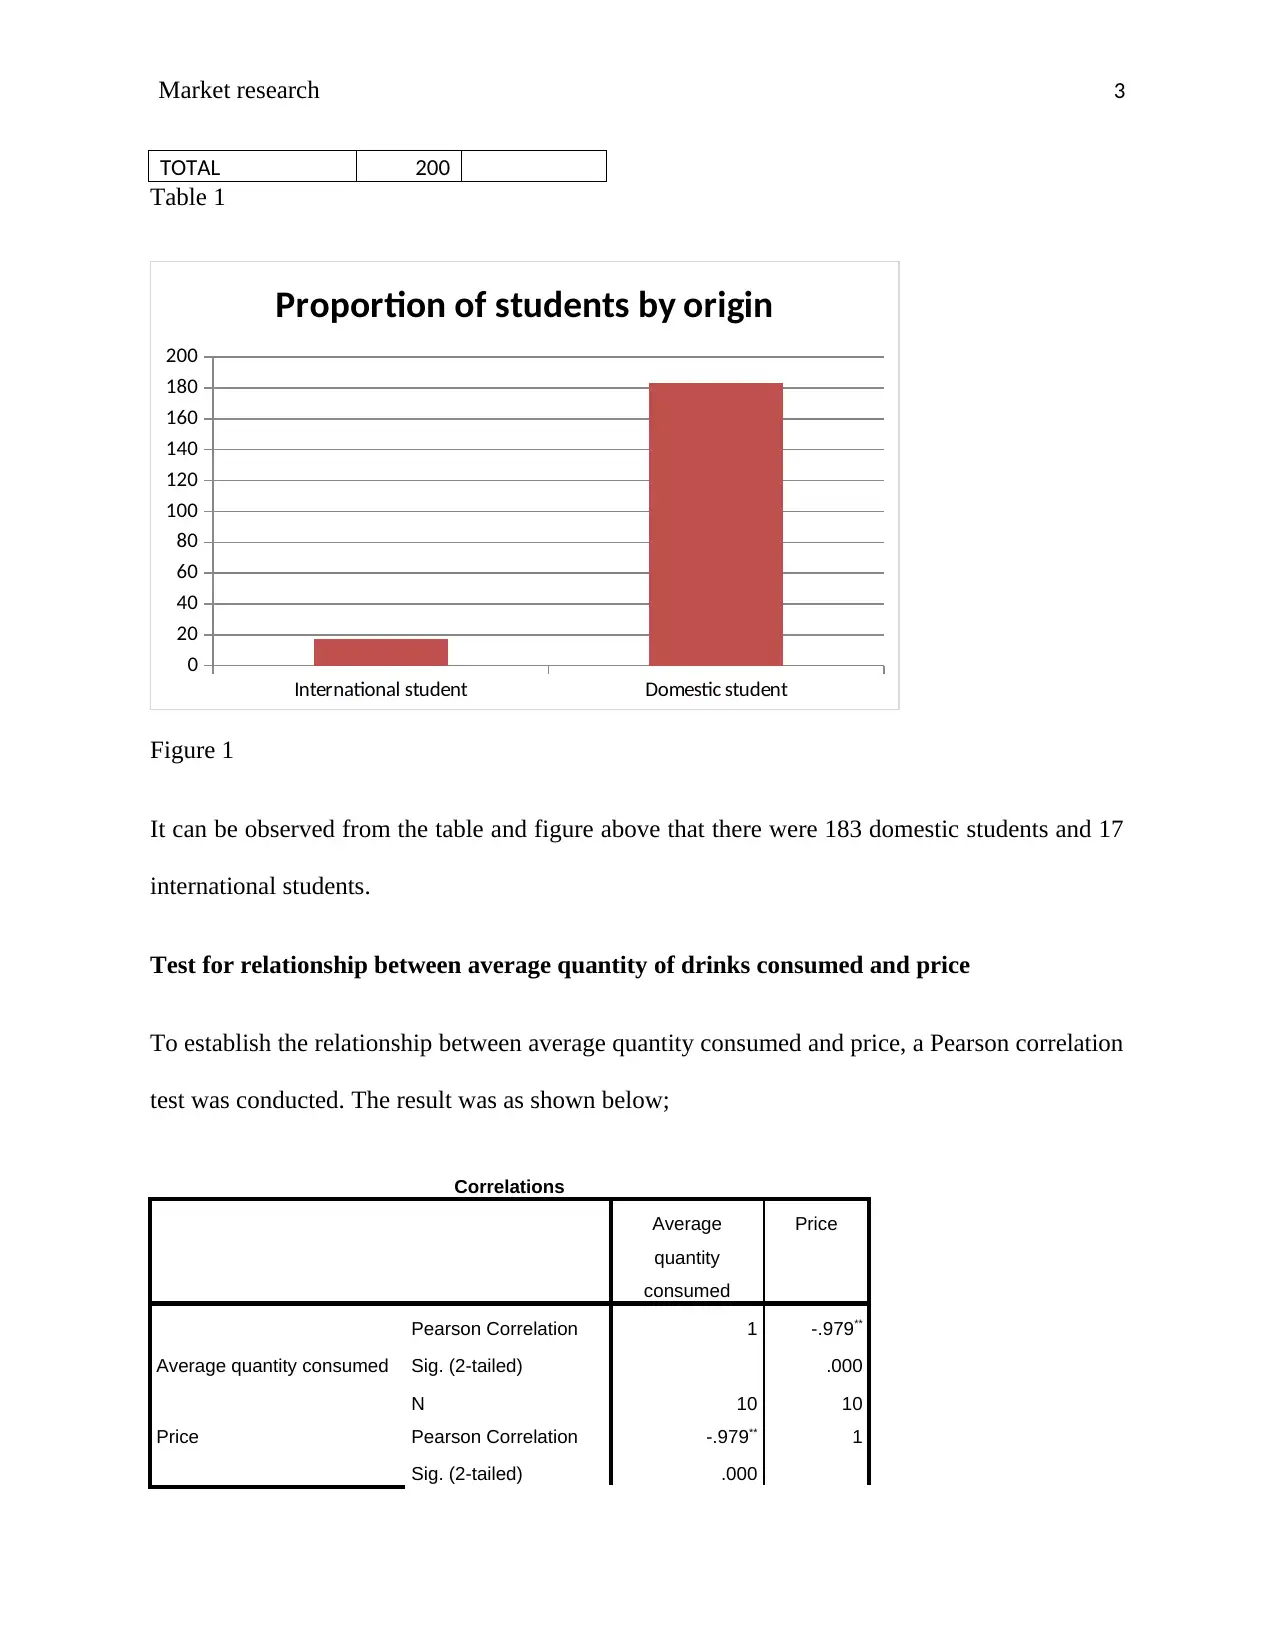
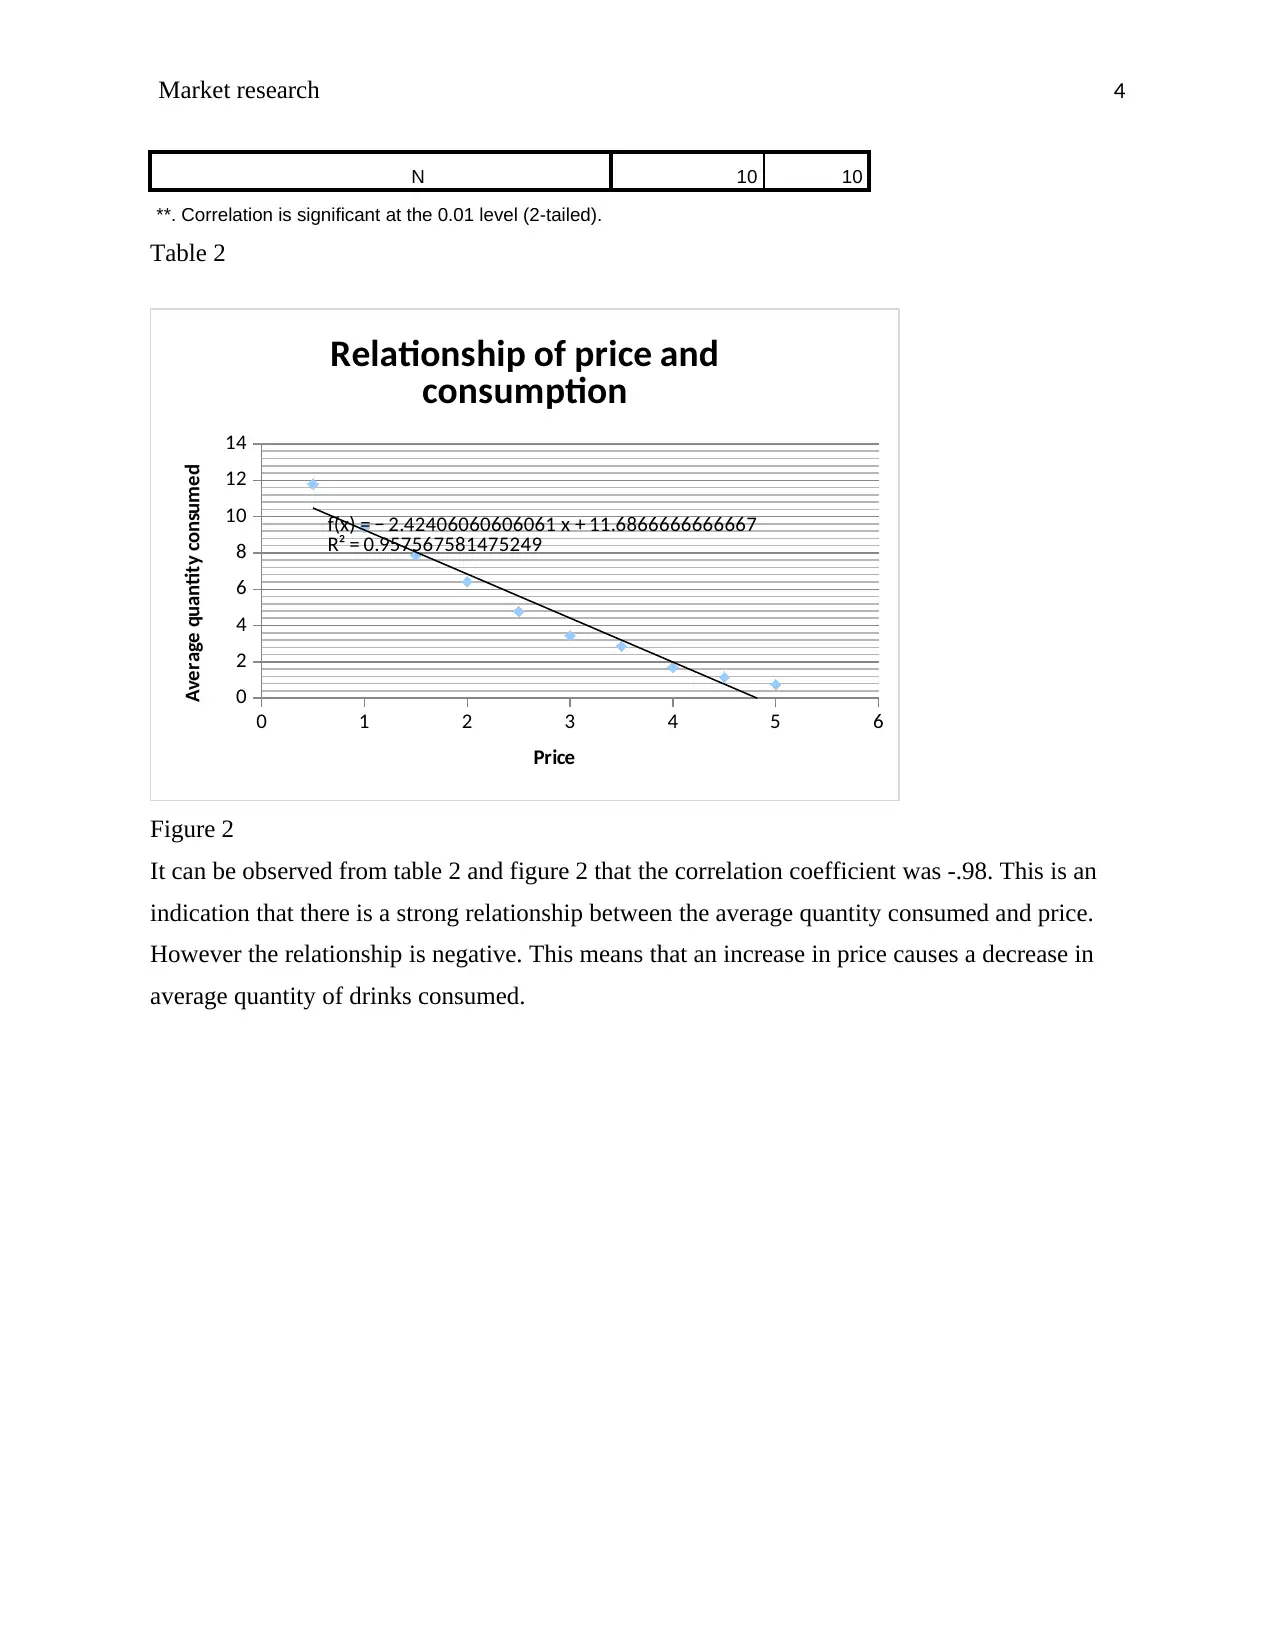
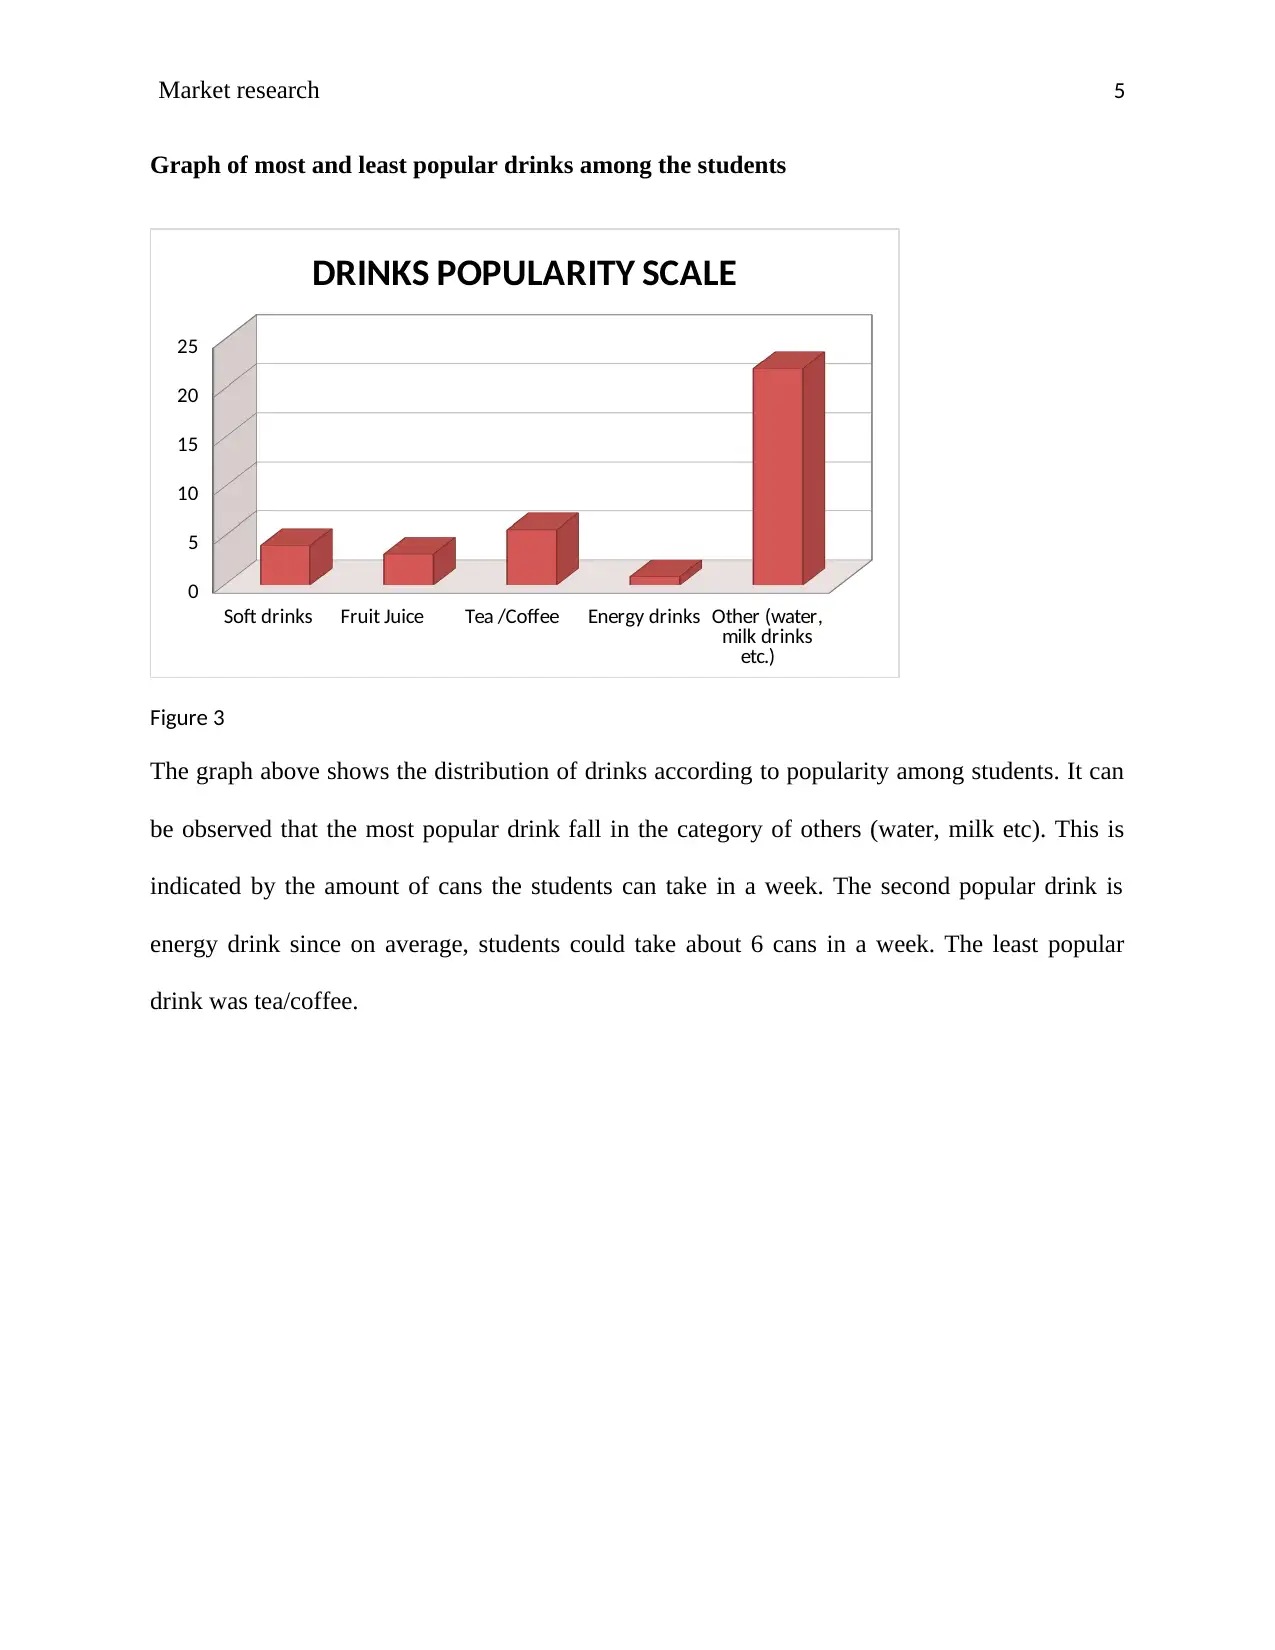
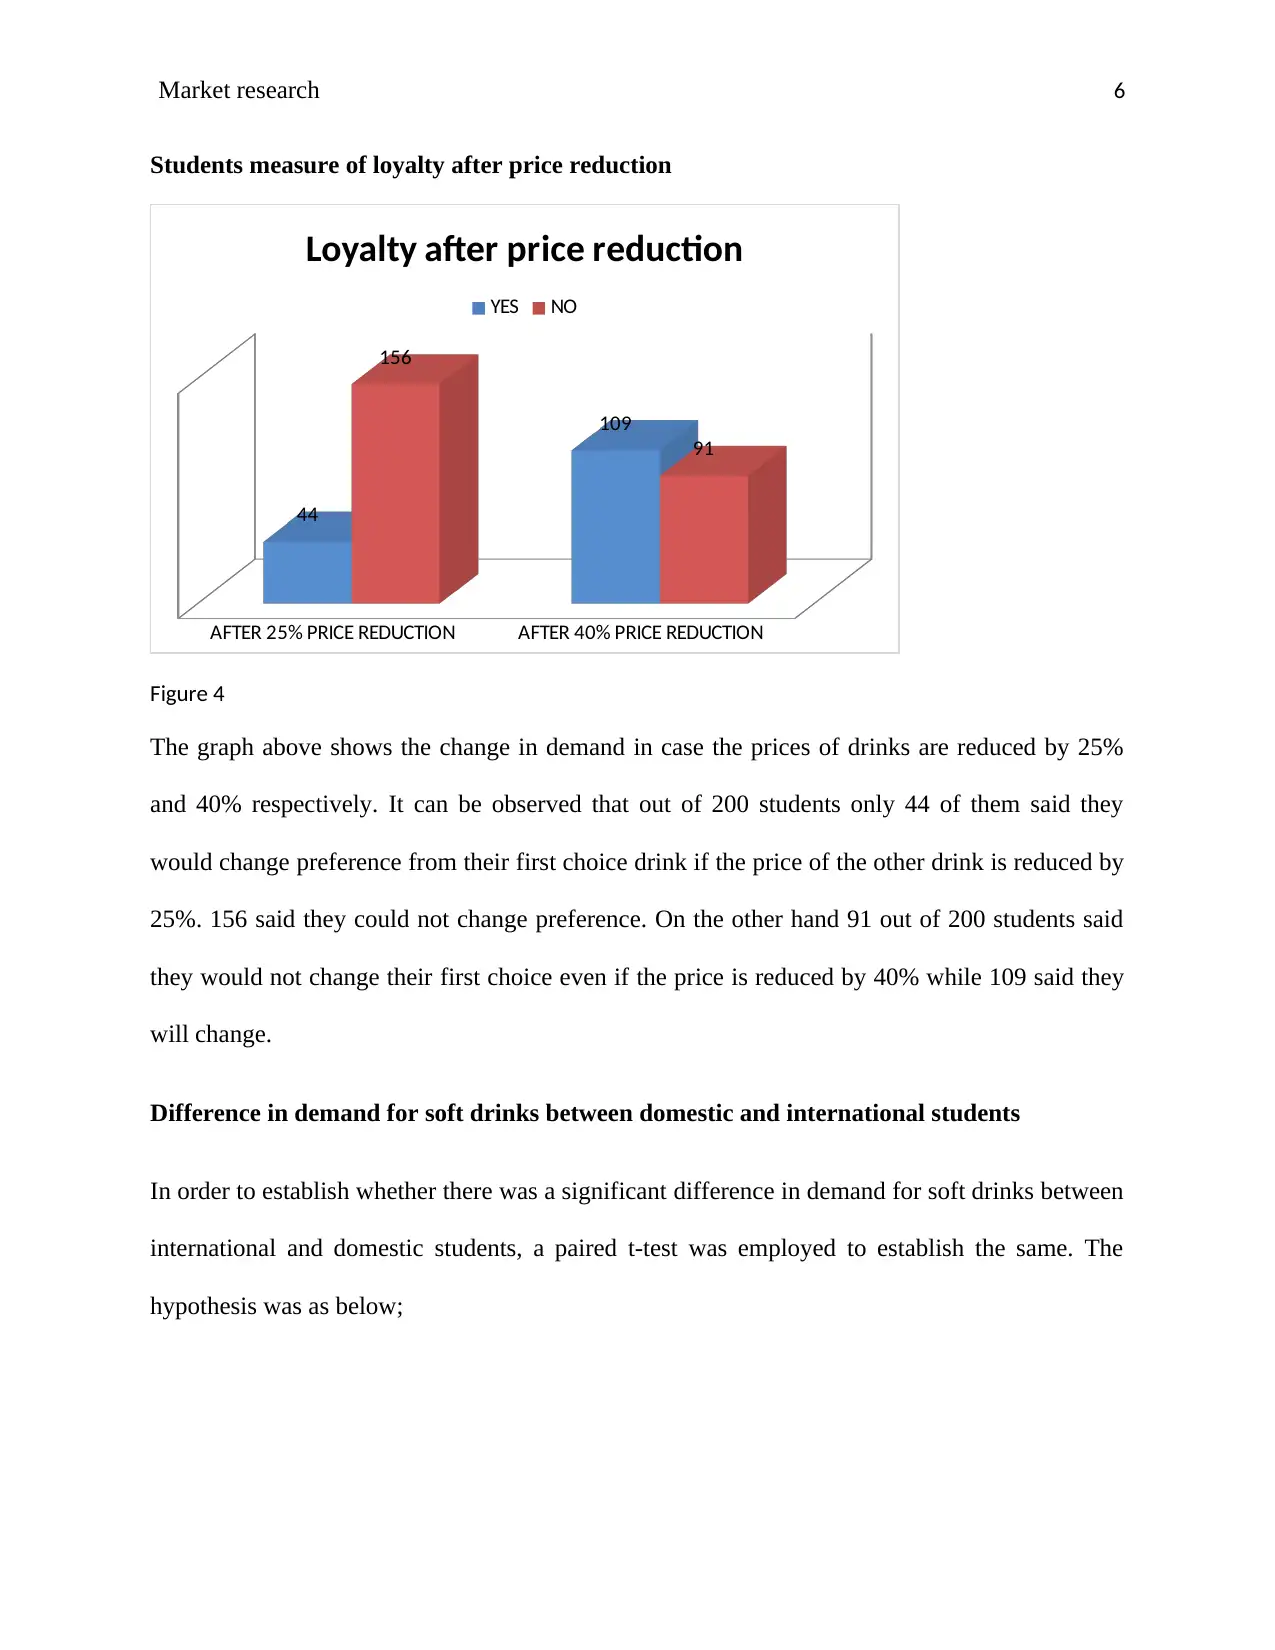
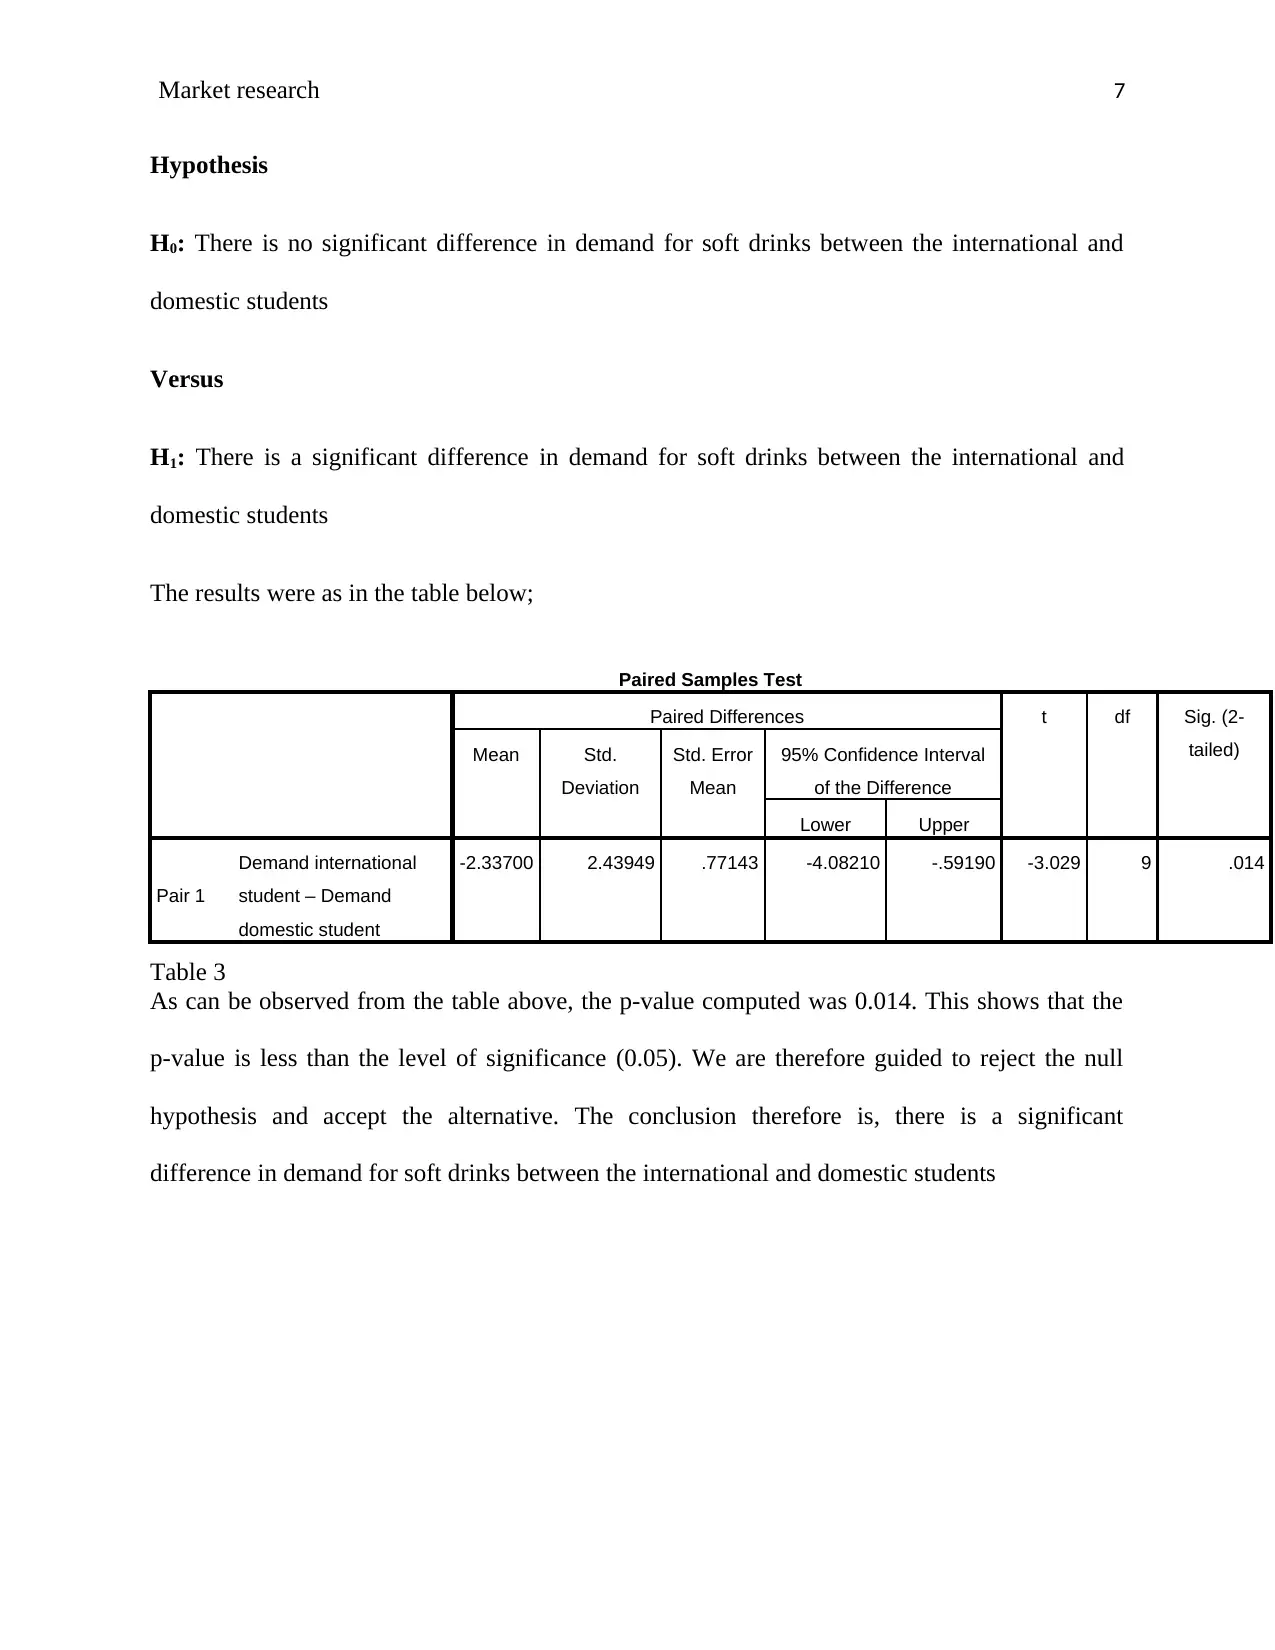
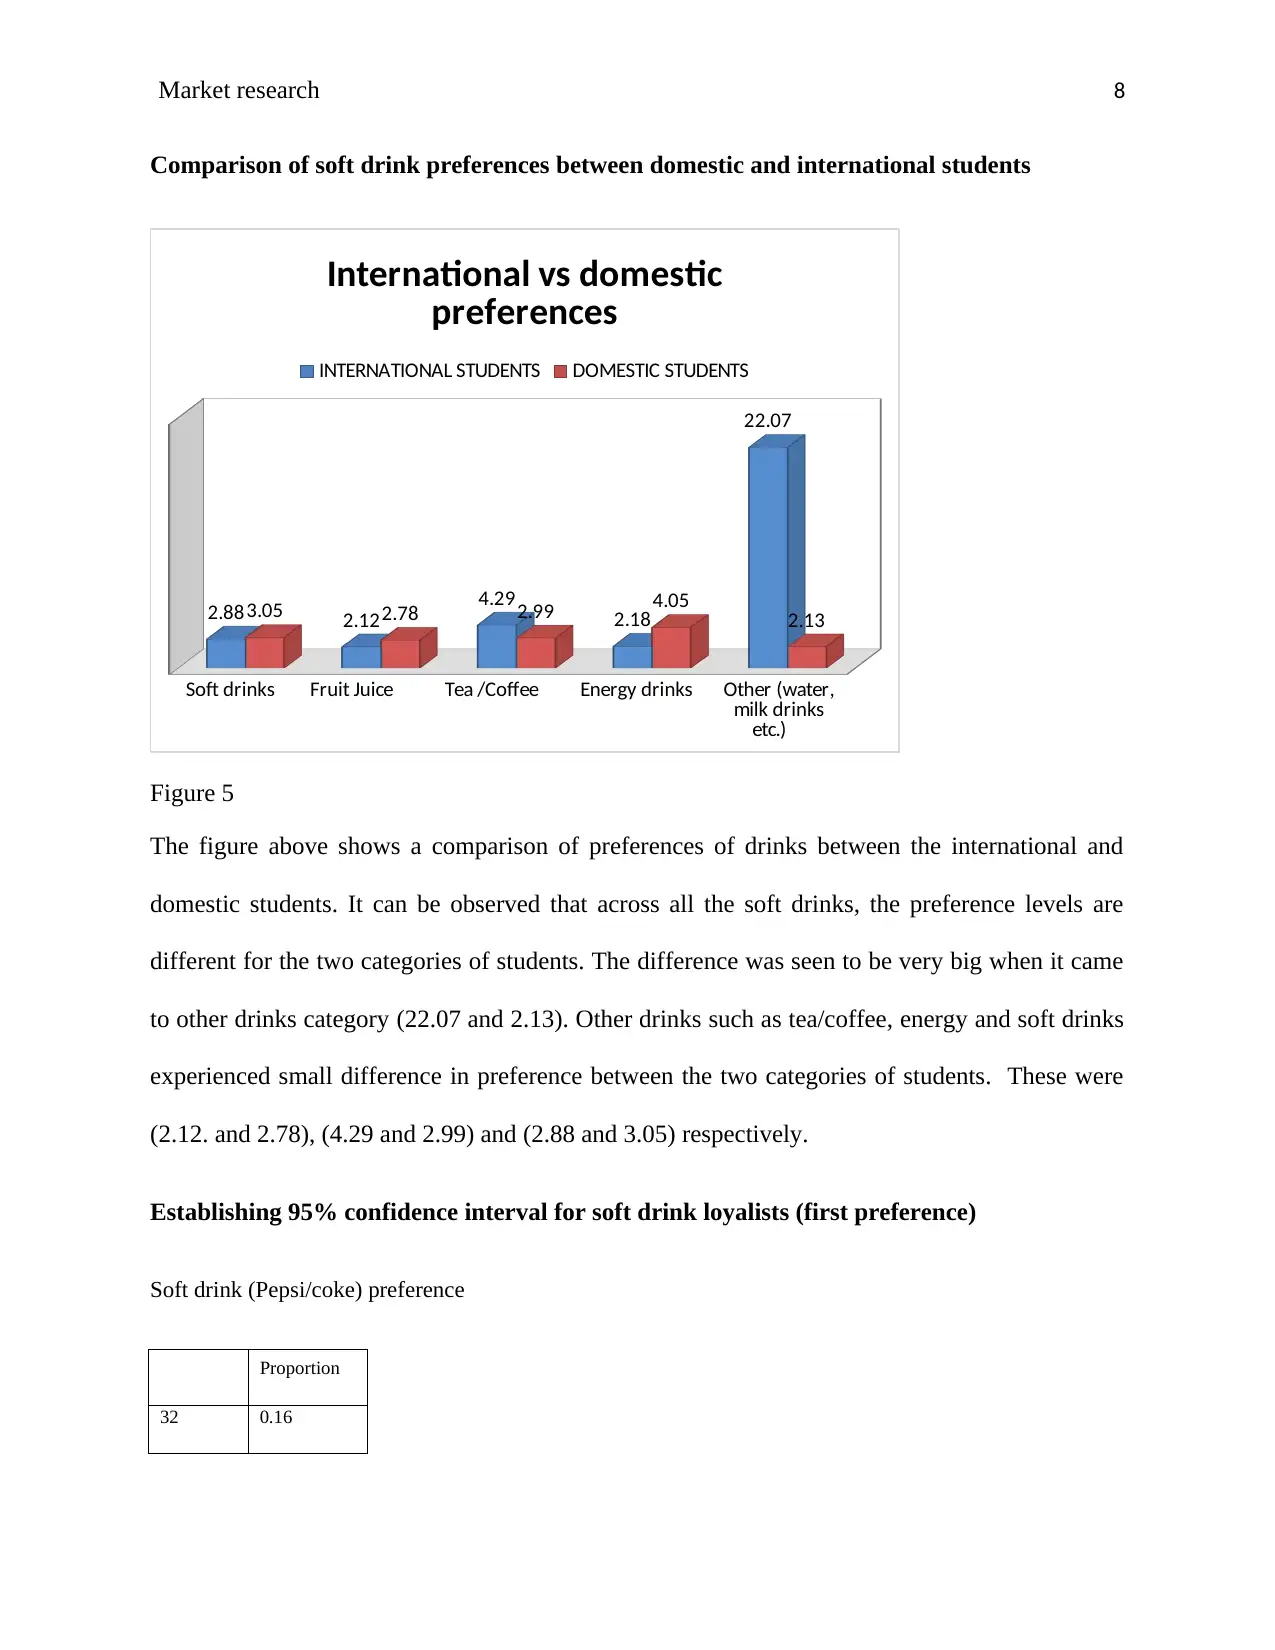
This market research report investigates the soft drink market at USC, focusing on student consumption patterns and preferences. The study, conducted using questionnaires and statistical analysis (SPSS), examines the relationship between price and consumption, revealing a negative correlation where higher prices lead to decreased consumption. The research also identifies the most and least popular drinks among students, with 'other' drinks (water, milk, etc.) being the most preferred. The report analyzes student loyalty in response to price reductions, finding that a significant portion of students are willing to switch brands if prices decrease. Furthermore, the study compares soft drink preferences between domestic and international students, highlighting significant differences in demand. The research concludes with a confidence interval for soft drink loyalists and recommends further investigation into the reasons behind observed differences in demand between international and domestic students. The research highlights price as a key determinant of consumption and brand loyalty.
1 out of 10
Related Documents


Your All-in-One AI-Powered Toolkit for Academic Success.
+13062052269
info@desklib.com
Available 24*7 on WhatsApp / Email
![[object Object]](/_next/static/media/star-bottom.7253800d.svg)
Copyright © 2020–2026 A2Z Services. All Rights Reserved. Developed and managed by ZUCOL.