Aerospace System Manufacturer: Quality Failure Cost Analysis Report

Verified

Added on  2022/08/19

|10
|2253
|18
Report
AI Summary
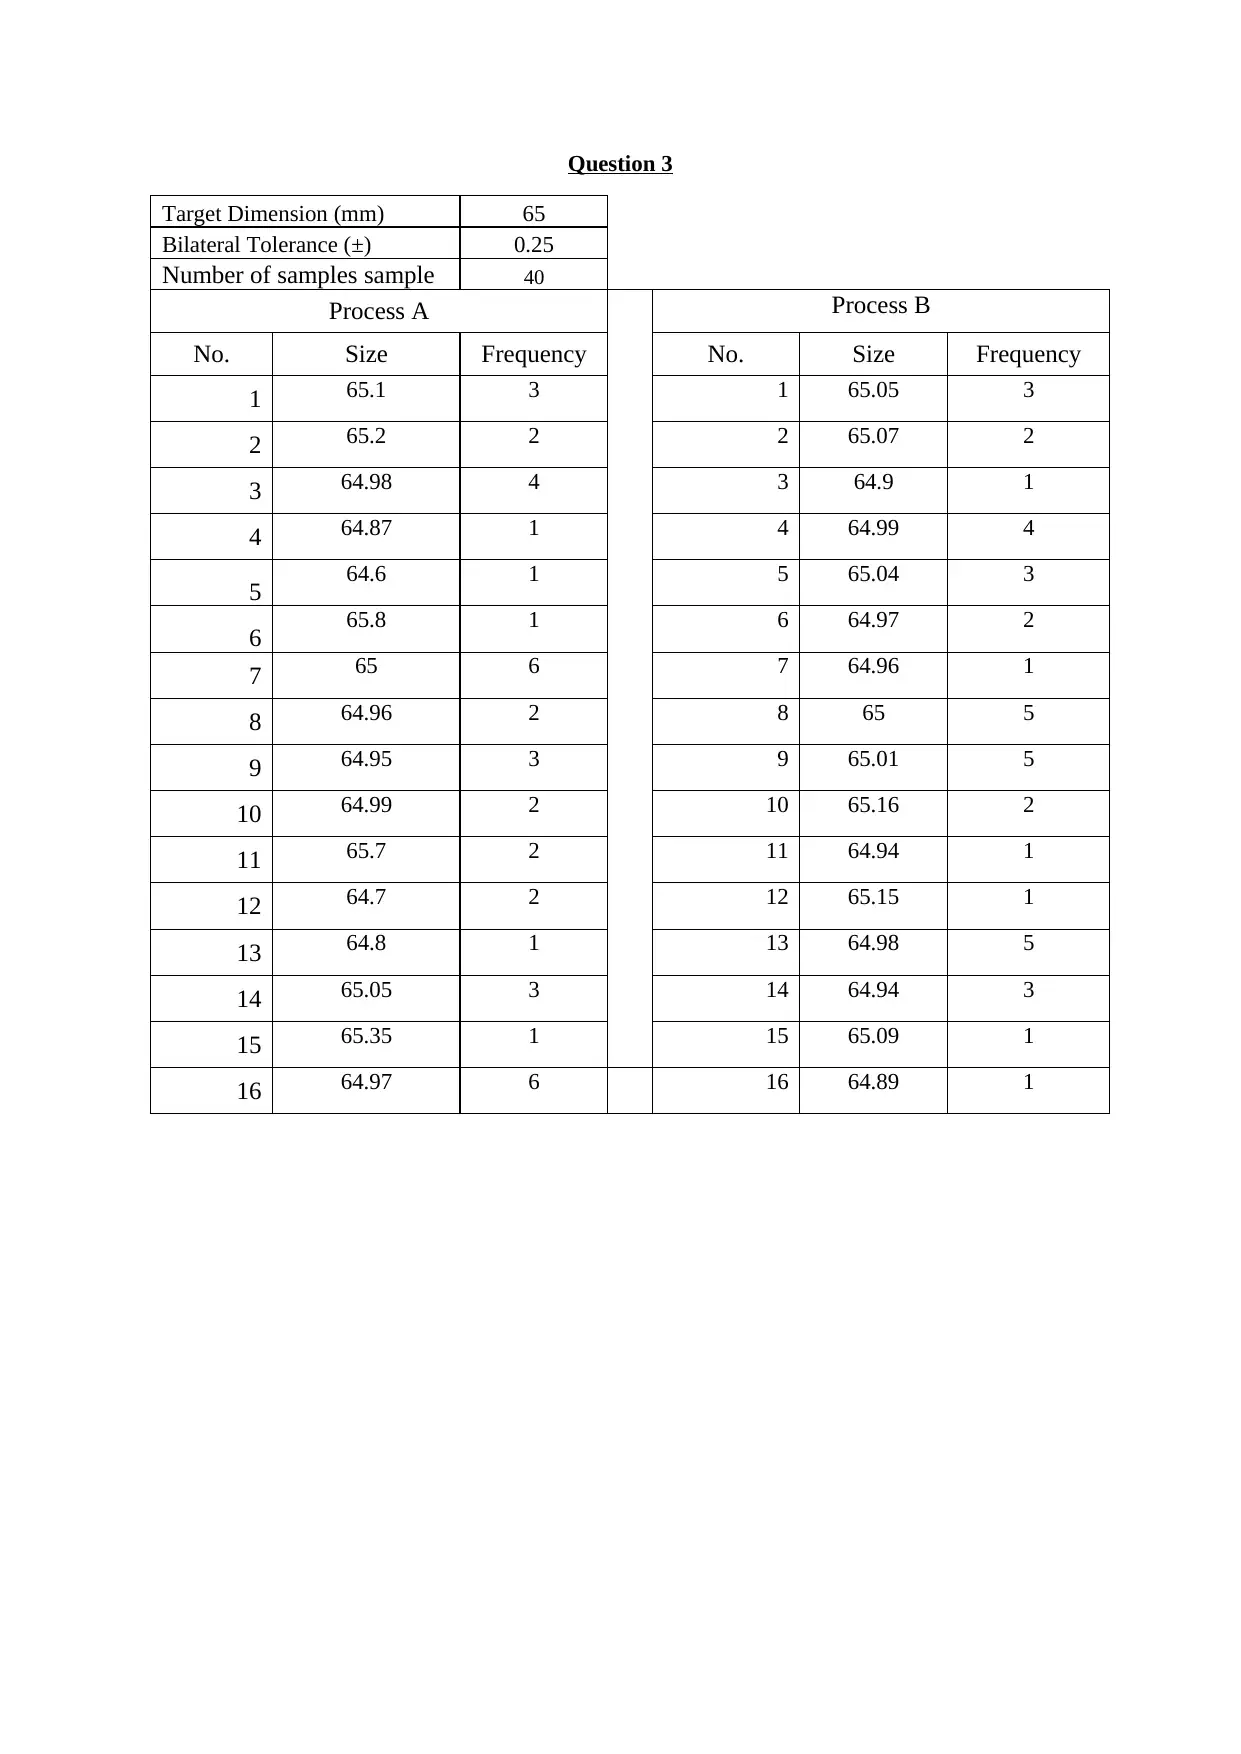
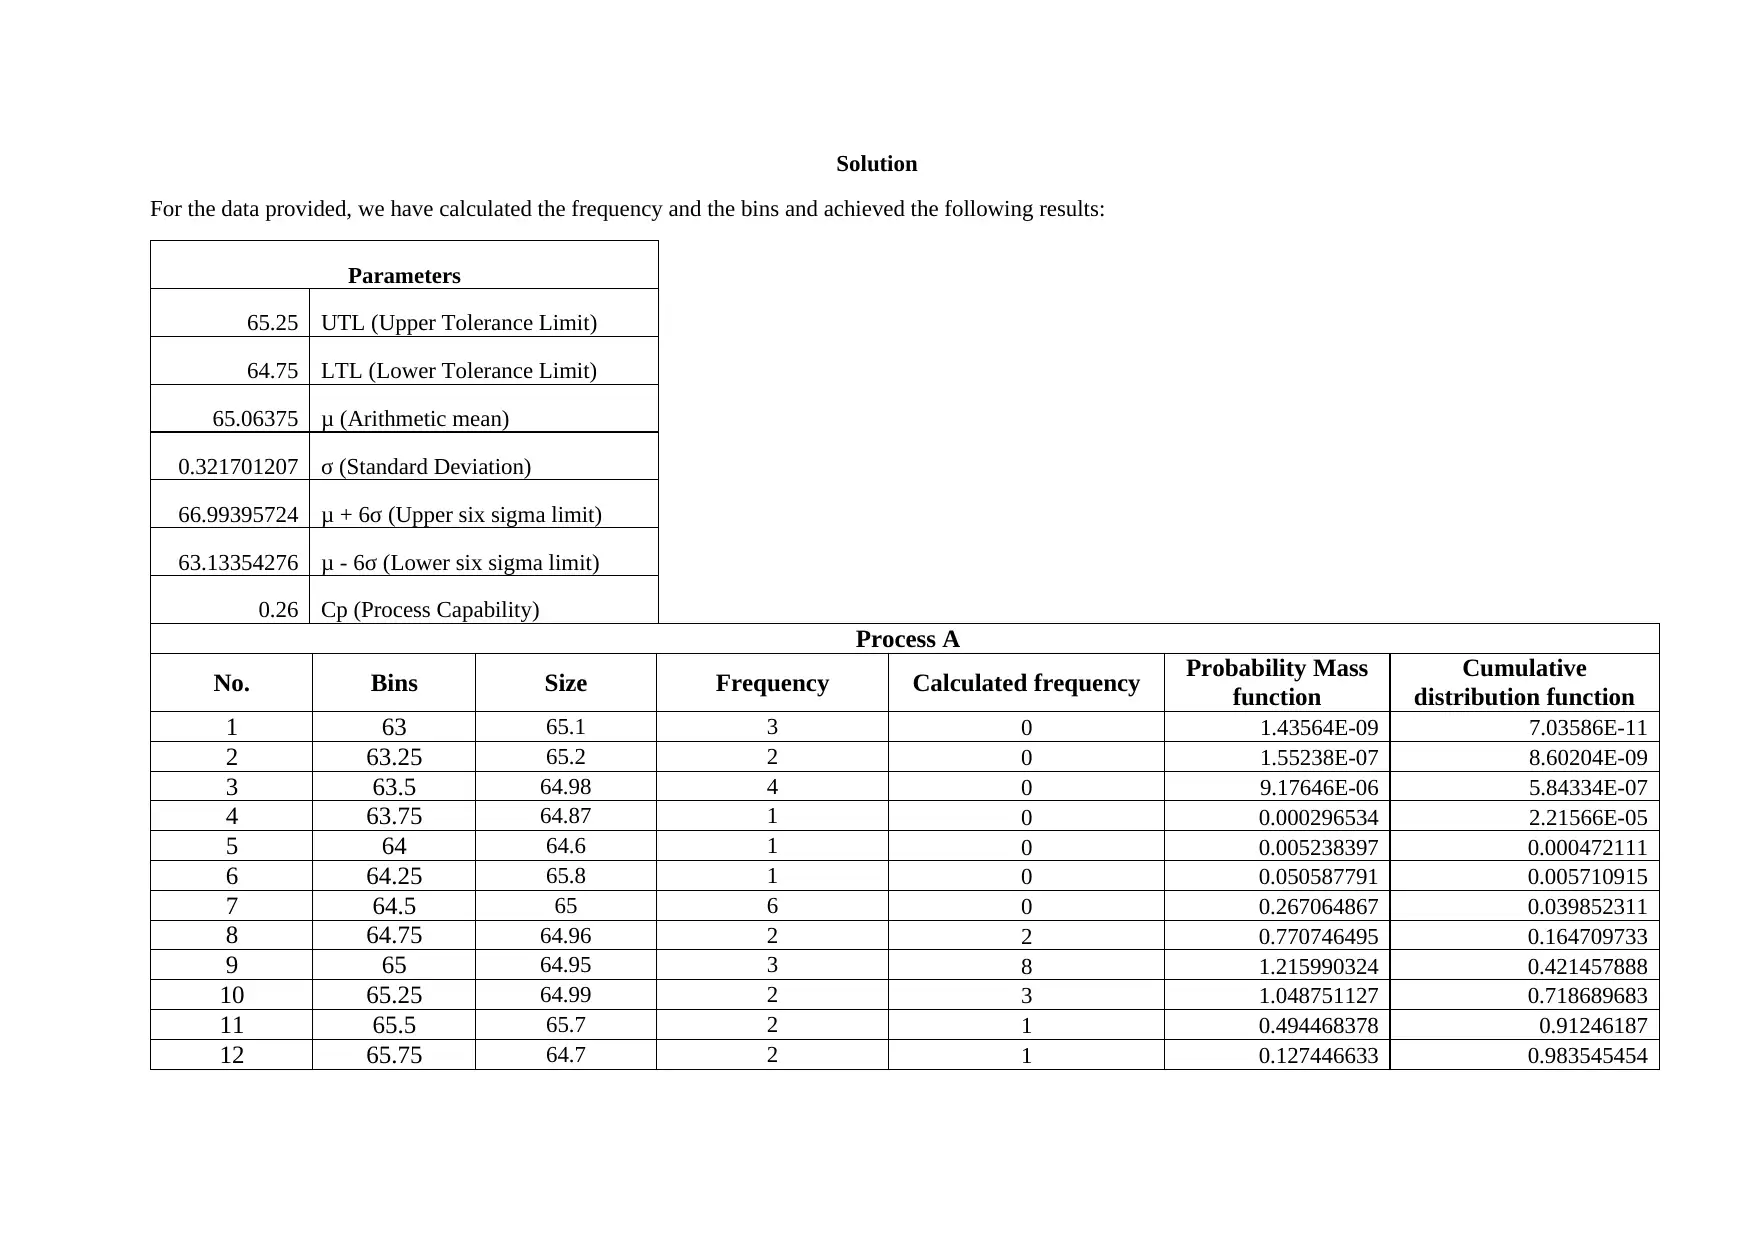
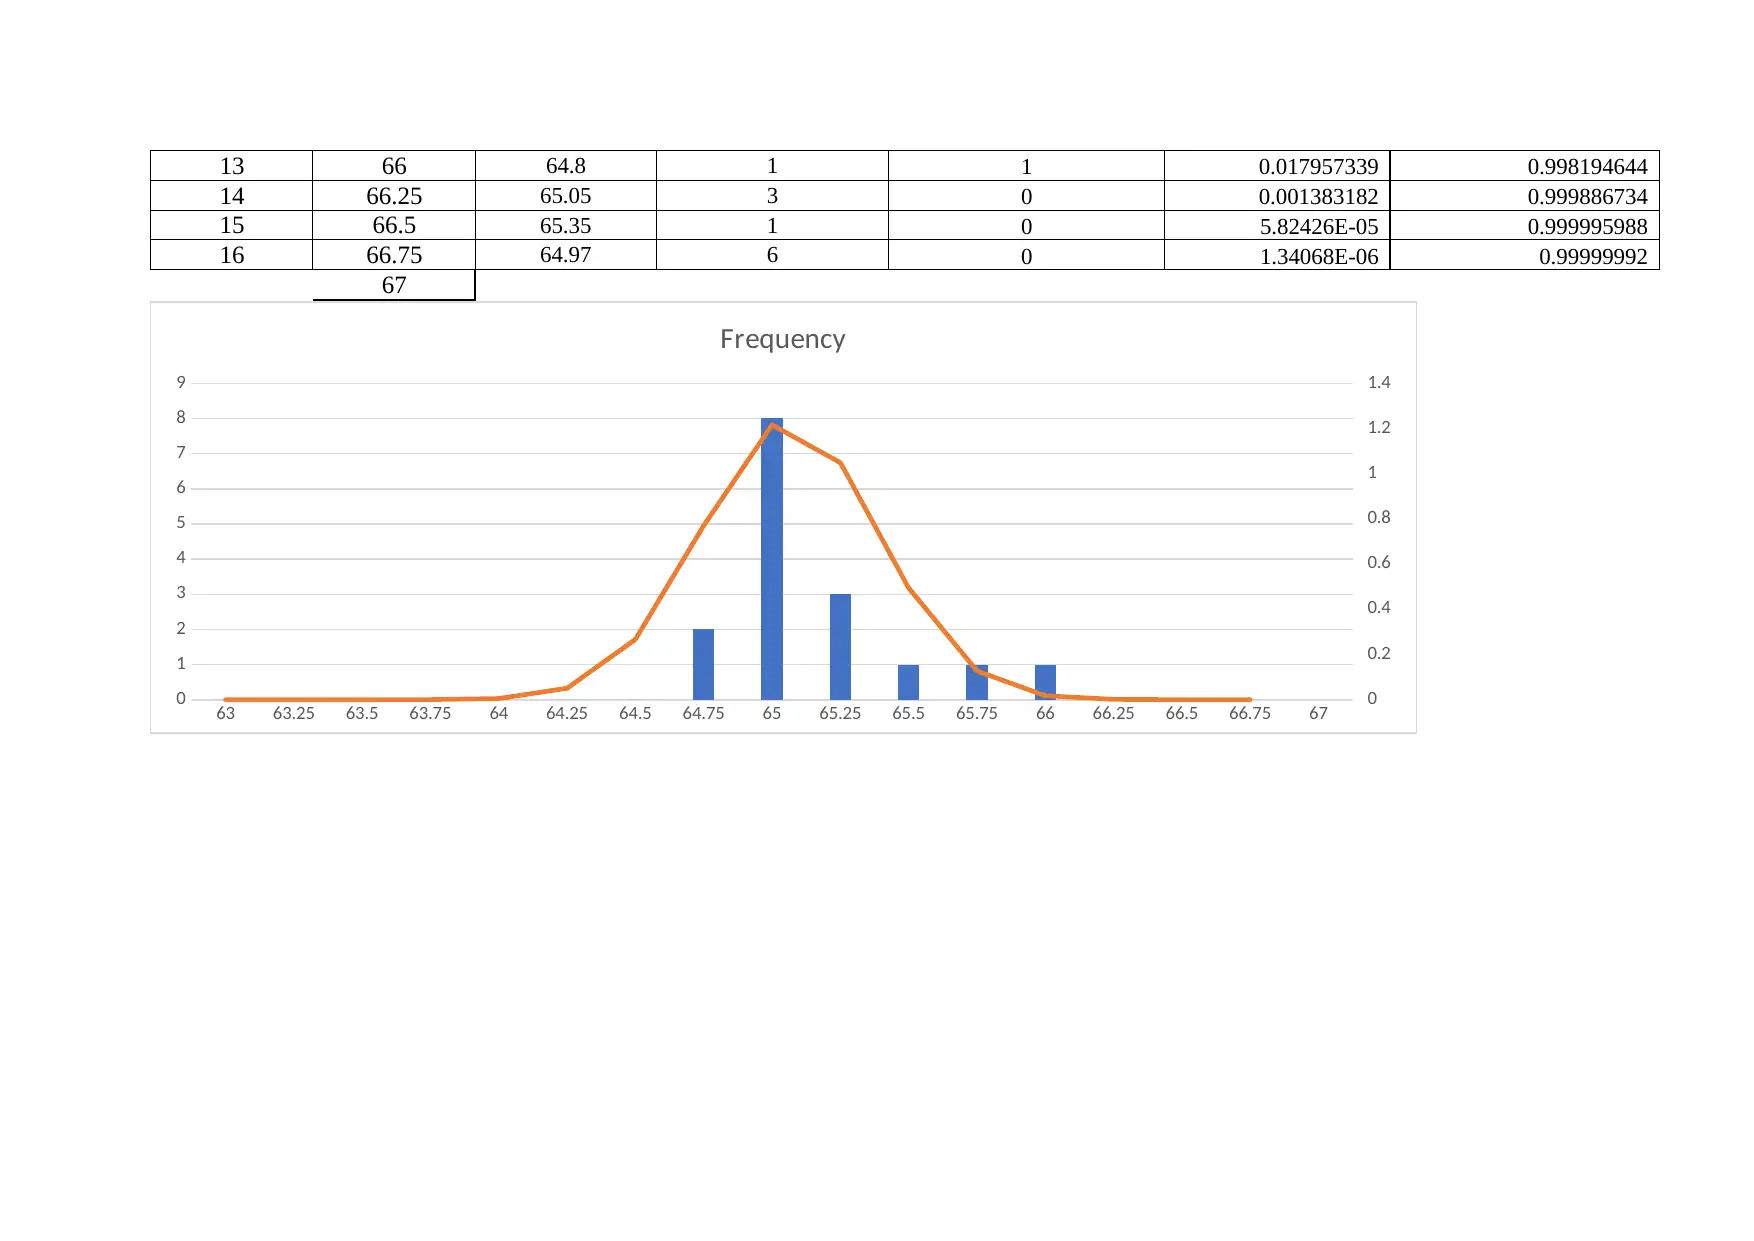
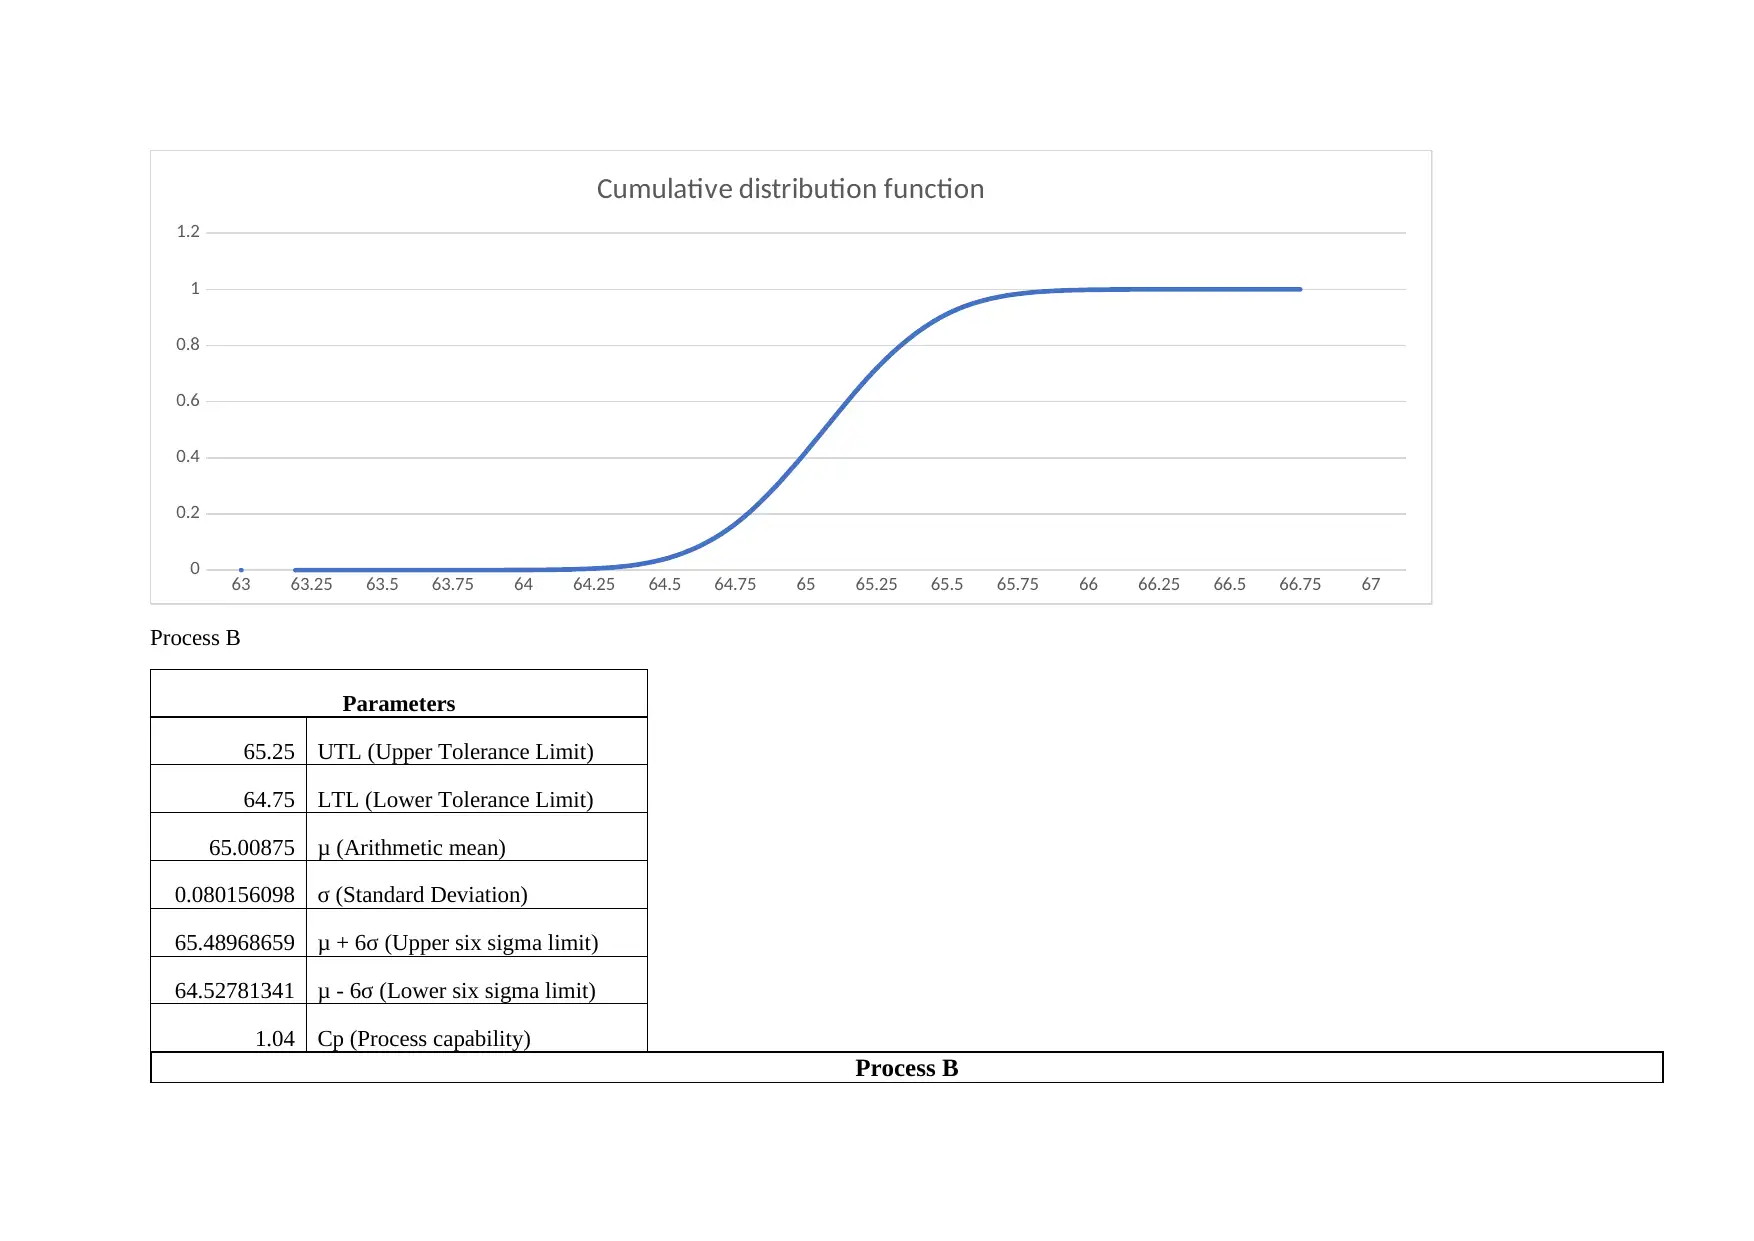
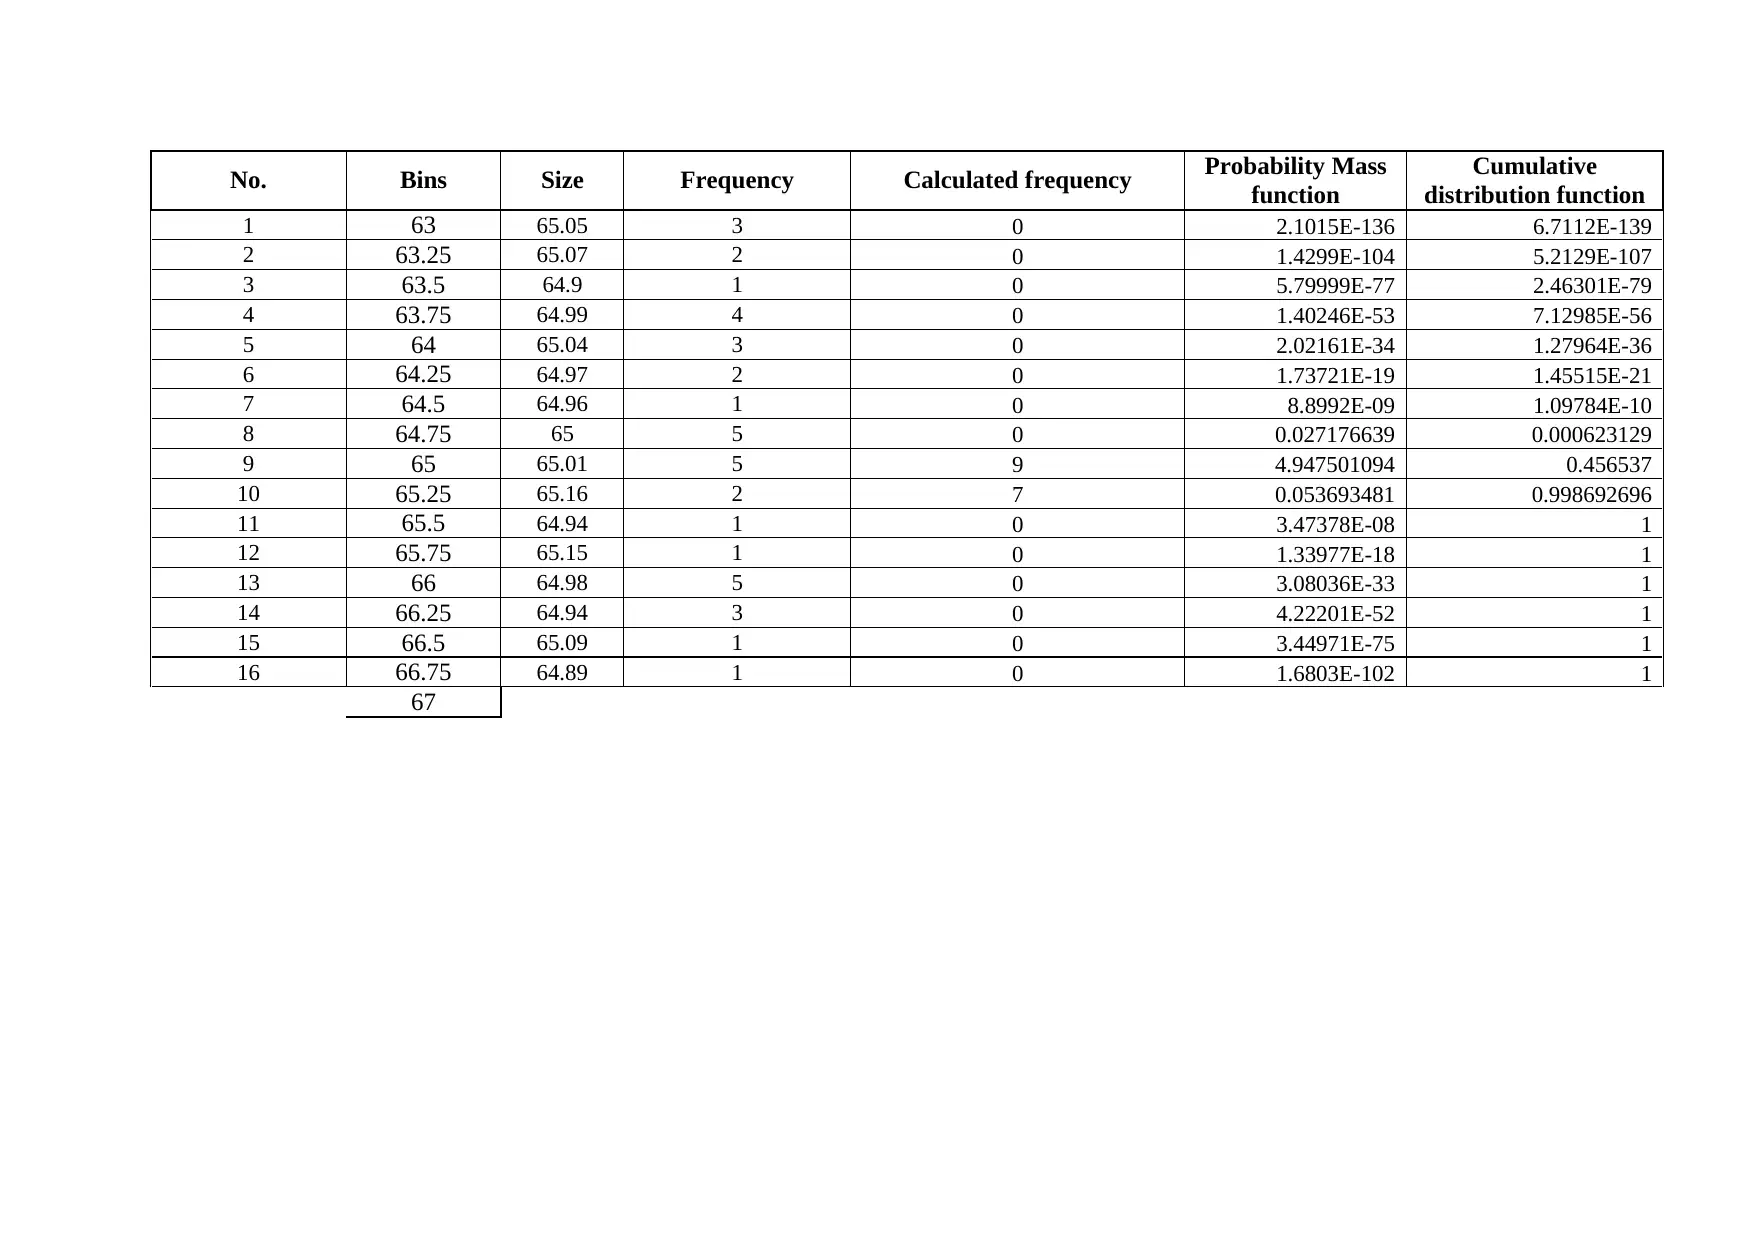
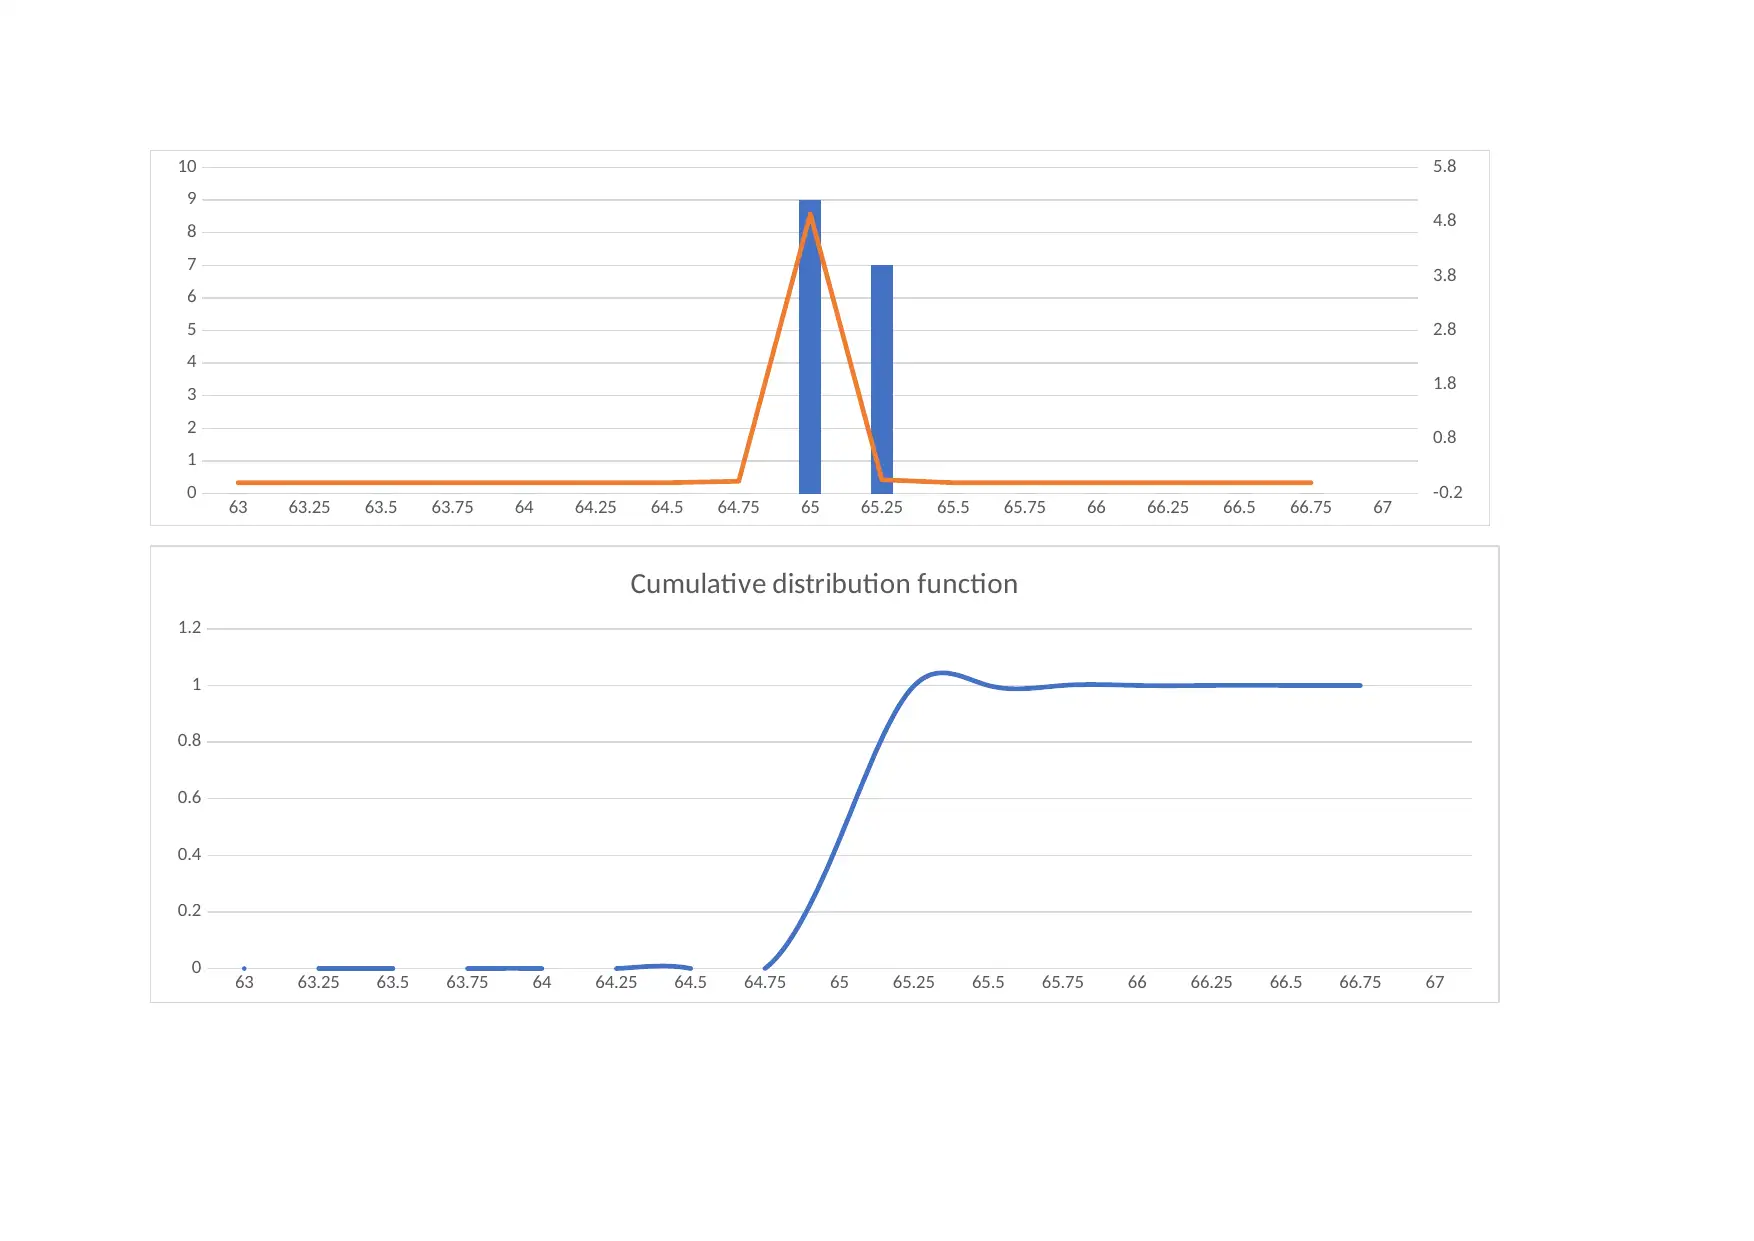
This report addresses the issue of high quality failure costs in a major aerospace system manufacturer, presenting a comprehensive action plan aimed at reducing these costs by 50% over five years. The plan focuses on four key stages: product requirements, quality planning, quality assurance and control, and appraisal costs. It also examines the implications for the three quality cost categories: prevention, appraisal, and failure costs, throughout the proposed period. The report further explores the financial benefits of Design for Manufacturing (DFM), estimating potential savings based on the provided data, and analyzes process capability using statistical methods, comparing two different processes (A and B) to determine the most accurate one. The analysis includes calculations for process capability (Cp) and six sigma limits. Additionally, the report investigates the impact of design choices on product quality and the importance of setting reasonable tolerance limits to mitigate the risk of product failure. Finally, the report discusses the benefits of integrating DFM and assembly into product development, highlighting its positive effects on market readiness and product design.
Document Page
Question 1
Solution
Action plan for quality failure cost
Quality failure cost is a practice that allows the organization to find out the extent to which its
resources are used in the prevention of poor quality. When such information is obtained, the
organization is able to know how much it is saving in the implementation process of improvement. In
five years, the company needs to reduce this cost, by 50%. This is also called prevention cost, which
are the cost incurred in prevention the problems that comes with achieving quality. The course of
action will follow four stages:
Product requirements: this will be done to ensure that the incoming materials are specified
and other things that have to be specified will include: processes, services involved and
finished products. This process will curb some cost from the cost of quality
Quality Planning: this is the creation of plans to achieve quality. There are several documents
that are made which are used to specify the standards of quality, the practices involved,
specifications, sequence of relevant activities of the products that the company produces, and
resources. This shall be avoided by creating reliability plans, operations and having a trust in
the production process, while thoroughly inspecting the finished products.
Quality assurance and quality control: this is a concept of quality management that provides
confidence in the fulfilment of quality requirements. This concept takes place in two ways,
internally to the team that deals with management and externally to the customers, regulators,
or government agencies. Yet quality control, also a concept of quality management, deals
with the performance of the quality checking process. These processes involve the use of
money, they are important, but it is important to look at them deeply and see how much is
spent in them. The system can be maintained but there can be a creation of maintenance of the
quality mechanism to curb the much money spent.
The company can get involved in training so that there’s preparation of programs and
maintenance of the same. This can be done to make sure that each process and the people
involved, are able to participate in the quality assurance at their levels.
Appraisal costs – mostly involve the measuring and checking the actions that are associated with
quality. The cost is spent mostly on the suppliers and customers, how they evaluate the goods they
have bought. This needs to be done by vetting the suppliers, and making sure they are certified to
supply quality raw materials.
Internal failure – these are failures associated with the defective products that are internally produced.
This is when quality assurance is trained to the employees at every stage of production, the production
of defective products will be minimised and there shall be less wastages thus the cost will be reduced
significantly.
External failure costs – the products have now reached the customers and they have discovered the
defects, so the company is either supposed to replace the products with the better ones, or repair the
ones received by the customers. There will be some cost incurred while this takes place. If the internal
failure is minimised, then the external failure will be minimised as well.
tabler-icon-diamond-filled.svg

Paraphrase This Document

Need a fresh take? Get an instant paraphrase of this document with our AI Paraphraser
Document Page
Question 2
Information
Selling price £1,000
Call-off rate per year £5,000
Development cost per year £200,000
Life cycle 5
Development time reduction with DFMA 35%
Percent increased cost 10%
Solution
Design for manufacturing (DFM) is applied when products that are going to be manufactured are
designed first. That the products are designed first, and after which the designed product is channelled
to the manufacturer to give the final product. Financial benefits of the DFM are given below:
DFM helps in the reduction of cost of material that could be potentially wasted. Designing of the
product before manufacturing it, is important because the material size, weight, and other aspects are
taken care of. So, when manufacturing takes place, of the prototype, it will have gone through the
design and reviewed by the Integrated Product Teams (IPT) where all or most of the aspects will have
been taken care of.
Manufacturing that just takes place without considering design, might have some serious defects that
affects the customers. When the customers are affected negatively by the product then the company
loses trust and however much they try to redeem themselves, it will be hard to recover all the
customers that left. Design considerations takes a critical look at the side effects of each part that goes
for manufacturing.
In a way, DFM saves time, which is beneficial to the customer and the company. When a product is
not taken through a design phase, the product has a higher susceptibility of breaking down or failing
and the there will be remanufacturing of the same product. Remanufacturing of the product take into
considerations the things that were overlooked and deemed to be necessary in the final product. Using
the linear cost against time, we notice that the more the product takes the more cost the final product
will be. This is true for DFM products at the same time it is true for the products that do not go
through DFM
Quality of a product is assured once DFM is applied, much as the cost of the product will go up
(according to the model of the product above), but the quality of the finished product will be high.
The product above has gone through production within three years, developmental cost over the three
years is £600,000.00 and five years £1,000,000.00. this means that the cost will increase for 5 years if
the 10% increment is considered.
Document Page
Question 3
Target Dimension (mm) 65
Bilateral Tolerance (±) 0.25
Number of samples sample 40
Process A Process B
No. Size Frequency No. Size Frequency
1 65.1 3 1 65.05 3
2 65.2 2 2 65.07 2
3 64.98 4 3 64.9 1
4 64.87 1 4 64.99 4
5 64.6 1 5 65.04 3
6 65.8 1 6 64.97 2
7 65 6 7 64.96 1
8 64.96 2 8 65 5
9 64.95 3 9 65.01 5
10 64.99 2 10 65.16 2
11 65.7 2 11 64.94 1
12 64.7 2 12 65.15 1
13 64.8 1 13 64.98 5
14 65.05 3 14 64.94 3
15 65.35 1 15 65.09 1
16 64.97 6 16 64.89 1
Document Page
Solution
For the data provided, we have calculated the frequency and the bins and achieved the following results:
Parameters
65.25 UTL (Upper Tolerance Limit)
64.75 LTL (Lower Tolerance Limit)
65.06375 μ (Arithmetic mean)
0.321701207 σ (Standard Deviation)
66.99395724 μ + 6σ (Upper six sigma limit)
63.13354276 μ - 6σ (Lower six sigma limit)
0.26 Cp (Process Capability)
Process A
No. Bins Size Frequency Calculated frequency Probability Mass
function
Cumulative
distribution function
1 63 65.1 3 0 1.43564E-09 7.03586E-11
2 63.25 65.2 2 0 1.55238E-07 8.60204E-09
3 63.5 64.98 4 0 9.17646E-06 5.84334E-07
4 63.75 64.87 1 0 0.000296534 2.21566E-05
5 64 64.6 1 0 0.005238397 0.000472111
6 64.25 65.8 1 0 0.050587791 0.005710915
7 64.5 65 6 0 0.267064867 0.039852311
8 64.75 64.96 2 2 0.770746495 0.164709733
9 65 64.95 3 8 1.215990324 0.421457888
10 65.25 64.99 2 3 1.048751127 0.718689683
11 65.5 65.7 2 1 0.494468378 0.91246187
12 65.75 64.7 2 1 0.127446633 0.983545454
tabler-icon-diamond-filled.svg

Paraphrase This Document

Need a fresh take? Get an instant paraphrase of this document with our AI Paraphraser
Document Page
13 66 64.8 1 1 0.017957339 0.998194644
14 66.25 65.05 3 0 0.001383182 0.999886734
15 66.5 65.35 1 0 5.82426E-05 0.999995988
16 66.75 64.97 6 0 1.34068E-06 0.99999992
67
63 63.25 63.5 63.75 64 64.25 64.5 64.75 65 65.25 65.5 65.75 66 66.25 66.5 66.75 67
0
1
2
3
4
5
6
7
8
9
0
0.2
0.4
0.6
0.8
1
1.2
1.4
Frequency
Document Page
63 63.25 63.5 63.75 64 64.25 64.5 64.75 65 65.25 65.5 65.75 66 66.25 66.5 66.75 67
0
0.2
0.4
0.6
0.8
1
1.2
Cumulative distribution function
Process B
Parameters
65.25 UTL (Upper Tolerance Limit)
64.75 LTL (Lower Tolerance Limit)
65.00875 μ (Arithmetic mean)
0.080156098 σ (Standard Deviation)
65.48968659 μ + 6σ (Upper six sigma limit)
64.52781341 μ - 6σ (Lower six sigma limit)
1.04 Cp (Process capability)
Process B
Document Page
No. Bins Size Frequency Calculated frequency Probability Mass
function
Cumulative
distribution function
1 63 65.05 3 0 2.1015E-136 6.7112E-139
2 63.25 65.07 2 0 1.4299E-104 5.2129E-107
3 63.5 64.9 1 0 5.79999E-77 2.46301E-79
4 63.75 64.99 4 0 1.40246E-53 7.12985E-56
5 64 65.04 3 0 2.02161E-34 1.27964E-36
6 64.25 64.97 2 0 1.73721E-19 1.45515E-21
7 64.5 64.96 1 0 8.8992E-09 1.09784E-10
8 64.75 65 5 0 0.027176639 0.000623129
9 65 65.01 5 9 4.947501094 0.456537
10 65.25 65.16 2 7 0.053693481 0.998692696
11 65.5 64.94 1 0 3.47378E-08 1
12 65.75 65.15 1 0 1.33977E-18 1
13 66 64.98 5 0 3.08036E-33 1
14 66.25 64.94 3 0 4.22201E-52 1
15 66.5 65.09 1 0 3.44971E-75 1
16 66.75 64.89 1 0 1.6803E-102 1
67
tabler-icon-diamond-filled.svg

Paraphrase This Document

Need a fresh take? Get an instant paraphrase of this document with our AI Paraphraser
Document Page
63 63.25 63.5 63.75 64 64.25 64.5 64.75 65 65.25 65.5 65.75 66 66.25 66.5 66.75 67
0
1
2
3
4
5
6
7
8
9
10
-0.2
0.8
1.8
2.8
3.8
4.8
5.8
63 63.25 63.5 63.75 64 64.25 64.5 64.75 65 65.25 65.5 65.75 66 66.25 66.5 66.75 67
0
0.2
0.4
0.6
0.8
1
1.2
Cumulative distribution function
Document Page
Process A,
The targeted size that the machine was to create was 65. According to the probability distribution
function obtained, shows that process A is not accurate, though the probability distribution was
between 64.5 to 65.75. This means there is a large error margin while using process A.
Process B
On the other hand, process B is a more accurate process that will have a narrow distribution of the
range of products. Where the production has more of the targeted amount than process A. in this
process the probability is high of creating 64.75 and 65.25. The suitable process would be process B,
since there shall be less wastages than when the company uses process A.
Question 4
solution
The company has a set standard of the motor supply of 10 parts per million (PPM). The figure below
shows the conformability map
This is the graph that shows occurrence against severity with the boundary showing the acceptable
designs by the company. The rating of the graph is in terms of FMEA rating for the occurrences, or
the probabilities and ppm. According to the graph, d is reduced, the probability of failure occurrences
Document Page
also reduces. That means that when there’s a conditional reduction of a failure Pof the components
move towards the acceptable design zones. According to what is presented, and the figure above of
the conformability curve implies that the acceptable design limits should be sensible to give room for
a safety margin so that the designer can have a freedom to allow other external components that are
not under their control. The external components that makes up the final product can cause a big
failure to the final product, so the strategy is a wrong strategy, the management needs to give an
allowance or a reasonable probability distribution for the production of the final product. For a feature
of a product, defining an area of acceptable design on a graph that plots occurrences against severity
is a possibility. For the design to be accepted, there can be some improvements when there’s an
additional inspections and test operations. So, the targets for the process capability should not be
made strict, somehow (as this reduces the chances of failure), but there should be a considerable
safety margin allowed.
Question 5
Solution
By having an analysis of the acceptable limits or tolerance limits that is performed on
individual components that makes up a product.
Prediction variability, when variation is considered a product performance will fluctuate in
performance and if left unaccounted, the design might fail to meet the correct criteria. When
prediction takes place in the early phase of product development then this will mitigate the
non-performance chances.
By comparing and evaluating designs – within the manufacturing team, there must be
alternative concepts being embraced that meets the specifications requirements. The problems
will be highlighted in the design.
Mode of generation – the knowledge of CP that is implemented in the manufacturing of a
product can be used for analysis in the early stages of product design, so that factors like
texture of surfaces, tolerances in dimensions etc, can be addressed
Question 6
Solution
Design for manufacturing or assembly allows for product review, obviously research has been carried
out on what the market needs. So, the engineers that deals with designing can carryout the design
tailor-made for the market. By the time marketing stage reaches, it will find when the product is a
head of the competition, by providing the market with what they required, so the time for marketing is
reduced significantly because of that. Also, some companies can have their team reveal to the market
what is coming up, so that they can give comments and recommendation that allows for room for
improvement at the design stage, so that the resultant product, meets what they need, hence less time
in marketing which is suitable for businesses.
chevron_up_icon
1 out of 10
circle_padding
hide_on_mobile
zoom_out_icon
[object Object]