SOSC884 Social Research Design and Analysis: Data Analysis with SPSS
VerifiedAdded on 2022/10/09
|14
|3351
|93
Homework Assignment
AI Summary
This assignment, focusing on SOSC884 Social Research Design and Analysis, demonstrates data analysis techniques using SPSS. The solution begins with frequency distributions and graphical representations of nominal, ordinal, and scale variables, including pie charts, bar graphs, and line graphs, to visualize respondent data such as sex, subjective class identification, frequency of sexual activity, and total family income. The analysis then progresses to cross-tabulations, examining relationships between variables like prayer frequency and views on sex before marriage, and religious preference with prayer frequency. The assignment further explores statistical significance using Pearson's Chi-Square, analyzing the relationship between gender and viewing X-rated movies. The analysis includes null hypothesis testing and interpretation of results, providing a comprehensive application of research design and statistical methods in social research. The results from the SPSS analysis are provided to support the claims and findings of the assignment.
Running head: SOSC884 SOCIAL RESEARCH DESIGN & ANALYSIS 1
SOSC884 Social Research Design and Analysis
Student’s Name
Institutional Affiliation
SOSC884 Social Research Design and Analysis
Student’s Name
Institutional Affiliation
Paraphrase This Document
Need a fresh take? Get an instant paraphrase of this document with our AI Paraphraser
SOSC884 SOCIAL RESEARCH DESIGN & ANALYSIS 2
Practical Exercise-Data Analysis using SPSS
PART 1 (20 Marks)
1. Four Frequency distributions and four Graphs (8 Marks)
Frequency distribution tables are important statistical tools when analyzing collected data
into an easier way that a researcher can understand. It displays the frequency that each coded
value has and its respective percentage. These tables will enable the creation of visual
representatives of the data using charts and graphs.
Nominal variables are variables with two or more groupings or categories which no specific
order. According to the data given, respondents’ sex is an example of a nominal variable since
both male and female have no intrinsic ordering. Table 1 shows that out of the 1500 respondents
that were involved in this study, 686 were male and 814 were females. This implies that 45.7%
of the sample are male respondents while 54.3%are females.
Table 1: Frequency Distribution of Respondents Sex
Frequency Percent
Valid
Percent
Cumulative
Percent
Valid MALE 686 45.7 45.7 45.7
FEMALE 814 54.3 54.3 100.0
Total 1500 100.0 100.0
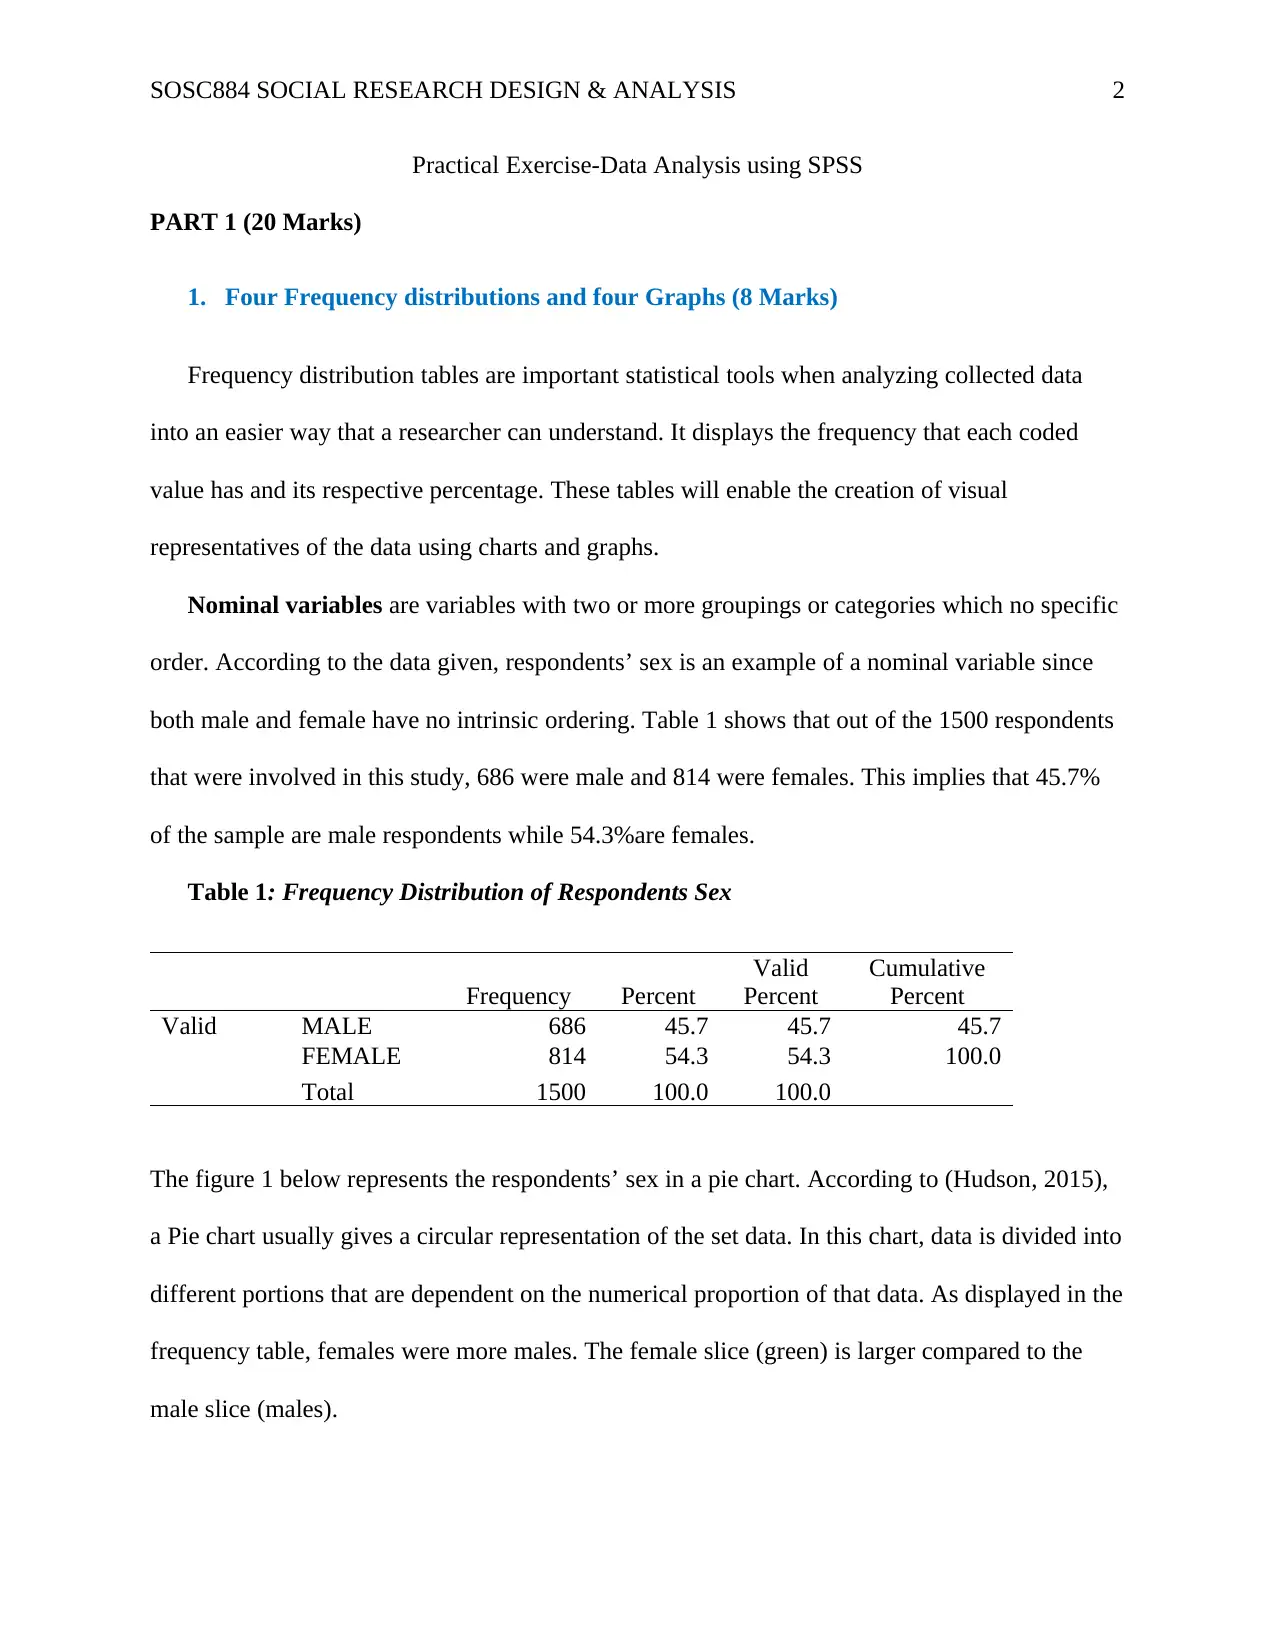
The figure 1 below represents the respondents’ sex in a pie chart. According to (Hudson, 2015),
a Pie chart usually gives a circular representation of the set data. In this chart, data is divided into
different portions that are dependent on the numerical proportion of that data. As displayed in the
frequency table, females were more males. The female slice (green) is larger compared to the
male slice (males).
Practical Exercise-Data Analysis using SPSS
PART 1 (20 Marks)
1. Four Frequency distributions and four Graphs (8 Marks)
Frequency distribution tables are important statistical tools when analyzing collected data
into an easier way that a researcher can understand. It displays the frequency that each coded
value has and its respective percentage. These tables will enable the creation of visual
representatives of the data using charts and graphs.
Nominal variables are variables with two or more groupings or categories which no specific
order. According to the data given, respondents’ sex is an example of a nominal variable since
both male and female have no intrinsic ordering. Table 1 shows that out of the 1500 respondents
that were involved in this study, 686 were male and 814 were females. This implies that 45.7%
of the sample are male respondents while 54.3%are females.
Table 1: Frequency Distribution of Respondents Sex
Frequency Percent
Valid
Percent
Cumulative
Percent
Valid MALE 686 45.7 45.7 45.7
FEMALE 814 54.3 54.3 100.0
Total 1500 100.0 100.0
The figure 1 below represents the respondents’ sex in a pie chart. According to (Hudson, 2015),
a Pie chart usually gives a circular representation of the set data. In this chart, data is divided into
different portions that are dependent on the numerical proportion of that data. As displayed in the
frequency table, females were more males. The female slice (green) is larger compared to the
male slice (males).
SOSC884 SOCIAL RESEARCH DESIGN & ANALYSIS 3
Figure 1: Respondents Sex Pie Chart
Categorical and continuous data sets can be presented through bar, line and pie charts to
summarize and this present this data in a manner than one can easily understand.
In Ordinal variables, data variable can be ranked. These rankings are usually not equal
From the data given, Subjective Class Identification, is an example of the ordinal variable. Table
2 shows that there were 1487 valid responses out of the 1500 respondents that were involved in
this study. From this, 150(10.1%) were from the lower class, 644 (43.3%) were from working
class5, 639 (43%) were from the middle class and 54 (3.6%) were from the upper class.
Table 2: Frequency Distribution of Subjective Class Identification
Frequency Percent
Valid
Percent
Cumulative
Percent
Valid LOWER CLASS 150 10.0 10.1 10.1
WORKING CLASS 644 42.9 43.3 53.4
MIDDLE CLASS 639 42.6 43.0 96.4
UPPER CLASS 54 3.6 3.6 100.0
Total 1487 99.1 100.0
Missing DK 10 .7
NA 3 .2
Total 13 .9
Total 1500 100.0
⊘ This is a preview!⊘
Do you want full access?
Subscribe today to unlock all pages.
Trusted by 1+ million students worldwide
SOSC884 SOCIAL RESEARCH DESIGN & ANALYSIS 4
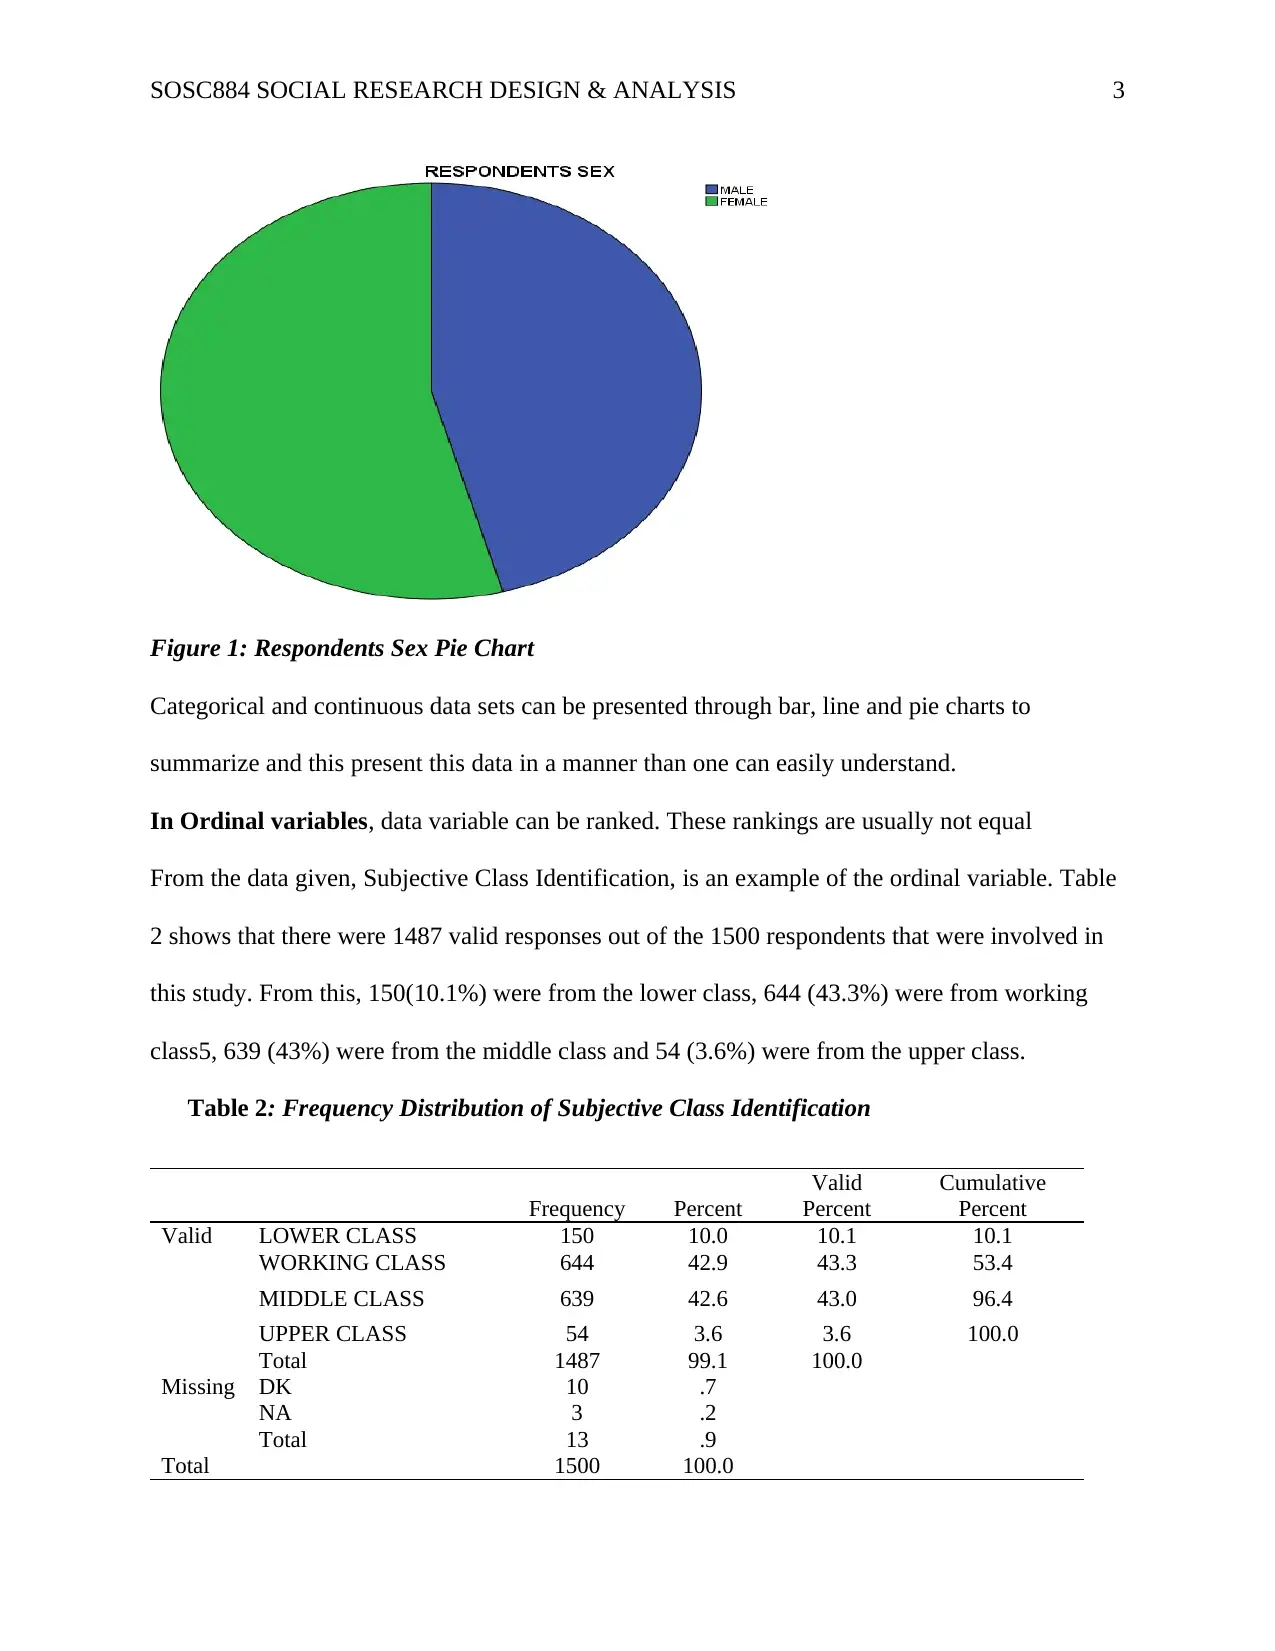
From figure 2 below, most responses were classified into the working class and middle
class respectively. Few individuals were from the upper class.
Figure 2: Subjective class Bar graph
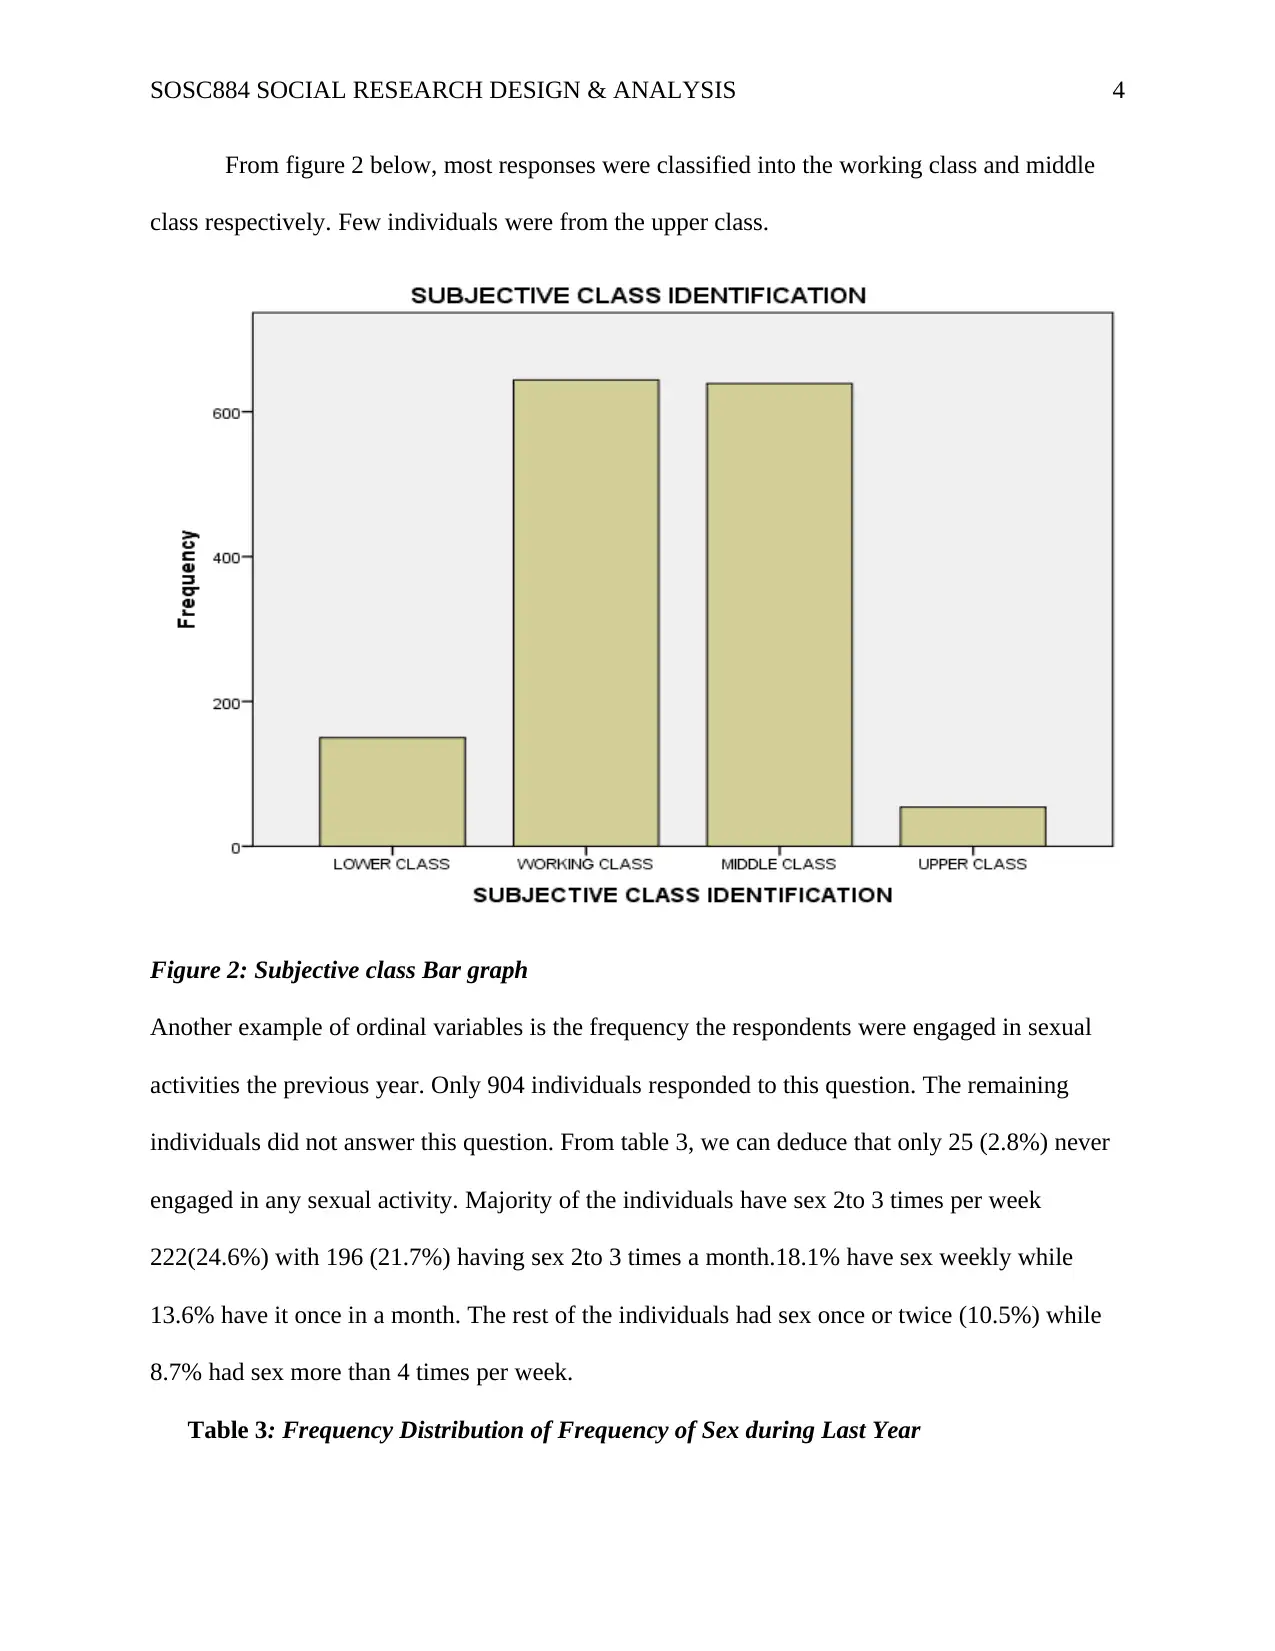
Another example of ordinal variables is the frequency the respondents were engaged in sexual
activities the previous year. Only 904 individuals responded to this question. The remaining
individuals did not answer this question. From table 3, we can deduce that only 25 (2.8%) never
engaged in any sexual activity. Majority of the individuals have sex 2to 3 times per week
222(24.6%) with 196 (21.7%) having sex 2to 3 times a month.18.1% have sex weekly while
13.6% have it once in a month. The rest of the individuals had sex once or twice (10.5%) while
8.7% had sex more than 4 times per week.
Table 3: Frequency Distribution of Frequency of Sex during Last Year
From figure 2 below, most responses were classified into the working class and middle
class respectively. Few individuals were from the upper class.
Figure 2: Subjective class Bar graph
Another example of ordinal variables is the frequency the respondents were engaged in sexual
activities the previous year. Only 904 individuals responded to this question. The remaining
individuals did not answer this question. From table 3, we can deduce that only 25 (2.8%) never
engaged in any sexual activity. Majority of the individuals have sex 2to 3 times per week
222(24.6%) with 196 (21.7%) having sex 2to 3 times a month.18.1% have sex weekly while
13.6% have it once in a month. The rest of the individuals had sex once or twice (10.5%) while
8.7% had sex more than 4 times per week.
Table 3: Frequency Distribution of Frequency of Sex during Last Year
Paraphrase This Document
Need a fresh take? Get an instant paraphrase of this document with our AI Paraphraser
SOSC884 SOCIAL RESEARCH DESIGN & ANALYSIS 5
Frequency Percent
Valid
Percent
Cumulative
Percent
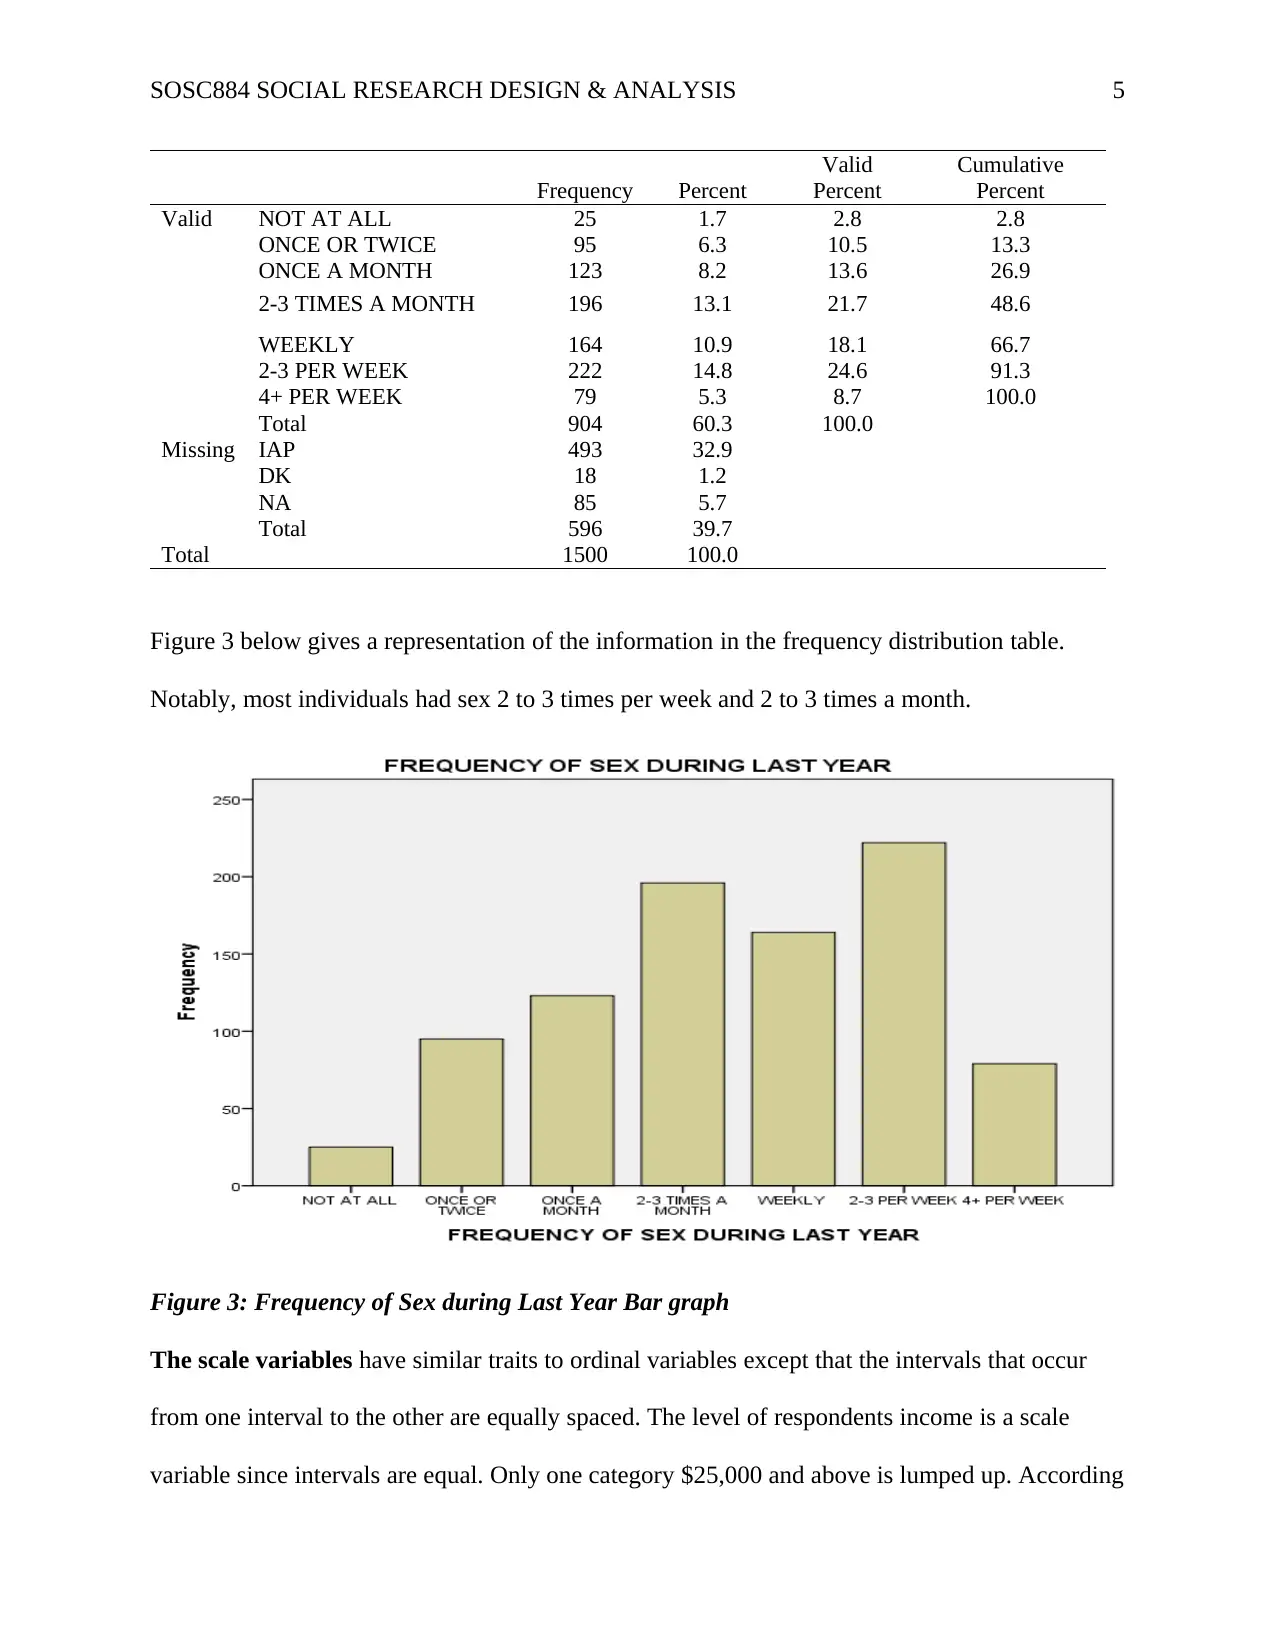
Valid NOT AT ALL 25 1.7 2.8 2.8
ONCE OR TWICE 95 6.3 10.5 13.3
ONCE A MONTH 123 8.2 13.6 26.9
2-3 TIMES A MONTH 196 13.1 21.7 48.6
WEEKLY 164 10.9 18.1 66.7
2-3 PER WEEK 222 14.8 24.6 91.3
4+ PER WEEK 79 5.3 8.7 100.0
Total 904 60.3 100.0
Missing IAP 493 32.9
DK 18 1.2
NA 85 5.7
Total 596 39.7
Total 1500 100.0
Figure 3 below gives a representation of the information in the frequency distribution table.
Notably, most individuals had sex 2 to 3 times per week and 2 to 3 times a month.
Figure 3: Frequency of Sex during Last Year Bar graph
The scale variables have similar traits to ordinal variables except that the intervals that occur
from one interval to the other are equally spaced. The level of respondents income is a scale
variable since intervals are equal. Only one category $25,000 and above is lumped up. According
Frequency Percent
Valid
Percent
Cumulative
Percent
Valid NOT AT ALL 25 1.7 2.8 2.8
ONCE OR TWICE 95 6.3 10.5 13.3
ONCE A MONTH 123 8.2 13.6 26.9
2-3 TIMES A MONTH 196 13.1 21.7 48.6
WEEKLY 164 10.9 18.1 66.7
2-3 PER WEEK 222 14.8 24.6 91.3
4+ PER WEEK 79 5.3 8.7 100.0
Total 904 60.3 100.0
Missing IAP 493 32.9
DK 18 1.2
NA 85 5.7
Total 596 39.7
Total 1500 100.0
Figure 3 below gives a representation of the information in the frequency distribution table.
Notably, most individuals had sex 2 to 3 times per week and 2 to 3 times a month.
Figure 3: Frequency of Sex during Last Year Bar graph
The scale variables have similar traits to ordinal variables except that the intervals that occur
from one interval to the other are equally spaced. The level of respondents income is a scale
variable since intervals are equal. Only one category $25,000 and above is lumped up. According
SOSC884 SOCIAL RESEARCH DESIGN & ANALYSIS 6
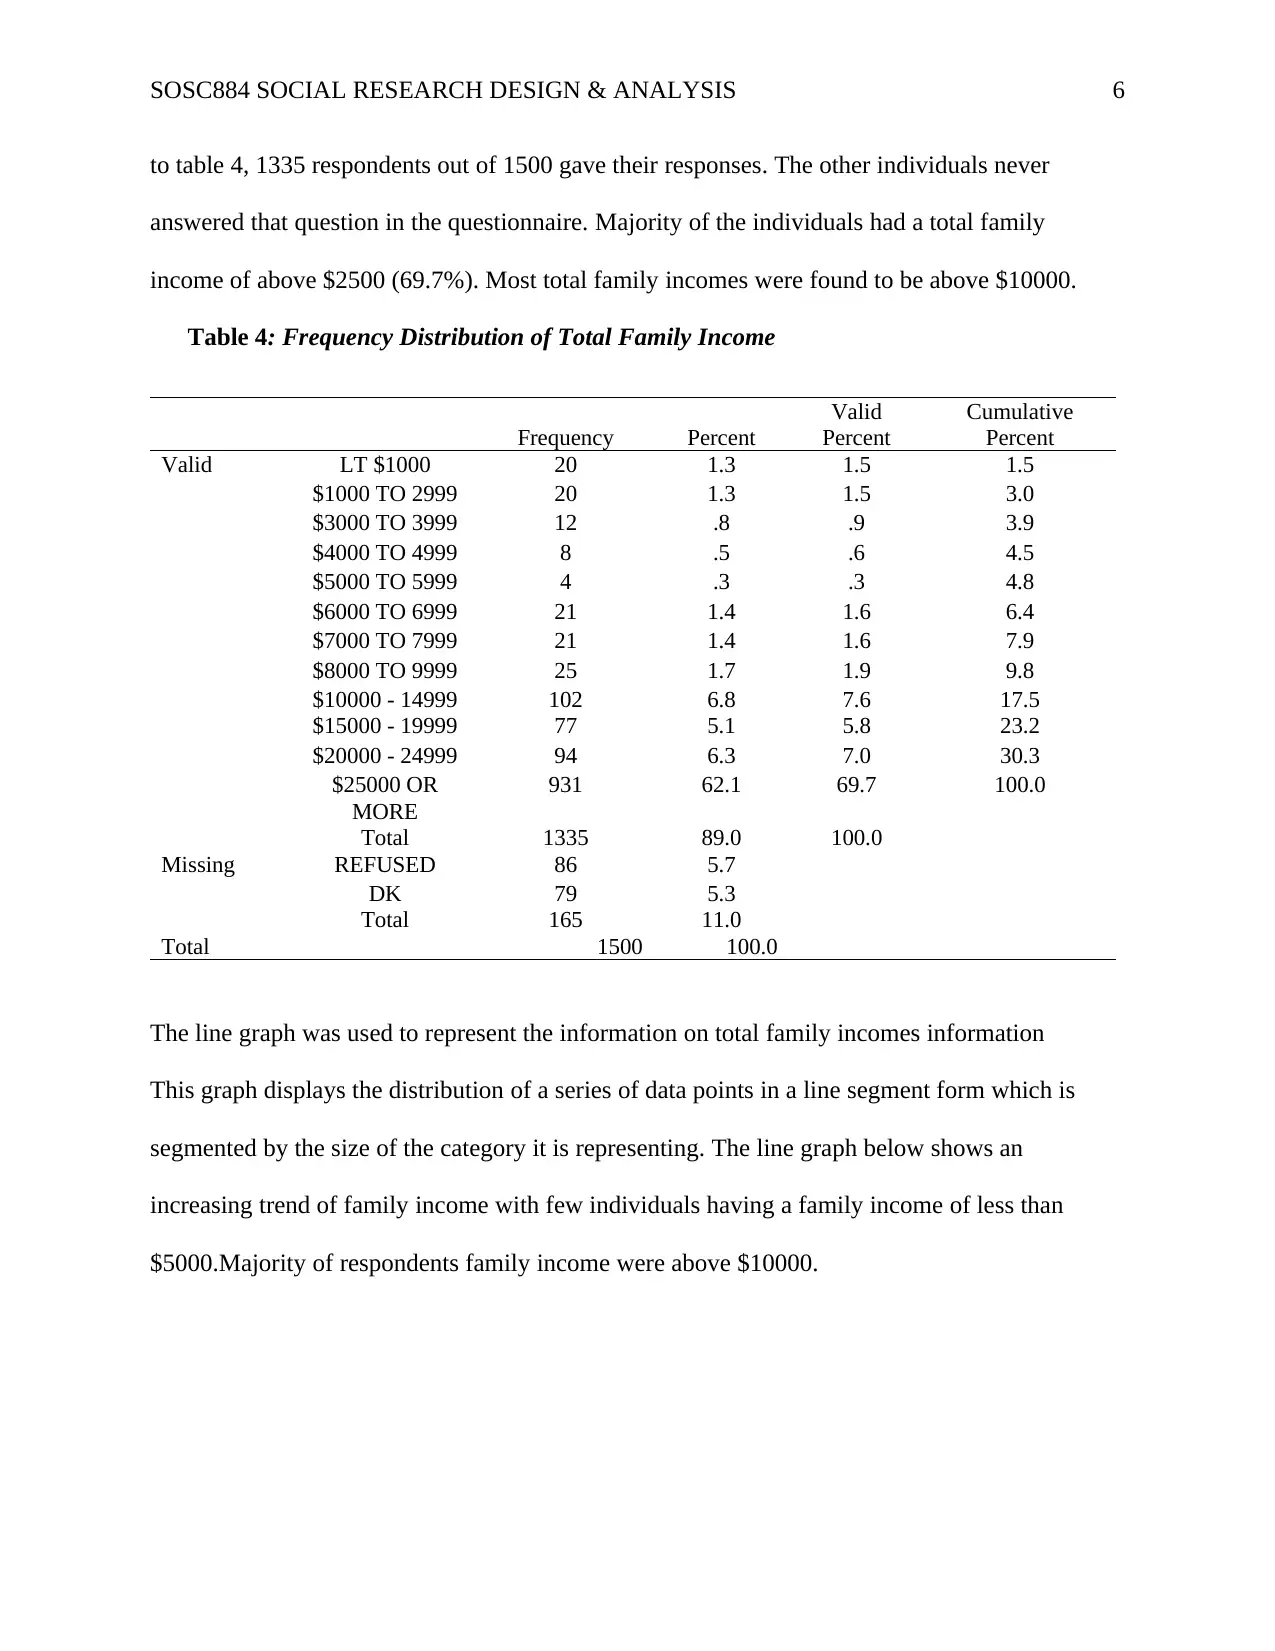
to table 4, 1335 respondents out of 1500 gave their responses. The other individuals never
answered that question in the questionnaire. Majority of the individuals had a total family
income of above $2500 (69.7%). Most total family incomes were found to be above $10000.
Table 4: Frequency Distribution of Total Family Income
Frequency Percent
Valid
Percent
Cumulative
Percent
Valid LT $1000 20 1.3 1.5 1.5
$1000 TO 2999 20 1.3 1.5 3.0
$3000 TO 3999 12 .8 .9 3.9
$4000 TO 4999 8 .5 .6 4.5
$5000 TO 5999 4 .3 .3 4.8
$6000 TO 6999 21 1.4 1.6 6.4
$7000 TO 7999 21 1.4 1.6 7.9
$8000 TO 9999 25 1.7 1.9 9.8
$10000 - 14999 102 6.8 7.6 17.5
$15000 - 19999 77 5.1 5.8 23.2
$20000 - 24999 94 6.3 7.0 30.3
$25000 OR
MORE
931 62.1 69.7 100.0
Total 1335 89.0 100.0
Missing REFUSED 86 5.7
DK 79 5.3
Total 165 11.0
Total 1500 100.0
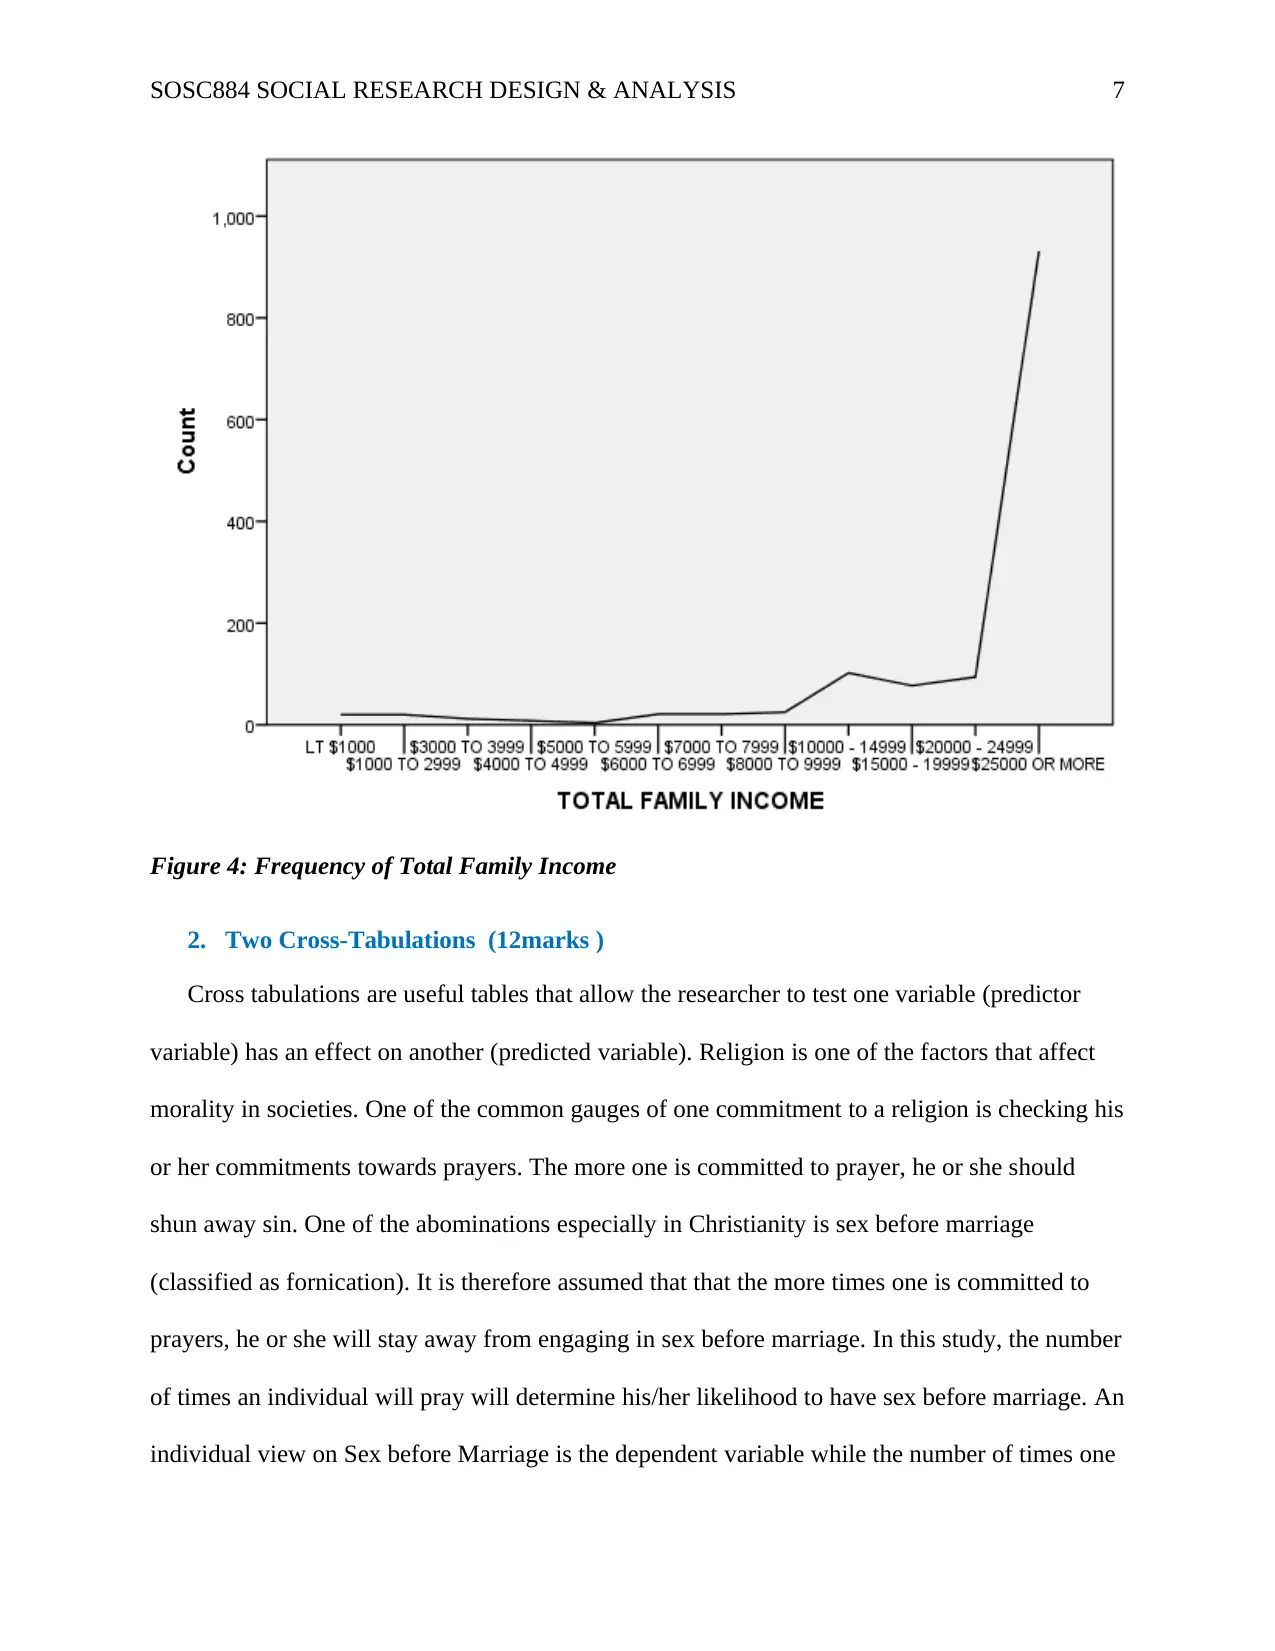
The line graph was used to represent the information on total family incomes information
This graph displays the distribution of a series of data points in a line segment form which is
segmented by the size of the category it is representing. The line graph below shows an
increasing trend of family income with few individuals having a family income of less than
$5000.Majority of respondents family income were above $10000.
to table 4, 1335 respondents out of 1500 gave their responses. The other individuals never
answered that question in the questionnaire. Majority of the individuals had a total family
income of above $2500 (69.7%). Most total family incomes were found to be above $10000.
Table 4: Frequency Distribution of Total Family Income
Frequency Percent
Valid
Percent
Cumulative
Percent
Valid LT $1000 20 1.3 1.5 1.5
$1000 TO 2999 20 1.3 1.5 3.0
$3000 TO 3999 12 .8 .9 3.9
$4000 TO 4999 8 .5 .6 4.5
$5000 TO 5999 4 .3 .3 4.8
$6000 TO 6999 21 1.4 1.6 6.4
$7000 TO 7999 21 1.4 1.6 7.9
$8000 TO 9999 25 1.7 1.9 9.8
$10000 - 14999 102 6.8 7.6 17.5
$15000 - 19999 77 5.1 5.8 23.2
$20000 - 24999 94 6.3 7.0 30.3
$25000 OR
MORE
931 62.1 69.7 100.0
Total 1335 89.0 100.0
Missing REFUSED 86 5.7
DK 79 5.3
Total 165 11.0
Total 1500 100.0
The line graph was used to represent the information on total family incomes information
This graph displays the distribution of a series of data points in a line segment form which is
segmented by the size of the category it is representing. The line graph below shows an
increasing trend of family income with few individuals having a family income of less than
$5000.Majority of respondents family income were above $10000.
⊘ This is a preview!⊘
Do you want full access?
Subscribe today to unlock all pages.
Trusted by 1+ million students worldwide
SOSC884 SOCIAL RESEARCH DESIGN & ANALYSIS 7
Figure 4: Frequency of Total Family Income
2. Two Cross-Tabulations (12marks )
Cross tabulations are useful tables that allow the researcher to test one variable (predictor
variable) has an effect on another (predicted variable). Religion is one of the factors that affect
morality in societies. One of the common gauges of one commitment to a religion is checking his
or her commitments towards prayers. The more one is committed to prayer, he or she should
shun away sin. One of the abominations especially in Christianity is sex before marriage
(classified as fornication). It is therefore assumed that that the more times one is committed to
prayers, he or she will stay away from engaging in sex before marriage. In this study, the number
of times an individual will pray will determine his/her likelihood to have sex before marriage. An
individual view on Sex before Marriage is the dependent variable while the number of times one
Paraphrase This Document
Need a fresh take? Get an instant paraphrase of this document with our AI Paraphraser
SOSC884 SOCIAL RESEARCH DESIGN & ANALYSIS 8
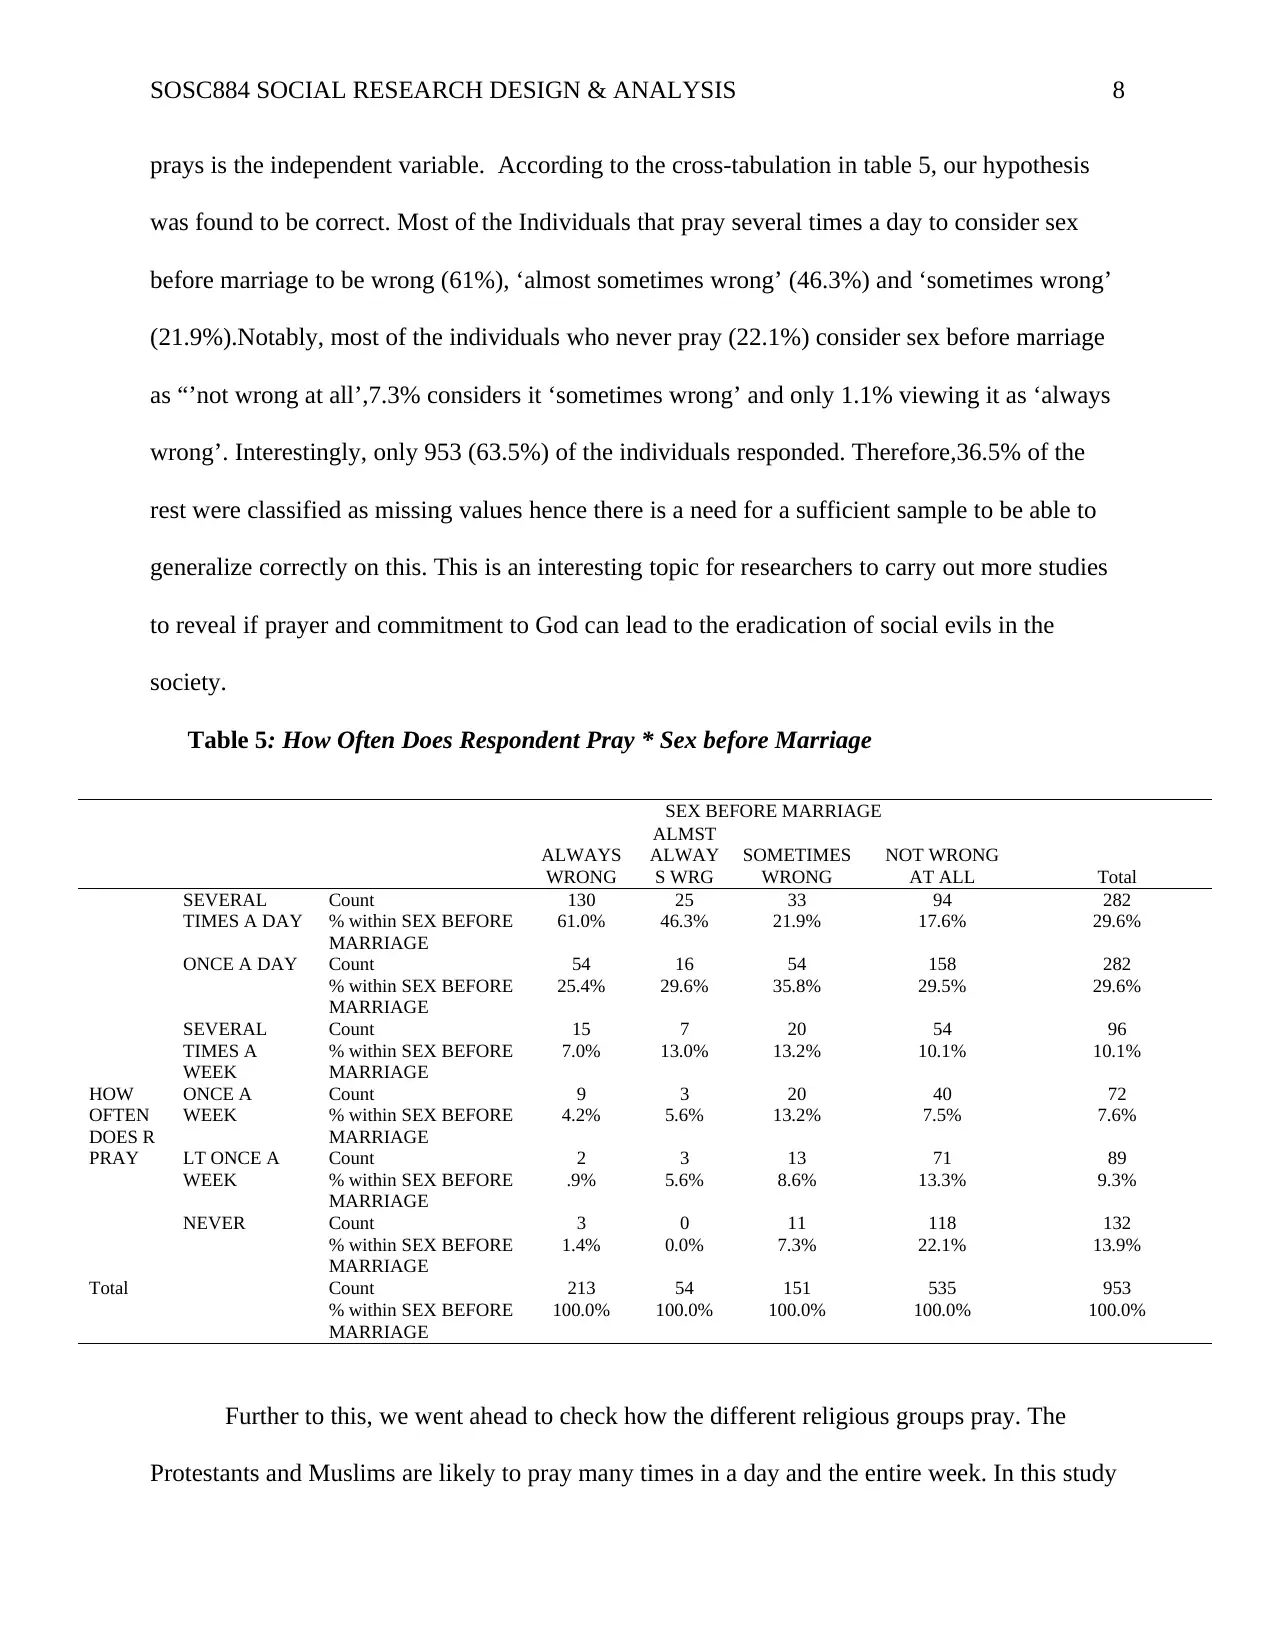
prays is the independent variable. According to the cross-tabulation in table 5, our hypothesis
was found to be correct. Most of the Individuals that pray several times a day to consider sex
before marriage to be wrong (61%), ‘almost sometimes wrong’ (46.3%) and ‘sometimes wrong’
(21.9%).Notably, most of the individuals who never pray (22.1%) consider sex before marriage
as “’not wrong at all’,7.3% considers it ‘sometimes wrong’ and only 1.1% viewing it as ‘always
wrong’. Interestingly, only 953 (63.5%) of the individuals responded. Therefore,36.5% of the
rest were classified as missing values hence there is a need for a sufficient sample to be able to
generalize correctly on this. This is an interesting topic for researchers to carry out more studies
to reveal if prayer and commitment to God can lead to the eradication of social evils in the
society.
Table 5: How Often Does Respondent Pray * Sex before Marriage
SEX BEFORE MARRIAGE
Total
ALWAYS
WRONG
ALMST
ALWAY
S WRG
SOMETIMES
WRONG
NOT WRONG
AT ALL
HOW
OFTEN
DOES R
PRAY
SEVERAL
TIMES A DAY
Count 130 25 33 94 282
% within SEX BEFORE
MARRIAGE
61.0% 46.3% 21.9% 17.6% 29.6%
ONCE A DAY Count 54 16 54 158 282
% within SEX BEFORE
MARRIAGE
25.4% 29.6% 35.8% 29.5% 29.6%
SEVERAL
TIMES A
WEEK
Count 15 7 20 54 96
% within SEX BEFORE
MARRIAGE
7.0% 13.0% 13.2% 10.1% 10.1%
ONCE A
WEEK
Count 9 3 20 40 72
% within SEX BEFORE
MARRIAGE
4.2% 5.6% 13.2% 7.5% 7.6%
LT ONCE A
WEEK
Count 2 3 13 71 89
% within SEX BEFORE
MARRIAGE
.9% 5.6% 8.6% 13.3% 9.3%
NEVER Count 3 0 11 118 132
% within SEX BEFORE
MARRIAGE
1.4% 0.0% 7.3% 22.1% 13.9%
Total Count 213 54 151 535 953
% within SEX BEFORE
MARRIAGE
100.0% 100.0% 100.0% 100.0% 100.0%
Further to this, we went ahead to check how the different religious groups pray. The
Protestants and Muslims are likely to pray many times in a day and the entire week. In this study
SOSC884 SOCIAL RESEARCH DESIGN & ANALYSIS 9
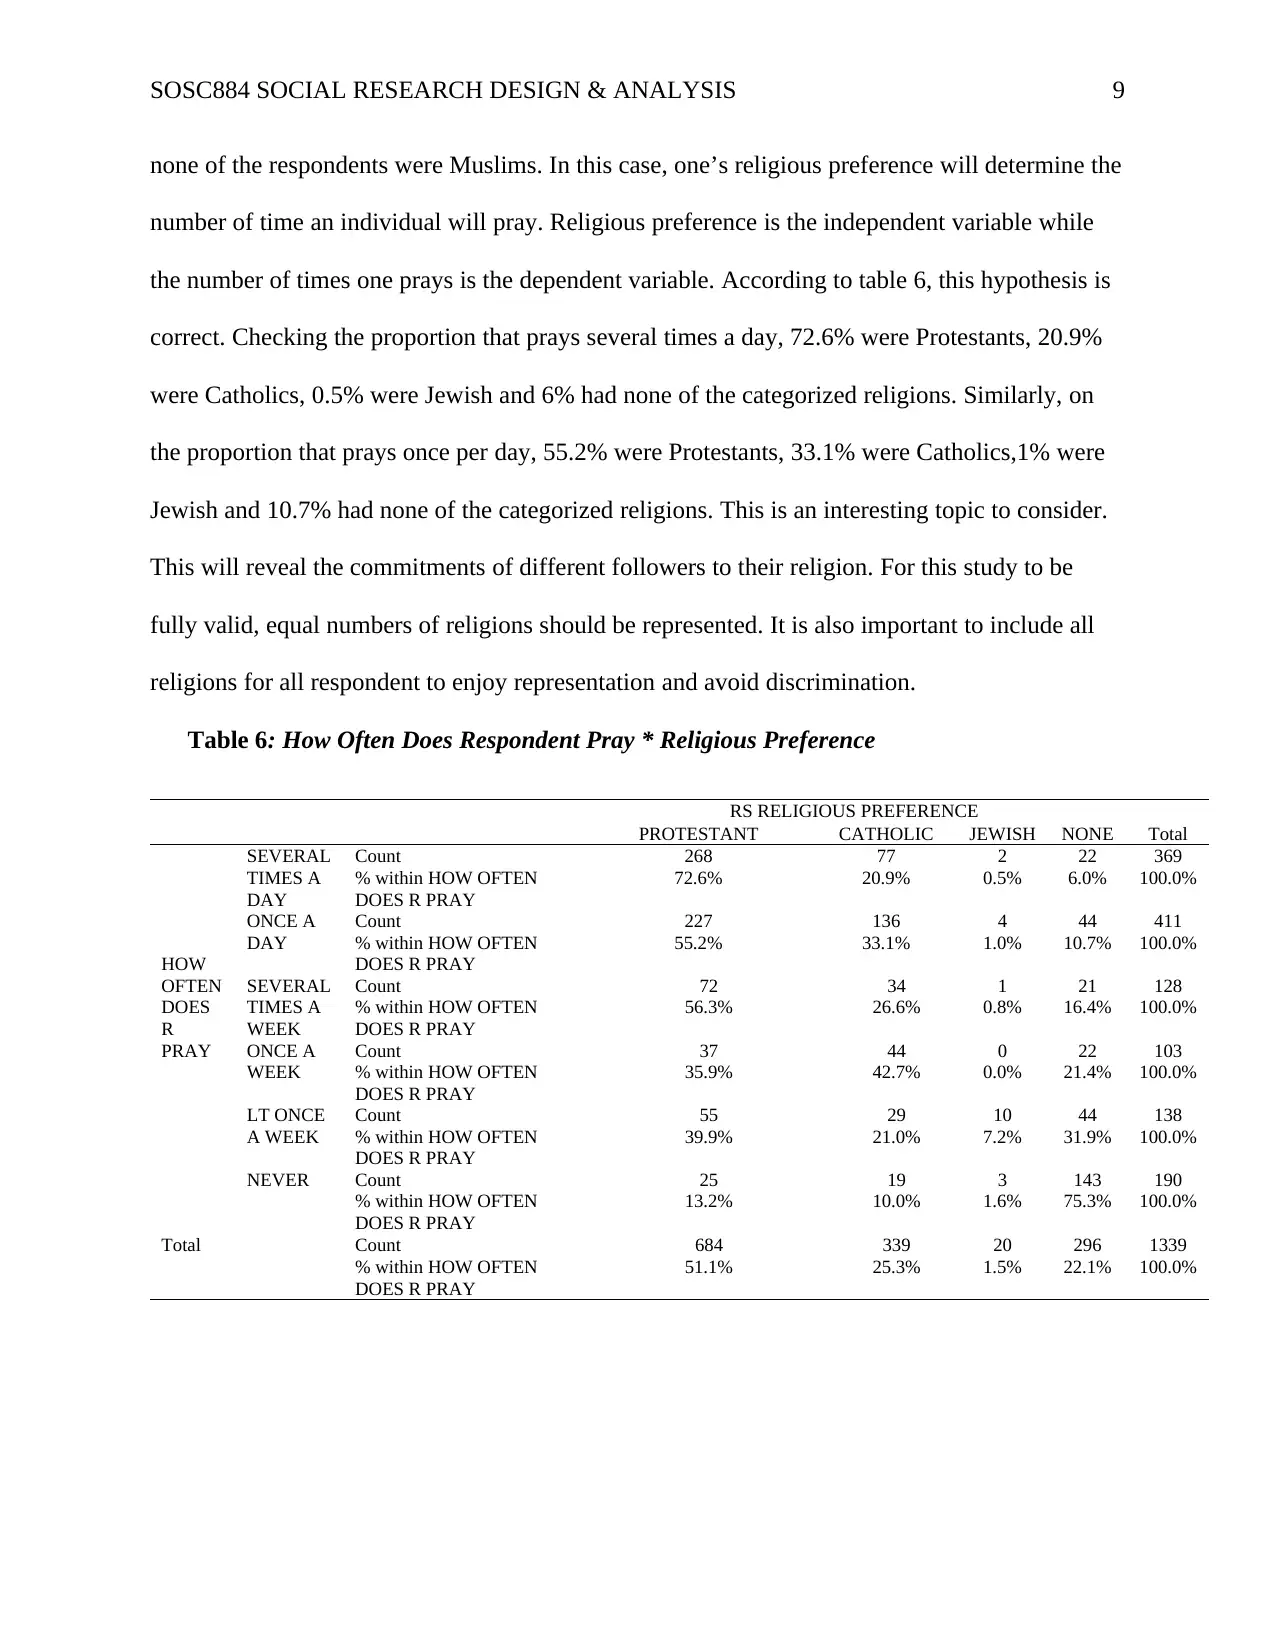
none of the respondents were Muslims. In this case, one’s religious preference will determine the
number of time an individual will pray. Religious preference is the independent variable while
the number of times one prays is the dependent variable. According to table 6, this hypothesis is
correct. Checking the proportion that prays several times a day, 72.6% were Protestants, 20.9%
were Catholics, 0.5% were Jewish and 6% had none of the categorized religions. Similarly, on
the proportion that prays once per day, 55.2% were Protestants, 33.1% were Catholics,1% were
Jewish and 10.7% had none of the categorized religions. This is an interesting topic to consider.
This will reveal the commitments of different followers to their religion. For this study to be
fully valid, equal numbers of religions should be represented. It is also important to include all
religions for all respondent to enjoy representation and avoid discrimination.
Table 6: How Often Does Respondent Pray * Religious Preference
RS RELIGIOUS PREFERENCE
TotalPROTESTANT CATHOLIC JEWISH NONE
HOW
OFTEN
DOES
R
PRAY
SEVERAL
TIMES A
DAY
Count 268 77 2 22 369
% within HOW OFTEN
DOES R PRAY
72.6% 20.9% 0.5% 6.0% 100.0%
ONCE A
DAY
Count 227 136 4 44 411
% within HOW OFTEN
DOES R PRAY
55.2% 33.1% 1.0% 10.7% 100.0%
SEVERAL
TIMES A
WEEK
Count 72 34 1 21 128
% within HOW OFTEN
DOES R PRAY
56.3% 26.6% 0.8% 16.4% 100.0%
ONCE A
WEEK
Count 37 44 0 22 103
% within HOW OFTEN
DOES R PRAY
35.9% 42.7% 0.0% 21.4% 100.0%
LT ONCE
A WEEK
Count 55 29 10 44 138
% within HOW OFTEN
DOES R PRAY
39.9% 21.0% 7.2% 31.9% 100.0%
NEVER Count 25 19 3 143 190
% within HOW OFTEN
DOES R PRAY
13.2% 10.0% 1.6% 75.3% 100.0%
Total Count 684 339 20 296 1339
% within HOW OFTEN
DOES R PRAY
51.1% 25.3% 1.5% 22.1% 100.0%
⊘ This is a preview!⊘
Do you want full access?
Subscribe today to unlock all pages.
Trusted by 1+ million students worldwide
SOSC884 SOCIAL RESEARCH DESIGN & ANALYSIS 10
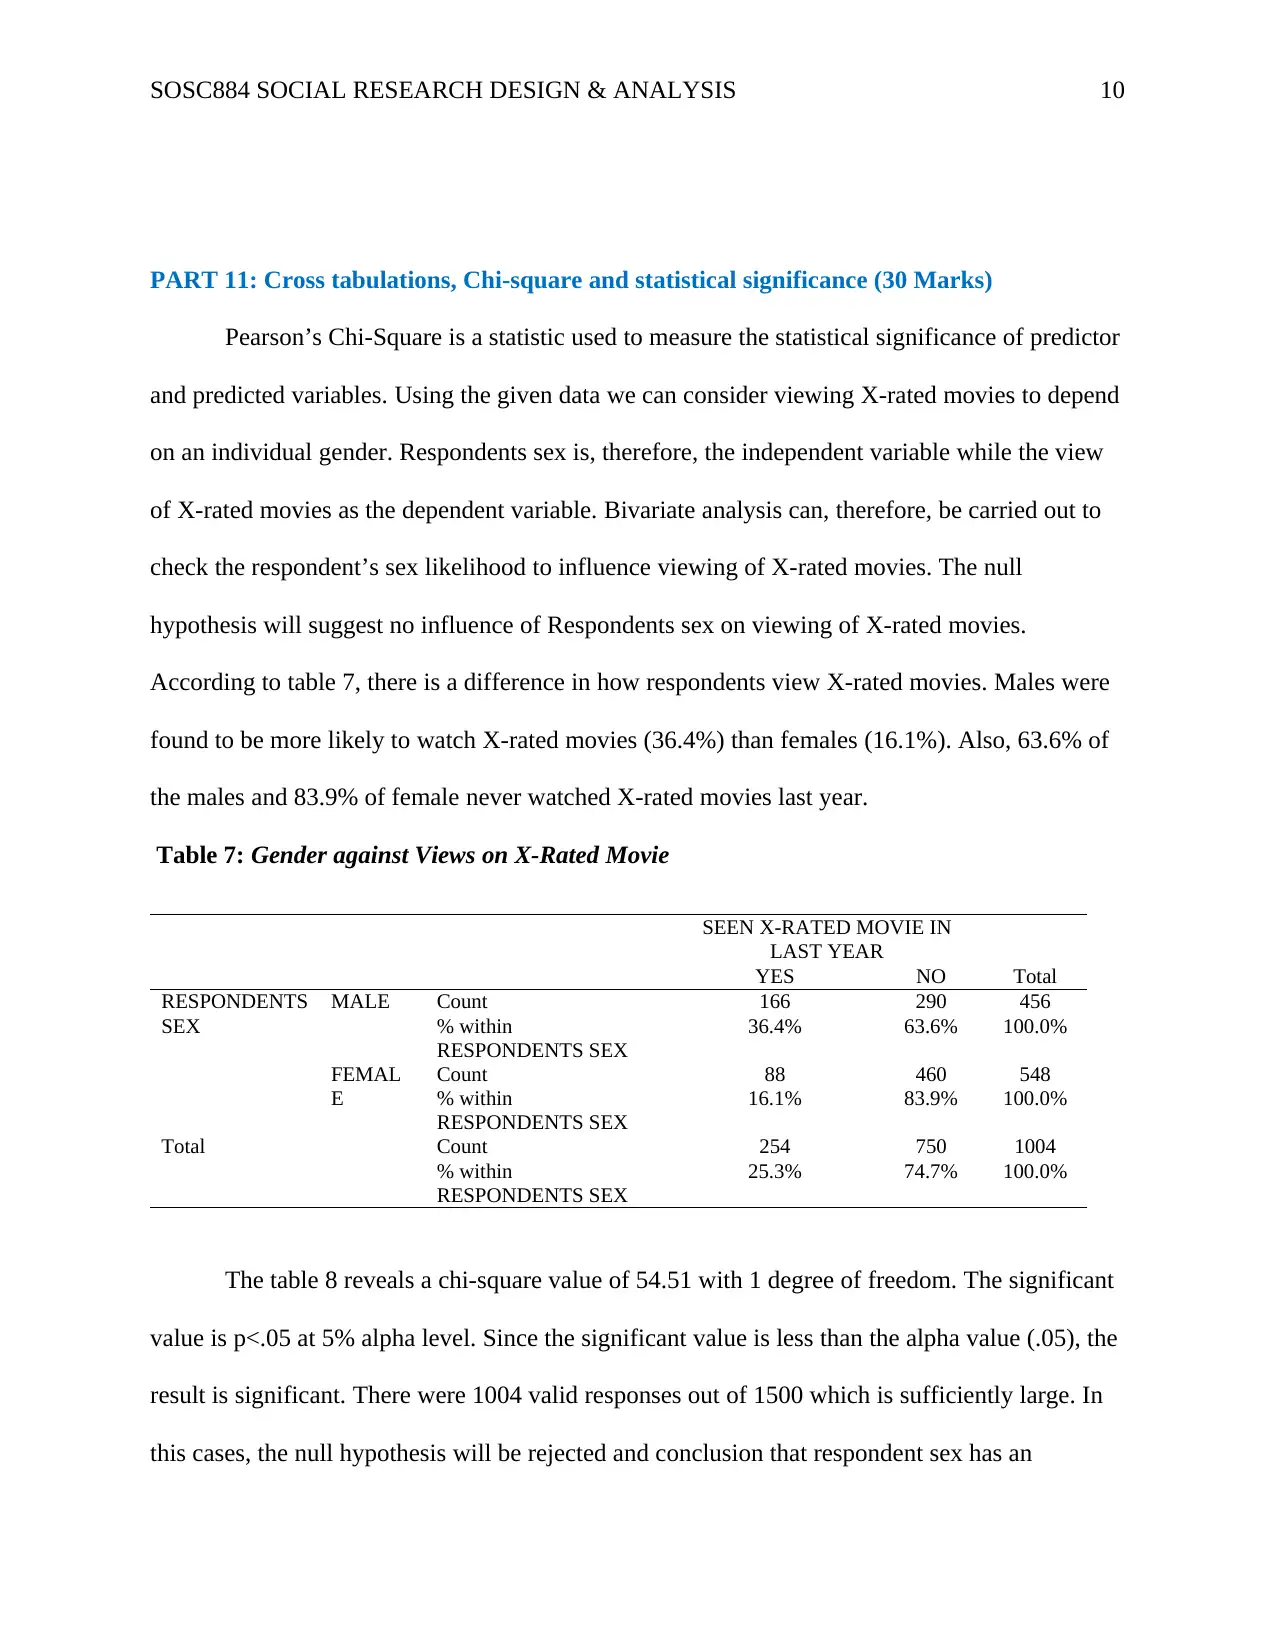
PART 11: Cross tabulations, Chi-square and statistical significance (30 Marks)
Pearson’s Chi-Square is a statistic used to measure the statistical significance of predictor
and predicted variables. Using the given data we can consider viewing X-rated movies to depend
on an individual gender. Respondents sex is, therefore, the independent variable while the view
of X-rated movies as the dependent variable. Bivariate analysis can, therefore, be carried out to
check the respondent’s sex likelihood to influence viewing of X-rated movies. The null
hypothesis will suggest no influence of Respondents sex on viewing of X-rated movies.
According to table 7, there is a difference in how respondents view X-rated movies. Males were
found to be more likely to watch X-rated movies (36.4%) than females (16.1%). Also, 63.6% of
the males and 83.9% of female never watched X-rated movies last year.
Table 7: Gender against Views on X-Rated Movie
SEEN X-RATED MOVIE IN
LAST YEAR
TotalYES NO
RESPONDENTS
SEX
MALE Count 166 290 456
% within
RESPONDENTS SEX
36.4% 63.6% 100.0%
FEMAL
E
Count 88 460 548
% within
RESPONDENTS SEX
16.1% 83.9% 100.0%
Total Count 254 750 1004
% within
RESPONDENTS SEX
25.3% 74.7% 100.0%
The table 8 reveals a chi-square value of 54.51 with 1 degree of freedom. The significant
value is p<.05 at 5% alpha level. Since the significant value is less than the alpha value (.05), the
result is significant. There were 1004 valid responses out of 1500 which is sufficiently large. In
this cases, the null hypothesis will be rejected and conclusion that respondent sex has an
Paraphrase This Document
Need a fresh take? Get an instant paraphrase of this document with our AI Paraphraser
SOSC884 SOCIAL RESEARCH DESIGN & ANALYSIS 11
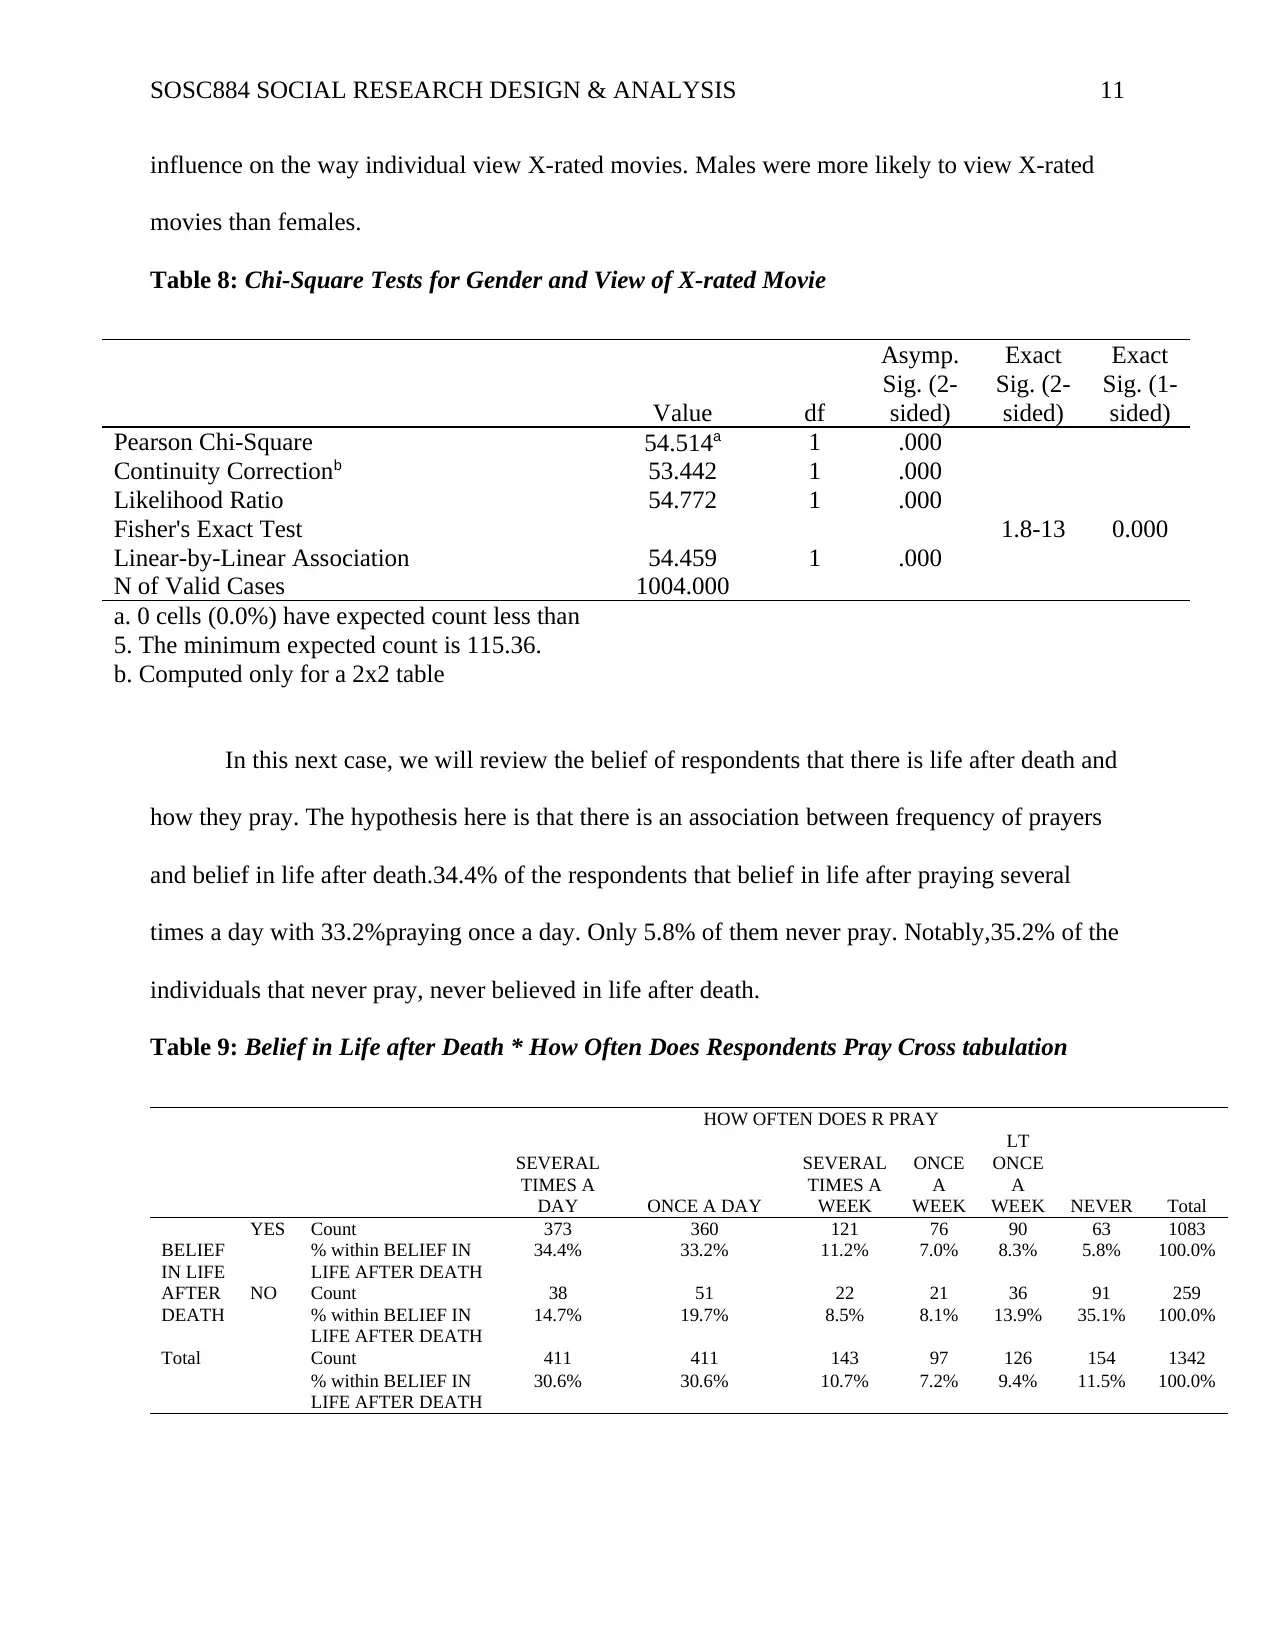
influence on the way individual view X-rated movies. Males were more likely to view X-rated
movies than females.
Table 8: Chi-Square Tests for Gender and View of X-rated Movie
Value df
Asymp.
Sig. (2-
sided)
Exact
Sig. (2-
sided)
Exact
Sig. (1-
sided)
Pearson Chi-Square 54.514a 1 .000
Continuity Correctionb 53.442 1 .000
Likelihood Ratio 54.772 1 .000
Fisher's Exact Test 1.8-13 0.000
Linear-by-Linear Association 54.459 1 .000
N of Valid Cases 1004.000
a. 0 cells (0.0%) have expected count less than
5. The minimum expected count is 115.36.
b. Computed only for a 2x2 table
In this next case, we will review the belief of respondents that there is life after death and
how they pray. The hypothesis here is that there is an association between frequency of prayers
and belief in life after death.34.4% of the respondents that belief in life after praying several
times a day with 33.2%praying once a day. Only 5.8% of them never pray. Notably,35.2% of the
individuals that never pray, never believed in life after death.
Table 9: Belief in Life after Death * How Often Does Respondents Pray Cross tabulation
HOW OFTEN DOES R PRAY
Total
SEVERAL
TIMES A
DAY ONCE A DAY
SEVERAL
TIMES A
WEEK
ONCE
A
WEEK
LT
ONCE
A
WEEK NEVER
BELIEF
IN LIFE
AFTER
DEATH
YES Count 373 360 121 76 90 63 1083
% within BELIEF IN
LIFE AFTER DEATH
34.4% 33.2% 11.2% 7.0% 8.3% 5.8% 100.0%
NO Count 38 51 22 21 36 91 259
% within BELIEF IN
LIFE AFTER DEATH
14.7% 19.7% 8.5% 8.1% 13.9% 35.1% 100.0%
Total Count 411 411 143 97 126 154 1342
% within BELIEF IN
LIFE AFTER DEATH
30.6% 30.6% 10.7% 7.2% 9.4% 11.5% 100.0%
SOSC884 SOCIAL RESEARCH DESIGN & ANALYSIS 12
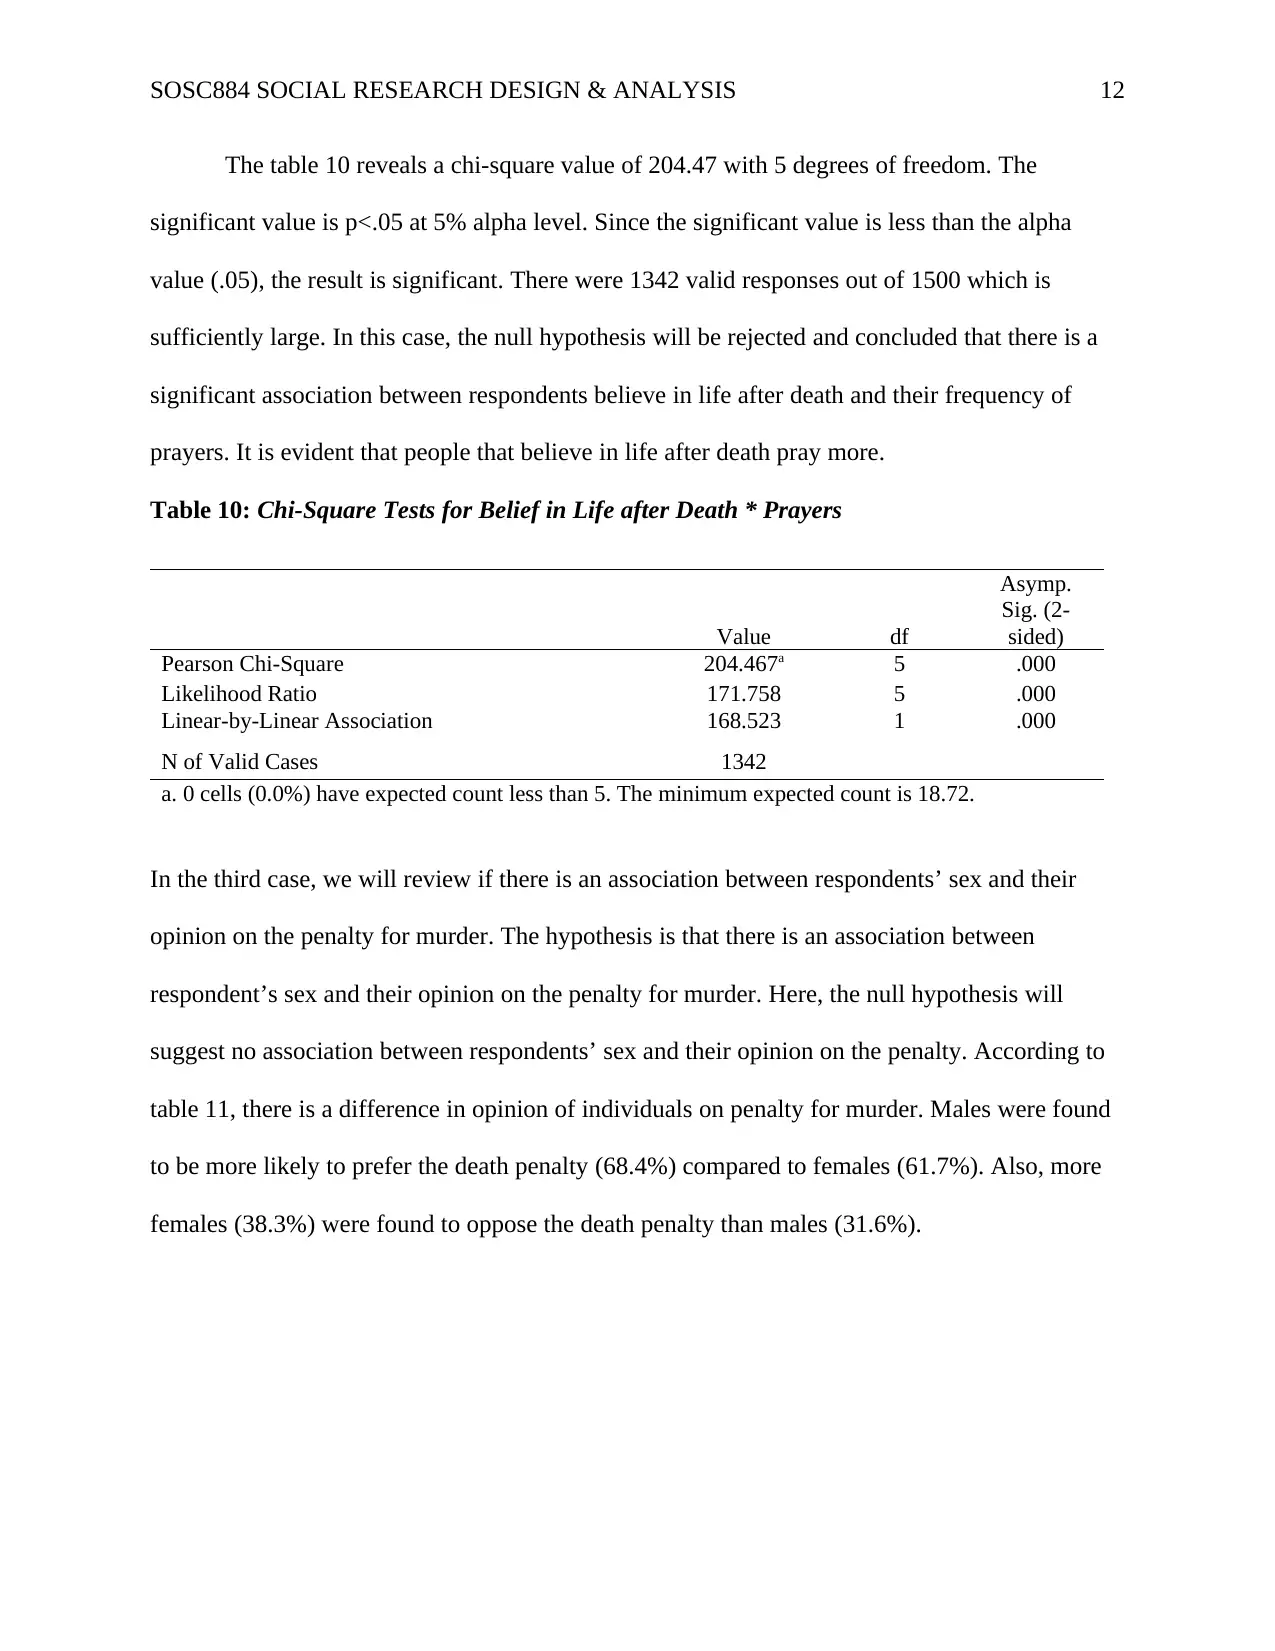
The table 10 reveals a chi-square value of 204.47 with 5 degrees of freedom. The
significant value is p<.05 at 5% alpha level. Since the significant value is less than the alpha
value (.05), the result is significant. There were 1342 valid responses out of 1500 which is
sufficiently large. In this case, the null hypothesis will be rejected and concluded that there is a
significant association between respondents believe in life after death and their frequency of
prayers. It is evident that people that believe in life after death pray more.
Table 10: Chi-Square Tests for Belief in Life after Death * Prayers
Value df
Asymp.
Sig. (2-
sided)
Pearson Chi-Square 204.467a 5 .000
Likelihood Ratio 171.758 5 .000
Linear-by-Linear Association 168.523 1 .000
N of Valid Cases 1342
a. 0 cells (0.0%) have expected count less than 5. The minimum expected count is 18.72.
In the third case, we will review if there is an association between respondents’ sex and their
opinion on the penalty for murder. The hypothesis is that there is an association between
respondent’s sex and their opinion on the penalty for murder. Here, the null hypothesis will
suggest no association between respondents’ sex and their opinion on the penalty. According to
table 11, there is a difference in opinion of individuals on penalty for murder. Males were found
to be more likely to prefer the death penalty (68.4%) compared to females (61.7%). Also, more
females (38.3%) were found to oppose the death penalty than males (31.6%).
⊘ This is a preview!⊘
Do you want full access?
Subscribe today to unlock all pages.
Trusted by 1+ million students worldwide
1 out of 14

Your All-in-One AI-Powered Toolkit for Academic Success.
+13062052269
info@desklib.com
Available 24*7 on WhatsApp / Email
![[object Object]](/_next/static/media/star-bottom.7253800d.svg)
Unlock your academic potential
Copyright © 2020–2025 A2Z Services. All Rights Reserved. Developed and managed by ZUCOL.