logo

SOURCES OF ENERGY 14 ENERGY SOURCES

Analyse and organise energy data from different sources; Explain why past predictions of energy sources differ from what actually happened; Describe the main uses of different fuels; Produce a well written, concise report appropriate for postgraduate level.

14 Pages2666 Words182 Views
   

Added on  2022-08-12

About This Document

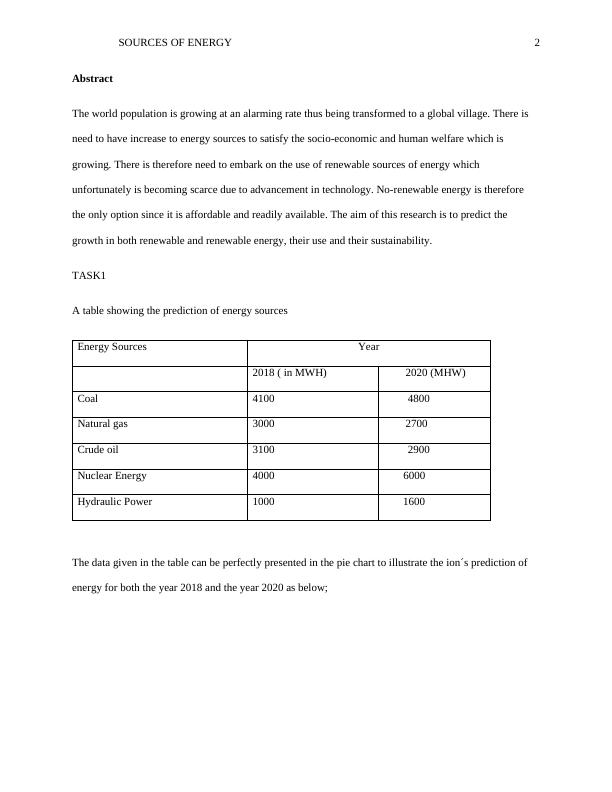
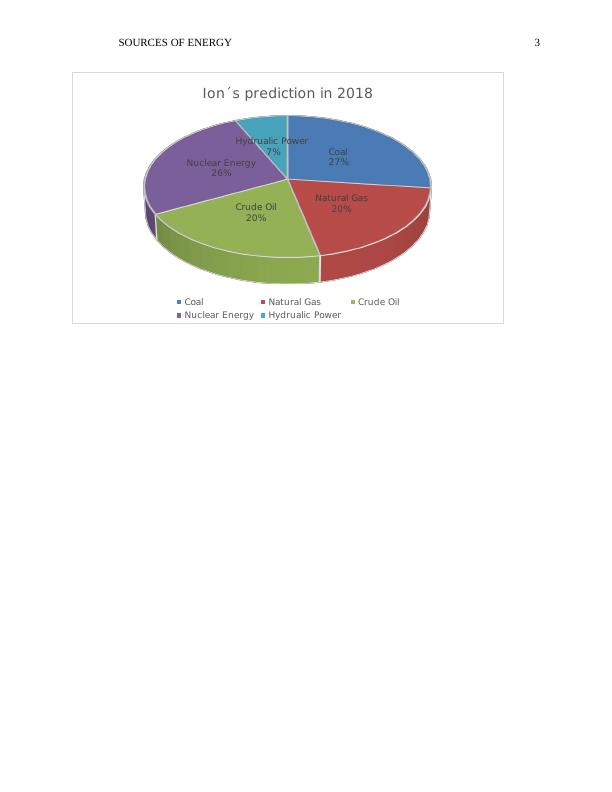
TASK1 A table showing the prediction of energy sources of Energy Sources Year 2018 ( in MWH) 2020 (MHW) Coal 4100 Natural gas 3000 2700 Crude oil 3100 2900 Nuclear Energy 4000 6000 Hydraulic Power 1000 1600 The data given in the table can be perfectly presented in the pie chart to illustrate the ion s prediction of energy for both the year 2018 and the year 2020 as below; The information used to come up with the table and the pie chart showing

SOURCES OF ENERGY 14 ENERGY SOURCES

Analyse and organise energy data from different sources; Explain why past predictions of energy sources differ from what actually happened; Describe the main uses of different fuels; Produce a well written, concise report appropriate for postgraduate level.

   Added on 2022-08-12

ShareRelated Documents
SOURCES OF ENERGY 1
ENERGY SOURCES
By Name
Course
Instructor
Institution
Location
Date
SOURCES OF ENERGY 14 ENERGY SOURCES_1
SOURCES OF ENERGY 2
Abstract
The world population is growing at an alarming rate thus being transformed to a global village. There is
need to have increase to energy sources to satisfy the socio-economic and human welfare which is
growing. There is therefore need to embark on the use of renewable sources of energy which
unfortunately is becoming scarce due to advancement in technology. No-renewable energy is therefore
the only option since it is affordable and readily available. The aim of this research is to predict the
growth in both renewable and renewable energy, their use and their sustainability.
TASK1
A table showing the prediction of energy sources
Energy Sources Year
2018 ( in MWH) 2020 (MHW)
Coal 4100 4800
Natural gas 3000 2700
Crude oil 3100 2900
Nuclear Energy 4000 6000
Hydraulic Power 1000 1600
The data given in the table can be perfectly presented in the pie chart to illustrate the ion ́s prediction of
energy for both the year 2018 and the year 2020 as below;
SOURCES OF ENERGY 14 ENERGY SOURCES_2
SOURCES OF ENERGY 3
Coal
27%
Natural Gas
20%Crude Oil
20%
Nuclear Energy
26%
Hydrualic Power
7%
Ion ́s prediction in 2018
Coal Natural Gas Crude Oil
Nuclear Energy Hydrualic Power
SOURCES OF ENERGY 14 ENERGY SOURCES_3
SOURCES OF ENERGY 4
27%
15%
16%
33%
9%
Ion ́s Preduction in 2020
Coal Natural gas Crude oil
Nuclear Energy Hydraulic Power
The information used to come up with the table and the pie chart showing energy prediction in the year
2020 and the year 2018 was derived from the document called Ion (1975).
Task 2
Inexhaustible sources of energy refer to the types of energy sources that cannot be depleted. They are of
endless supply hence most reliable (Balasubramanian, 2016). Inexhaustible energy includes the
following: wind, geothermal energy, air, and solar energy.
Energy prediction difference for 2018 and 2020 and the reasons
There is an increase of 2% in the energy prediction in hydraulic power, the prediction increased from 7%
in the year 2018 to 9% in 2020. The difference is brought about by the fact that there is an increase in
population thus the demand for hydraulic power increase too.
SOURCES OF ENERGY 14 ENERGY SOURCES_4

End of preview

Want to access all the pages? Upload your documents or become a member.

Related Documents
SOURCES OF ENERGY AND ITS OVERVIEW
|12
|2669
|15

Global Energy Resources: Differences between Projections and Current Usage
|15
|3000
|392

Patterns of Energy Use: A Comparison of Primary Energy Sources in 2020
|12
|2427
|87

Practical Application of Renewable Energy Technology
|32
|6094
|22

Renewable Energy Adoption and Efficiency in Devon
|37
|6560
|29

Unit 44 - Industrial Power, Electronics and Storage
|9
|3716
|62